Int. J. Electrochem. Sci., 13 (2018) 8116 – 8126, doi: 10.20964/2018.08.72
International Journal of
ELECTROCHEMICAL
SCIENCE
www.electrochemsci.org
The Effect of Heating Rate on the Structure and
Electrochemical Performance of the Li-rich Cathode Material
Li
1.2Ni
0.15Co
0.10Mn
0.55O
2Prepared Using the Co-precipitation
Method
Rui-ming Yang1,2 , Ying-jie Zhang1,*, Peng Dong1,*, Yan-nan Zhang1
1
National and Local Joint Engineering Laboratory for Lithium-ion Batteries and Materials Preparation Technology, Key Laboratory of Advanced Battery Materials of Yunnan Province, Faculty of Materials Science and Engineering, Kunming University of Science and Technology, Kunming 650093, China.
2
College of Physics and Electronic Engineering, Qujing Normal University, Qujing 655011, China.
*
E-mail:dongpeng2001@126.com
Received: 23 April 2018 / Accepted: 14 June 2018 / Published: 5 July 2018
The lithium-rich cathode material Li1.2Ni0.15Co0.10Mn0.55O2 was prepared via co-precipitation and
solid-phase sintering. The morphology, electrochemical properties and storage properties of the sample under different heating rates were measured using SEM, XRD, an electrochemical workstation, a battery test system and ICP (solubility). Our results show that the morphology and electrochemical performance of the prepared cathode material can be effectively controlled by adjusting the heating rate during the sintering process. At a 20 oC/min heating rate, a layered structure with good crystallinity and low-cation mixing can be formed. In the 3.0-4.8 V range, 0.1 C, the 50-cycle capacity retention rate is 82.7%, and the discharge specific capacity can reach 131 mAh·g−1 at 5 C; at the same time, the samples prepared at this temperature increase rate with a lower electrochemical transfer impedance. In addition, after the electrolyte was stored for 3 weeks, the concentration of Ni ions in the electrolyte was 39.44 ppm, which was significantly lower than that of other samples. From the study presented here, we have shown that controlling the heating rate in the sintering process can effectively regulate the structure of the cathode material and improve its electrochemical performance.
Keywords: Lithium-rich cathode material, heating rate, structure control, electrochemical performance
1. INTRODUCTION
Following the development of lithium-ion batteries for electricity-powered vehicles, the demand for specific energy (300 Wh kg-1) lithium-ion batteries has increased, which has prompting
characteristics [1,2]. In recent years, the lithium-manganese-based cathode material xLi2MnO3
(1-x)LiMO2 (M=Ni, Co, Mn, etc.) has received extensive attention due to its high specific capacity, high
mass-to-energy density, and it has become an ideal cathode material [3,4]. However, too many kinds of internal elements, and Ni, Co, and Mn cations are fractional, which leads to problems such as a low first-pass Coulomb effect, poor rate performance, and a deteriorating cycle life of lithium-rich cathode materials, which seriously restricts their commercial application [5,6].
Previous work has shown that the electrochemical performance of lithium-rich cathode materials is related to their layered structure [7,8]. Therefore, to get a stable layered structure, the development of lithium-rich cathode materials with excellent electrochemical performance has become a hot research topic [9]. Zang Yong [10] used the thermal polymerization method to prepare 0.5Li2MnO3·0.5LiNi0.5Mn0.5O2, and studied the effect of different sintering times on its morphology
and performance. This author found that extending the holding time can improve the crystallization performance, where the prepared material had a higher specific discharge capacity (230 mAh g−1) when sintering at 950°C for 10 h. Xiang [11] prepared an Li(Li0.2Ni0.17Co0.16Mn0.47)O2 material using
the solid-state sintering method and found that the annealing temperature can effectively regulate the size of the material particles and its initial discharge specific capacity. These reports show that reasonable preparation and heat treatment processes can result in a layered structure of a stable lithium-rich cathode material [12]. This is achieved by effectively reducing the diffusion barrier of the Li+ in the charging and discharging processes, which ultimately improves the electrochemical
properties of the material [13]. Moreover, the heating rate in the sintering process is an important step in the preparation method used for lithium-rich cathode materials [14]. However, at present, there are still no reports on the related mechanism of the structure and properties of positive electrode lithium-rich manganese-based cathode materials [15].
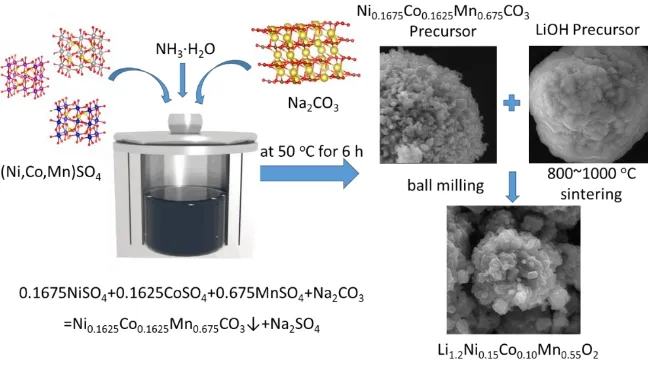
Therefore, the Ni0.1675Co0.1625Mn0.675CO3 precursor was prepared using the co-precipitation
method. The lithium was sintered at different heating rates, and a layered lithium-rich cathode material Li1.2Ni0.15Co0.10Mn0.55O2 was synthesized. The effect of the heating rate on the morphology and
electrochemical performance of this lithium-rich cathode material is studied systematically in this work.
2.
EXPERIMENTAL
2.1 Preparation of materials
The Ni0.1675Co0.1625Mn0.675CO3 precursor was produced via the co-precipitation method. NiSO4,
CoSO4, and MnSO4 were mixed in deionized water (n(Ni) : n(Co) : n(Mn) = 0.1625:0.1625:0.675).
The reaction was kept at 50 oC for 6 h and the pH was adjusted to 8.2 with an NaOH solution.
Next, a mixture of dehydrated Ni0.1675Co0.1625Mn0.675CO3 and LiOH (n(Li) :
n(Ni0.1675Co0.1625Mn0.675CO3) = 1.05:1), where the Li source was 5% excess, and lithium hydroxide
increased from room temperature to 850 oC. After cooling, different heating rates were obtained. The four samples at the rate were labeled S-5, S-10, S-20 and S-30, respectively.
Figure 1. Preparation schematic of Lithium-rich cathode material Li1.2Ni0.15Co0.10Mn0.55O2
2.2 Materials characterization
A LEO 1530Vp scanning electron microscope (SEM) was used to characterize the surface morphology of the sample (the acceleration potential was 5 kV), and an energy element spectrometer was used to analyze the type and content of the surface elements. The morphology of the samples was determined using a Tecnai G2 20 S-TWIN transmission electron microscope produced the FEI Company in the Netherlands. The Bruker (Germany) D8 ADVANCE automatic X-ray diffractometer was used to analyze the phase composition of the sample. The X-ray source was Cu Kα (1486.6 eV, λ
= 0.15406 nm), which has an operating potential of 30 kV, a current of 30 mA, a step length of 0.5, and the diffraction angle range was 10°≤ 2θ ≤ 80°. The concentration of Ni metal ions stored in the electrolyte in the sample was tested using ICP (Thermoelectric, USA).
2.3 Electrochemical measurements
The positive electrode of the investigated battery was a self-manufactured lithium-rich positive electrode plate, while the negative electrode was a metal lithium plate, the separator was a porous polyethylene film of Celgard 2400, and the electrolyte was 1 mol/L of LiPF6, in which the solvent was
ethylene carbonate dimethyl carbonate, and methyl ethyl carbonate, with a volume ratio of 1:1:1. We placed the positive electrode in the battery case, and added 3-4 drops of electrolyte to wet it. Next, we added the diaphragm, lithium plate, stainless steel gasket, stainless steel shrapnel, and then added 3-4 drops of electrolyte, and finally covered the battery case. The battery packer was packaged into a sealed CR2025 button cell. The entire assembly process was performed in a glove box filled with an argon atmosphere, and the water and oxygen content was <5 ppm.
3.1 Micromorphology and Phase
Figures 2a-d show the SEM images of samples prepared by sintering at 5, 10, 20 and 30 oC/min for 10 h. The samples obtained at different heating rates have secondary grain sizes in the 15-20 μm range, and the S-5 sample has good dispersibility at a 5°C/min heating rate, but the particle size is very good. Inhomogeneity, most of the grain shape is irregular; as the heating rate increases, the primary particle size of the sample gradually decreases. When at a 20oC/min heating, the primary particle size of the sample is kept within 2 μm, the crystal surface is smooth, and the material agglomerates into regular, secondary spherical particles. When the heating rate is increased to 30oC/min, the primary grain size further decreases and fractures, and irregular agglomeration appear on the edges and corners of some grains. Therefore, at a heating rate < 20°C/min, the sample has good crystallinity and a regular spheroidal appearance [16,17].
Figure 2. SEM images of samples prepared at different heating rates (a) 5 oC/min (b) 10 oC /min (c) 20
oC/min (d) 30 oC/min
Figure 3a shows the XRD patterns of the Li1.2Ni0.15Co0.1Mn0.55O2 cathode material sintered at
5, 10, 20 and 30 oC/min for 10 h. It can be seen that, except for the superlattice peaks between 20o and 25o, the corresponding diffraction peaks belong to the α-NaFeO2 structure and the R3
_
consistent with the results of Shi [20,21].
Figure 3. XRD of samples prepared at different heating rates:(a)5 oC/min,(b)10 oC/min,(c)20
oC/min, and(d)30 oC/min.
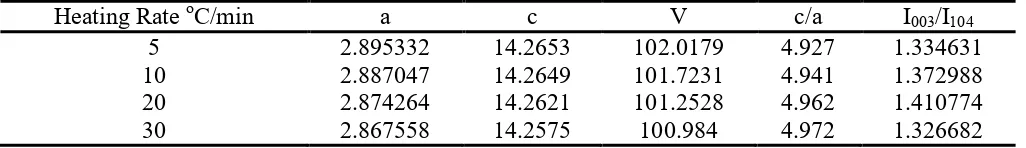
Table 1. Unit cell parameters of the lithium-rich ternary cathode materials prepared at different heating rates
Heating Rate oC/min a c V c/a I003/I104
5 2.895332 14.2653 102.0179 4.927 1.334631
10 2.887047 14.2649 101.7231 4.941 1.372988
20 2.874264 14.2621 101.2528 4.962 1.410774
30 2.867558 14.2575 100.984 4.972 1.326682
To further observe the superlattice peak, an XRD pattern with a 2θ diffraction angle of 20°-25° was used (Fig. 3b). Samples S5-S30 show weak monoclinic Li2MnO3 characteristic peaks (C/2c)
between 20° and 25°, corresponding to the (020) and (110) diffraction peaks. The unit cell parameters of the sintered material at different heating rates are shown in Table 1, which gives the c/a values and the I003/I104 peak intensities. With an increase in the heating rate, the a-value, c-value and unit cell volume V in the sample cell parameters decrease, and the c/a values are all > 4.9, which indicates that the materials prepared under different heating rates have better performance and good layered structures. However, at a 20°C/min heating rate, the I003/I104 ratio I003/I104 is the largest, which means
that the material prepared at this temperature has the smallest cation mixing degree, which is conducive to the stability of the layered structure [22].
[image:5.596.44.557.418.492.2]To further study the effect of different heating rates on the electrochemical performance of the Li1.2Ni0.15Co0.1Mn0.55O2 cathode material, we evaluated its cycling performance, rate performance,
[image:6.596.208.378.303.440.2]cyclic voltammetry curve and AC impedance.
Figure 4 shows the cycling curves at a 0.1 C current density (1 C = 200 mA g−1) for samples prepared at different heating rates. The initial discharge specific capacities of the samples prepared at the heating rates of 5, 10, 20 and 30°C/min were 214, 222, 225, and 199 mAh·g−1, respectively. When the heating rate increased to 20°C/min, the initial discharge capacity of the sample was the highest. The capacity of samples S-5, S-10, S-20, and S-30 prepared under the conditions of 5, 10, 20, and 30°C/min after 50 cycles at 0.1 C is 175,176,186, and 164 mAh·g−1, respectively. After 50 cycles, their capacity retention rates were 81.8%, 79.3%, 82.7%, and 82.4%, respectively. In summary, samples prepared at a heating rate of 20°C/min have the highest specific discharge capacity and excellent cycle life [23].
[image:6.596.211.370.502.628.2]0 10 20 30 40 50 135 150 165 180 195 210 225 S-5 S-10 S-20 S-30 Disch arg e Capa ci ty / mAh g -1 Cycle number
Figure 4. Cycling performance of samples at different heating rates at 2-4.8 V and 0.1 C: (a) 5 oC/min, (b)10 oC/min, (c) 20 oC/min, and (d) 30 oC/min.
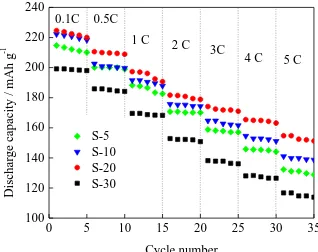
0 5 10 15 20 25 30 35
100 120 140 160 180 200 220 240 5 C 4 C 3C 2 C 1 C 0.5C S-5 S-10 S-20 S-30 Disch arg e ca p ac it y / mAh g -1 Cycle number 0.1C
Figure 5. Typical plot of discharge capacities vs. number of cycles at various current rates with different heating rates: (a) 5 oC /min, (b) 10 oC /min, (c) 20 oC /min, and (d) 30 oC/min.
C discharge rate, which indicates that the sample prepared at 20°C/min has an excellent rate performance [24].
To investigate the performance of the Li1.2Ni0.15Co0.1Mn0.55O2 obtained in this work, we
compared its cycling with other similar lithium-rich ternary cathode materials. Their performances and related comparative data are shown in Table 2. The Li1.2Ni0.15Co0.1Mn0.55O2 cathode material obtained
in this work shows a favorable capacity retention rate (82.7%) compared with other lithium-rich ternary cathode materials. This shows that the Li1.2Ni0.15Co0.1Mn0.55O2 prepared in this work has good
electrochemical performance.
Table 2. Comparison of the cycle performance with other lithium-rich ternary cathode materials reported in recent years
Lithium-rich cathode material Methods Capacity retention
Li1.2Ni0.15Co0.10Mn0.55O2
(our work) Co-deposition method 82.7%, 50 cycles, 0.1 C Li1.2Ni0.13Co0.13Mn0.54O2 [25] Co-precipitation method 62%, 100 cycles, 0.2 C
Li1.2Ni0.13Co0.13Mn0.54O2 [26] Sol-gel method 72.4%, 50 cycles, 0.2 C
Li1.2Ni0.15Co0.10Mn0.55O2 [27] Sol-gel method 79%, 40 cycles, 0.1 C
Li1.2Ni0.13Co0.13Mn0.54O2 [28] Co-precipitation method 81.04%, 80 cycles, 0.1 C
Li1.2Ni0.16Co0.08Mn0.56O2 [29] Wet chemical process 71.4%, 80 cycles, 1 C
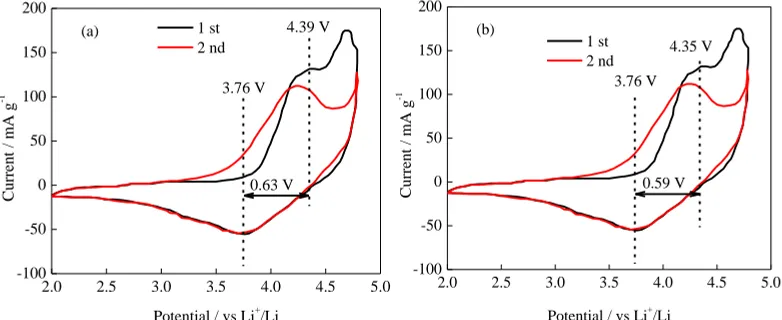
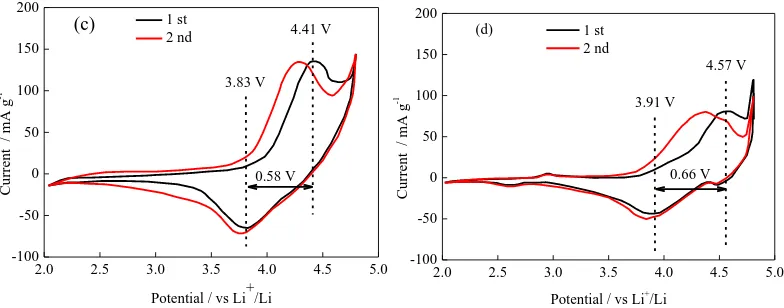
To further study the effect of different heating rates on the material properties, the first two cyclic voltammograms of the four groups of samples were studied, (Figure 6), for a scan rate of 0.2 mV·s−1 and a voltage range of 2 to 4.8 V. During the first week of negative scans, the cyclic voltammograms showed a large, broad peak in the range of 3.4 to 4.2 V, corresponding to a reduction of Ni, Co, and Mn cations. During the forward scan, the difference between the oxidation and reduction peaks of the cyclic voltammogram is 0.63, 0.58, 0.59, and 0.66 V, respectively, as the heating rate increased from 5 to 30°C/min. The S-20 sample has the smallest peak value of redox, indicating that the sample prepared under this condition has less polarization and excellent electrochemical stability [30].
2.0 2.5 3.0 3.5 4.0 4.5 5.0
-100 -50 0 50 100 150 200 Cu rr en t / m A g -1
Potential / vs Li+/Li
1 st 2 nd
(a) 4.39 V
3.76 V
0.63 V
2.0 2.5 3.0 3.5 4.0 4.5 5.0
-100 -50 0 50 100 150 200 Cu rre n t / m A g -1
Potential / vs Li+/Li
[image:7.596.104.495.562.722.2]2.0 2.5 3.0 3.5 4.0 4.5 5.0 -100 -50 0 50 100 150 200 1 st 2 nd Cur rent / m A g -1
Potential / vs Li+/Li
0.58 V
(c) 4.41 V
3.83 V
2.0 2.5 3.0 3.5 4.0 4.5 5.0
-100 -50 0 50 100 150 200 1 st 2 nd Cur rent / mA g -1
Potential / vs Li+/Li
0.66 V (d)
4.57 V
[image:8.596.103.495.72.226.2]3.91 V
Figure 6. Cyclic voltammetries of samples at different heating rates: (a) 5 oC/min, (b) 10 oC/min, (c) 20 oC/min, and (d) 30 oC/min.
Figure 7 shows the AC impedance diagrams of the samples prepared at the four different heating rates. Equivalent circuit diagrams and Rct and Re values are shown in Figure 7 and Table 3, where Rct represents the charge transfer resistor, Re represents the internal resistance of the material, and Rs is the solution resistance. Zw is the Warburg impedance. The AC impedance map consists of a semicircle in the high-frequency region and a slanted line in the low-frequency region, where the semicircle in the high-frequency region is caused by the charge transfer reaction occurring at the electrolyte/electrode interface, and the smaller the radius of the semicircle, the smaller the impedance. We can see that the radius of the sample prepared at different heating rates is R20 < R10 <R5 < R30,
indicating that the electrochemical impedance of the Li1.2Ni0.15Co0.1Mn0.55O2 cathode material
decreased first and then increased. The cathode material of Li1.2Ni0.15Co0.10Mn0.55O2 prepared at
20°C/min is conducive to the diffusion of Li+. Corresponding to the performance, with the smallest charge transfer impedance and material internal resistance [31].
0 50 100 150 200 250 300
0 50 100 150 200 Z /ohm
Z/ohm
S-5 S-10 S-20 S-30
Figure 7. Electrochemical impedance of the different samples: (a) 5 oC/min, (b) 10 oC/min, (c) 20
[image:8.596.183.416.500.678.2]Table 3. Re and Rct values of the different samples fitted by the equivalent circuit.
Sample 5 oC/min 10 oC/min 20 oC/min 30 oC/min
Re 3.12 2.93 2.54 9.57
Rct 165.8 133.2 105.5 188.1
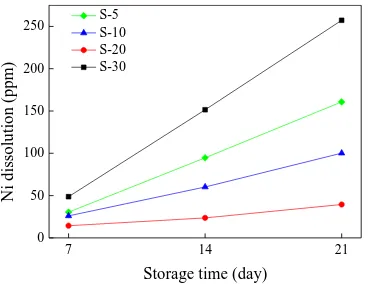
At the same time, the stability of the cathode material is related to the dissolution of the more abundant elements in the electrolyte. Figure 8 shows the change of nickel concentration in the electrolyte after the samples were stored in the electrolyte for 1, 2, and 3 weeks, respectively, at different heating rates. The nickel concentration in the four groups of samples increased with the storage time, and the samples with heating rates of 5, 10, 20, and 30 oC/min were electrolysis. After 1 week of storage, the nickel ion concentrations for the four heating rates were 30.4, 26.0, 14.4, and 48.64 ppm, respectively. After 3 weeks of storage, the nickel ion concentrations were 160.75, 100.16, 39.44, and 257.2 ppm, respectively, for the same rating rates. It is known that the Li1.2Ni0.15Co0.10Mn0.55O2 cathode material prepared at 20 oC/min is minimally attacked by the
electrolyte, which is an important factor for the sample prepared under this condition to have better specific discharge capacity and cyclical stability. [32].
7 14 21
0 50 100 150 200 250
Ni d
iss
oluti
on (
ppm)
Storage time (day)
S-5 S-10 S-20 S-30
Figure 8. Relationship between Ni dissolution and storage time after storage of different samples in electrolytes.
4. CONCLUSIONS
In this work, a series of lithium-rich layered cathode materials Li1.2Ni0.15Co0.10Mn0.55O2 were
successfully prepared using the co-precipitation and high-temperature solid-phase methods. The effects of different heating rates on the solid-phase sintering of the structure and the electrochemical performance of the material were examined. It was found that the Li1.2Ni0.15Co0.10Mn0.55O2 samples
prepared at a 20 oC/min heating rate had better crystallinity and a lower degree of cation mixing, as well as good cycling and a good rate performance. The initial discharge specific capacity was 220 mAh g−1, and the capacity retention rate reached 82.76% after 50 cycles. The discharge specific capacity was 131 mAh g−1 at 5 C rates. The AC impedance and ICP measurements show that the Li1.2Ni0.15Co0.10Mn0.55O2 cathode material prepared at a heating rate of 20°C/min exhibits the smallest
[image:9.596.208.392.362.504.2]the lithium-rich cathode material Li1.2Ni0.15Co0.10Mn0.55O2 can be effectively improved by adjusting the
heating rate, which may provide new ideas for the preparation of extra high-performance lithium-rich cathode materials.
ACKNOWLEDGEMENTS
This work was supported financially by the National Nature Science Foundation of China (No. 51764029).
References
1. K. Mu, Y. Cao, G. Hu, K. Du, H. Yang, Z. Gan and Z. Peng, Electrochim. Acta, 273(2018)88. 2. S. Shen, Y Hong, F Zhu, Z Cao, Y Li, F Ke, J Fan, L Zhou, L Wu, P Dai, M Cai, L Huang, Z Zhou,
J Li, Q Wu and S Sun, Acs. Appl. Mater. Inter., 10(2018)12666.
3. F. Nomura, Y. Liu, T. Tanabe, N. Tamura, T. Tsuda, T. Hagiwara, T. Gunji, T. Ohsaka and F. Matsumoto, Electrochim. Acta, 3(2018)321.
4. Y. Wu, L. Xie, X. He, L. Zhuo, L. Wang and J. Ming, Electrochim. Acta, 265(2018)115.
5. N. Leifer, I. Matlahov, E. Erickson, H. Sclar, F. Schipper, J. Shin, C. Erk, F. Chesneau, J. Lampert, B. Markovsky, D. Aurbach and G. Goobes, J. Phys. Chem. C.,7(2018)3773.
6. Y. Liu, D. Ning, L. Zheng, Q. Zhang, L. Gu, R. Gao, J. Zhang, A. Franz, G. Schumacher and X. Liu, J. Power Sources, 375(2018)1.
7. J. Huang, H. Liu, T. Hu, Y. Meng and J. Luo, J. Power Sources, 375(2018)21. 8. J. Wang, B. Qiu, H. Cao, Y. Xia and Z Liu, J. Power Sources, 218(2012)128.
9. J. Kong, X. Yang, H. Zhai, C. Ren, H. Li, J. Li, Z. Tang and F. Zhou, J. Power Sources, 580 (2013)491.
10. Y. Zang, C. Ding, X. Wang, Z. Wen and C. Chen, Electrochim. Acta, 168(2015)234. 11. Y. Xiang, Z. Yin, Y. Zhang and X. Li, Electrochim. Acta, 91(2013)214.
12. Y. Liu, N. Wu and W. Liu, J. Nanosci. Nanotechno., 18(2018)68.
13. S. Gao, T. Yang, H. Zhang, D. Song, X. Shi and L. Zhang, J. Alloy. Compd., 729(2017)695. 14. L. Yi, Z. Liu, R. Yu, C. Zhao, H. Peng, M. Liu, B. Wu, M. Chen, and X. Wang, Acs. Sustain.
Chem. Eng., 5(2017)11005.
15. S. Kim, M. Aykol, V. Hegde, Z. Lu, S. Kirklin, J. Croy, M. Thackeray and C. Wolverton, Energ. Environ. Sci., 10(2017)2201.
16. G. Wang, L Yi, R. Yu, X Wang, Y Wang, Z. Liu, B. Wu, M. Liu, X. Zhang, X. Yang, X. Xiong and M. Liu, Acs. Appl. Mater. Inter., 9(2017)25358.
17. D. Chen, Q. Yu, X. Xiang, M. Chen, Z. Chen, S. Song, L. Xiong, Y. Liao, L. Xing and W. Li, Electrochim. Acta, 2015, 154: 83-93.
18. Y. Song, X. Zhao, C. Wang, H. Bi, J. Zhang, S. Li, M. Wang and R Che, J. Mater. Chem. A, 5(2017)11214.
19. Z. Zheng, W. Hua, S. Liao, Y. Zhong, E. Wang, B. Xu, H Liu and B Zhong, Rsc. Adv., 5(2015)58528.
20. F. Yu, L. Que, Z. Wang, Y. Xue, Y. Zhang, B. Liu and D. Gu, J. Mater. Chem. A, 5(2017)9365. 21. A. Jena, Cho. Lee, W. Pang, V. Peterson, N. Sharma, C. Wang, Y. Song, C. Lin, H. Chang and R.
Liu, Electrochim. Acta, 236(2017)10.
22. S. Yang and J. Son, J. Nanosci. Nanotechno., 17(2017)3492. 23. R. Benedek and H. Iddir, J. Phys. Chem. C, 121(2017)6492.
24. J. Zheng, J. Li, Z. Zhang, X. Guo and Y. Yang, Solid State Ionics, 179(2008)1794. 25. Y. Jiang, F. Zhou, C. Wang, J. Kong and L Xu, Ionics, 23(2017)585.
27. F. Wu, H. Wang, Y. Bai, Y. Li, C. Wu, G. Chen, L. Liu, Q. Ni, X. Wang and J. Zhou. Solid State Ionics, 300(2017)149.
28. H. Shim, D. Kim, D. Shin, S. Hyun, C. Woo, T. Yu and J. Ahn, Phys. Chem. Chem. Phys., 19(2017)1268.
29. F. Ding, J. Li, F. Deng, G. Xu, Y. Liu, K. Yang and F. Kang, Acs. Appl. Mater. Inter., 9(2017)27936.
30. X. Hou, J. Liang, T. Zhang, Y. Li, S. Tang, H. Sun, J. Zhang and H. Xie, J. Phys. Chem. C, 121(2017)22656.
31. H. Chen, Q. Hu, W. Peng, H. Guo, G. Yan and X. Wu, Ceram. Int., 43(2017)10919. 32. L. Zhao, E. Han, L. Zhu and Y. Li, Ionics, 20(2014)1193.