Level Atomic System
by
Peter John Manson
A thesis submitted for the degree of Doctor of Philosophy of the Australian National University.
I would like to thank my supervisors, Dr. John Sandeman and Dr. Hans Bachor, for their guidance and encouragement during the course of this work.
I would also like to thank Dr. Sandeman, Dr. Carl Dahlstrom and Dr. Peter Fisk for their careful proof reading and
The non-linear interaction between two laser fields and a multi-level, Doppler broadened system was investigated, using modified saturated absorption and polarisation
spectroscopy on the transition of sodium.
The modifications to standard experiments involved using a co-propagating geometry for the two lasers and a fixed pump laser frequency during the scans. Profiles were recorded as the probe laser frequency was scanned through resonance with the transition for a number of pump laser frequencies in the vicinity of the same transition. Sets of profiles were
recorded for various combinations of laser polarisation and analyser orientation (in the polarisation spectroscopy
experiments).
Simple theoretical descriptions of Doppler broadening and optical pumping in the profiles were given. However, a more sophisticated treatment based on a solution of the Liouville equation using an irreducible tensor basis in Liouville space was also necessary. Doppler broadening was treated using a Fourier transform technique. The signal was derived from the density matrix using an operator formalism
for the analyser.
Chapter 1. Introduction 1
1.1 Summary of this work 2
1.2 Review of previous work 4
1.3 Structure of this thesis 10
Chapter 2. The experiment 12
2.1 Description of the experiment 13
2.2 Important features of the experiment 16
Figures related to Chapter 2 23
Chapter 3. Experimental results 25
3.1 Saturated absorption 26
3.2 Polarisation spectroscopy: linearly polarised
pump 42
3.3 Polarisation spectroscopy: circularly
polarised pump 47
3.4 Increased pump intensity 48
Tables related to Chapter 3 53
Figures related to Chapter 3 57
Chapter 4. Theoretical treatment 68
4.1 Solution of the Liouville equation 69
4.2 Application to the extended system 83
4.3 Doppler broadening 89
4.4 Calculation of the signal 91
5.1 Important features of the theory 96
5.2 Saturated absorption 108
5.3 Polarisation spectroscopy: linearly polarised
pump 111
5.4 Polarisation spectroscopy: circularly
polarised pump 113
5.5 Possible reasons for discrepancies 113
Figures related to Chapter 5 121
Chapter 6. Conclusion 125
6.1 Summary of the work 125
6.2 Conclusions drawn 128
Appendix A. Experimental Details 131
Figures related to Appendix A 136
Appendix B. The Interaction Operator and the Dipole
Vector 137
B.l Matrix elements of the interaction operator 137
B. 2 The electric dipole vector 141
Appendix C. Computer Programme 144
C . l Doppler free calculation 144
C.2 Doppler broadened calculation 147
Chapter 2. The Experiment
2.1 Schematic diagram of the experiment 23
2.2 Signals recorded in a typical scan 24
Chapter 3. Experimental Results
3.1 Co-propagating saturated absorption profiles 57 3.2 Simplified diagram of the Na transition 58 3.3 Origin of features: co-propagating case 59 3.4 Origin of features: counter-propagating case 60 3.5 Comparison of types of saturated absorption 61 3.6 Zeeman optical pumping in the Cad resonance 62 3.7 Dependence of co-propagating saturated
absorption profiles on pump polarisation 63 3.8 Co-propagating polarisation spectroscopy:
linearly polarised pump 64
3.9 Variation of polarisation spectroscopy
profiles with analyser orientation 65
3.10 Co-propagating polarisation spectroscopy:
circularly polarised pump 66
3.11 Dependence of saturated absorption profiles
on pump power 67
Chapter 4. Theoretical treatment
4.1 States involved in the D^ transition of
sodium 94
4.2 Diagrammatic representation of the power
5.1 Comparison of theory and experiment for
saturated absorption profiles 121
5.2 Detail of Figure 5.1 122
5.3 Comparison of theory and experiment for
polarisation spectroscopy: linearly polarised
pump 123
5.4 Comparison of theory and experiment for
polarisation spectroscopy: linearly polarised
pump 124
Appendix A. Experimental Details
Chapter 3. Experimental Results
Table 3.1 53
Table 3.2 53
Table 3.3 54
Table 3.4 55
Chapter 1. Introduction
The interaction of a near-resonant light field with an atomic system has been extensively studied both
experimentally and theoretically. More recently, the availability of intense, narrow band dye lasers has
stimulated interest in the non-linear interaction between light and atoms. Examples of such non-linear interaction include the A.C. Stark effect, power broadening and saturated absorption spectroscopy. The fundamental processes that
cause these and other effects are now well understood.
Verification of this understanding has come from comparison of theoretical calculations with corresponding experimental results.
In order to compare theoretical predictions with experimental results in detail, most workers have been
obliged to take special steps in the experiment to allow the theory to be simplified. Theoretical treatments have
typically been restricted to the simplest atomic systems such as a two- or three-state stationary atom. These systems
allow the most important physical processes to be clearly described. Some examples of the steps taken in earlier
experimental investigations include preparation of the atoms in an atomic beam to limit atomic motion effects, hyperfine optical pumping of sodium before the interaction to produce a two state atom, and mixing of the hyperfine levels of sodium
Now that the basic processes involved in the non-linear interaction have been understood as a result of pioneering investigations, it is worth considering whether the same degree of understanding can be achieved for the more common experiment which does not employ such careful precautions. Is it possible, for example, accurately to model a multi level atom in a Doppler broadened sample interacting with a strong pump field? The work described in this thesis is an attempt to produce a theoretical treatment of an experiment in a more complicated atomic system. The theoretical model and the experiment are presented and the results compared.
1.1 Summary of this work
Saturated absorption and polarisation spectroscopy
experiments in a vapour of sodium were chosen as examples of a typical experimental system. These techniques are
Three modifications to the usual saturated absorption or polarisation spectroscopy experiments were made. Firstly, the intensity of the pump beam was not kept to a minimum. This ensured that non-linear interaction with the pump field was important. Secondly, different lasers were used for the pump and probe beams, so the frequency of the pump beam could be kept fixed during a probe laser frequency scan. This
allowed a more thorough examination of the detuning
dependence of the interaction. Finally, a co-propagating geometry was used since it is necessary for observation of the Autler-Townes effect in this sort of Doppler broadened system.
Before proceeding to the sophisticated theoretical calculations, the experimental results were examined using
simple theories for the Doppler effect and optical pumping. Although restricted in accuracy, the optical pumping model
allows a clear understanding of the general features of the profiles. The treatment of the Doppler effect uses a
straight forward graphical technique to identify the origins of features in the Doppler broadened profiles.
A theoretical model that described the system as well as possible was also developed. The standard description using the density matrix was extended to include the multiple
levels (and degenerate Zeeman sub-levels) of the sodium
Because of the extended atomic system used, it was necessary to use a computer to calculate the results. Doppler
broadening was included using a Fourier transform technique to perform the necessary convolution integrals numerically.
The validity of the model can be judged from the degree of agreement between theoretical and experimental profiles for various combinations of polarisations and pump
intensities.
1.2 Review of previous work
There is a substantial volume of previous work on the interaction of a strong laser field with an atomic system. In summarising this literature, it is useful to separate the contributions into those that consider the dynamic Stark
effect and those that treat saturation effects with regard to the operation of gas lasers and high resolution spectroscopy. The latter category is more relevant to the experiments
performed here, but the A.C. Stark effect can also be important. Although the two categories are related, they will be summarised separately, while other aspects of non linear interaction, such as four wave mixing and bistability, will not be included because they are not related to the
present work. At the end of this section, earlier work treating extended atomic level systems will be summarised.
there has been interest in the spectrum of resonance
fluorescence from a strongly driven system, as well as the direct optical analogue of the Autler-Townes experiment.
A number of theoretical calculations predicted a three-peaked spectrum in resonance fluorescence from a strongly driven two level atom (Newstein 1968, Mollow 1969, 1970 and 1972a, Stroud 1971, Hassan and Bullough 1975, Smithers and Freedhoff 1975, Carmichael and Walls 1976, Kimble and Mandel
1976, Cohen-Tannoudji 1975, Cohen-Tannoudji and Reynaud 1977a). If the driving laser is exactly on resonance, the separation of the two sidebands from the central peak at the laser frequency is equal to the Rabi frequency.
The Rabi frequency, ß, is given, in angular frequency units, by
ß = (y..E) /-ft
where the amplitude of the incident electric field is E and \i
is the electric dipole moment of the transition. The Rabi frequency therefore characterises the strength of the
interaction through the strengths of both the field and the transition.
Early experimental work on the dynamic Stark effect in sodium confirmed the three-peak structure of the spectrum
possible due to experimental limitations such as the presence of other hyperfine levels and the non-uniformity of the laser beams. Hartig et al (1976) and Grove et al (1977) obtained better agreement by using circularly polarised light and by optically pumping the population into a single Zeeman sub-level before the interaction region.
An alternative way of observing the influence of a strong laser on an atom is to use a second, weak laser to probe the interaction. Measurements can be made of the total
fluorescence intensity or the absorption of the probe laser as it is scanned through resonance with a third level. The two-laser, three-level system was treated theoretically by Mollow 1972a, Feneuille and Schweighofer 1975, and Whitley and Stroud 1976. For the case of the strong beam on
resonance, a symmetric doublet with spacing equal to the Rabi frequency (the Autler-Townes doublet) is expected.
experiment.
Alternatively, the absorption of the probe in the
vicinity of the strongly driven transition may be measured. The absorption spectrum of such a two-laser, two-level system was predicted to have features symmetrically placed about the frequency of the driving field (Mollow 1972b, Cohen-Tannoudji and Reynaud 1977a, Agarwal 1979). At certain frequencies the probe laser is amplified by transfer of energy from the pump beam. Using a sodium atomic beam prepared as a two-level system by optical pumping, Wu et al (1977) were able to demonstrate good agreement with this theory.
Work included in the second category started with the invention of the gas laser. There was substantial interest in the interaction of strong light waves with Doppler
broadened media, with application to the operation of lasers (e.g. Dienes 1968a, 1968b, Stenholm and Lamb 1969, Feldman and Feld 1970, Hansch and Toschek 1970). Similar theoretical techniques were later applied to saturated absorption and polarisation spectroscopy (Schlossberg and Javan 1966, Feld and Javan 1969, Baklanov and Chebotaev 1971, 1972, Holt 1972, Skribanowitz et al 1972, Haroche and Hartmann 1972, Shirley 1973, Borde et al 1976, Sargent et al 1976a, 1976b,
Although there have been many publications on the use of saturated absorption and polarisation spectroscopy as
techniques in high resolution spectroscopy, investigations of the fundamental processes are of more interest here. Sargent (1976) considered the influence of the polarisations of pump and probe beams on saturated absorption profiles and early papers on polarisation spectroscopy (Wieman and Hansch 1976, Delsart and Keller 1977, 1978b, Keller and Delsart 1977, Stert and Fischer 1978) gave basic treatments of the process in terms of the induced refractive indices and absorption coefficients for different polarisation components of the probe beam.
Early treatments generally considered only the
saturation of the two levels involved in the transition. However it was later realised that Zeeman coherences (Colomb and Dumont 1977, Rinneberg et al 1980) and redistribution of population between lower levels (Anderson et al 1978) were
important in saturated absorption. The importance of optical pumping in saturated absorption and polarisation spectroscopy was emphasised by the introduction of velocity selective
optical pumping (Pinard et al 1979, Aminoff et al 1983, Nakayama 1984a) which gave sub-Doppler resolution with pump laser powers well below saturation levels.
Series and co-workers (Gawlik and Series 1979, Nakayama et al 1980, Nakayama 1981a, 1981b, 1984b, 1985) pointed out the importance of optical pumping in polarisation
achieve good agreement between polarisation spectroscopy profiles of the line of sodium and a theory based on a
single cycle of optical pumping. Similar conclusions were drawn by Murnick et al (1979) and Pappas et al (1980)
regarding saturated absorption in barium.
Optical pumping is possible in atomic systems that are more complicated than the simple two- or three-state system usually considered. There have been a number of treatments of the strong interaction of light with atoms that have
included all relevant states (Zeeman sub-levels or hyperfine structure) in the calculation. These treatments are of more direct relevance to the work presented in this thesis.
Cohen-Tannoudji and Reynaud (1977b) and Cooper et al (1980) considered the spectrum of resonance fluorescence from a strongly driven atom.
Delsart and Keller (1980) considered the optical Autler-Townes effect in a three-level ladder system with Zeeman
degeneracy and obtained reasonable agreement between an
quantum numbers of the levels.
The work described in this thesis follows on from an investigation of the dynamic Stark effect in a three-level system in barium carried out earlier (Fisk 1985, Fisk et al 1986a, 1986b, 1986c). The barium level system used was simpler than that of sodium and although the same basic theoretical technique was employed in this work, it was extended to account for the four levels that make up the hyperfine structure of the transition and for the Zeeman structure of each. In addition, since the experiments were performed in a vapour cell, the Doppler effect was included in the model.
1.3 Structure of this thesis
The experimental side of the investigation is presented in Chapters 2 and 3. Chapter 2 describes the experimental apparatus, referring to Appendix A for some details. This chapter also describes some features of the experiment that were relevant to the comparison with theory. The
experimental results are presented and discussed in terms of the Doppler broadening and optical pumping theories in
Chapter 3.
The theoretical side is presented in Chapters 4 and 5. Chapter 4 describes the solution of the Liouville equation and its application to the atomic system used in the
Chapter 2. The Experiment
Polarisation spectroscopy and saturated absorption were chosen for the experimental investigation of the non-linear interaction between laser fields and atoms in this work. In these standard techniques, a Doppler-broadened medium is pumped with a saturating beam, and the effect on the
intensity (saturated absorption) or polarisation
(polarisation spectroscopy) of a weak, counter-propagating probe beam of the same frequency is measured. By modulating the intensity of the pump laser and detecting the signal with a lock-in amplifier, sub-Doppler resolution may be achieved.
However, as mentioned in Chapter 1, there were some significant differences from standard polarisation or
saturated absorption spectroscopy experiments. Firstly, the pump beam intensity was not restricted to avoid power
broadening. Secondly, the pump and probe beams were produced by different lasers and the pump beam frequency was fixed during scans of the probe frequency. Thus, although both lasers were tuned in the vicinity of the same transition, the two frequencies were not necessarily equal as they are in the standard techniques. In addition, the two laser beams were arranged in a co-propagating geometry.
This chapter describes the experimental work. It begins with a description of the experimental apparatus and the
signals recorded. Section 2.2 indicates some important
relevant to a meaningful comparison of the results with theory.
2.1 Description of the experiment
In order to compare theory and experiment in detail it is necessary to design an experiment where the environment for the atoms is well known and controlled, with no
interaction processes that are external to the model. Similarly, the states of the radiation fields interacting with the atoms must be well known and controlled and the detection process must be linear. These principles were applied as much as possible in the design of the experiment.
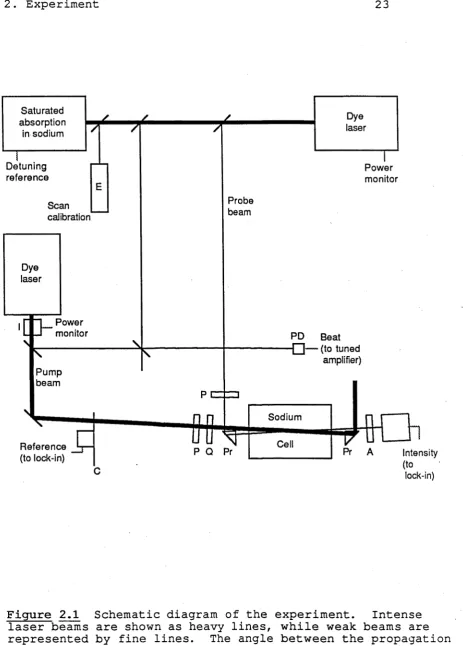
Figure 2.1 is a schematic diagram of the experimental apparatus used in this work. It consisted essentially of a sodium vapour cell, the two laser beams with polarising and focussing optics, and a photomultiplier for intensity
measurement.
_
g
The low density sodium vapour (approximately 10 Torr) was contained in a heated vacuum cell, without buffer gas and
_
g
with a background pressure of 10 Torr. Appendix A
describes the cell in greater detail. A set of Helmholtz coils was used to reduce stray magnetic fields in the cell to less than 10 mG.
controlled polarisation states. The pump powers used in the experiments ranged from 0.07 mW to 66 mW.
The b e a m s were focussed into the cell, and c r o s s e d in the centre. Focal lengths and positions of the focussing lenses were chosen to make the pump beam waist larger than that of the probe. Both waist sizes w e r e m e a s u r e d u s i n g a method based on the technique outlined by Khosrofian and
Garetz (1983). The measured waist diameters were:- pump beam 860 |im and probe beam 220 |im. These values correspond to the points where the intensity is 1/e of the central intensity. The corresponding values of the w^ p arameter defined by Kogelnik and Li (1966) are 610 Jim and 150 Jim respectively. For this pump beam size, the Rabi frequencies (averaged over the Gaussian beam profile) used in the experiment ranged from
10 MHz to 300 MHz.
For comparisons with the theoretical calculations to be valid, the pro b e field must be weak e n o u g h for the
interaction with the atoms to be linear in the probe
intensity. This was checked experimentally by observing the variation of saturated absorption profiles with probe
intensity. For each of a series of decreasing pump powers, the probe intensity was reduced until the linewidth of the profile remained constant. The reduction in both laser
This compares favourably with the natural width of 10 MHz, with the difference assumed to be due to residual power broadening by the pump laser. Hence it can be assumed that the probe was weak enough to allow the atomic
interaction with the probe field to be linear. This means that the probe Rabi frequency was less than the spontaneous emission rate of the upper level.
The beams were either linearly polarised (using high extinction ratio crystal polarisers) or circularly polarised
(using quarter-wave plates after the polarisers) before entering the cell. After interacting with the strongly
pumped vapour, the probe beam was passed through an analyser (another high extinction ratio polariser) and then to a
photomultiplier to measure the transmitted intensity. The analyser was not used in the saturated absorption
experiments.
various combinations of pump and probe polarisation and analyser orientation.
An auxiliary saturated absorption experiment was used to measure the probe frequency to within 10 MHz during the
scans. By mixing the two lasers on a high speed photodiode and generating a beat signal, the pump frequency could also be measured for each scan. Frequency calibration of the laser scans was provided by recording the transmission of a 300 MHz confocal etalon. The intensities of the two laser beams were also recorded during the scans. Appendix A gives more detail on the generation of these signals.
The intensity of the transmitted probe beam was recorded by a computer, along with the signals needed to measure the
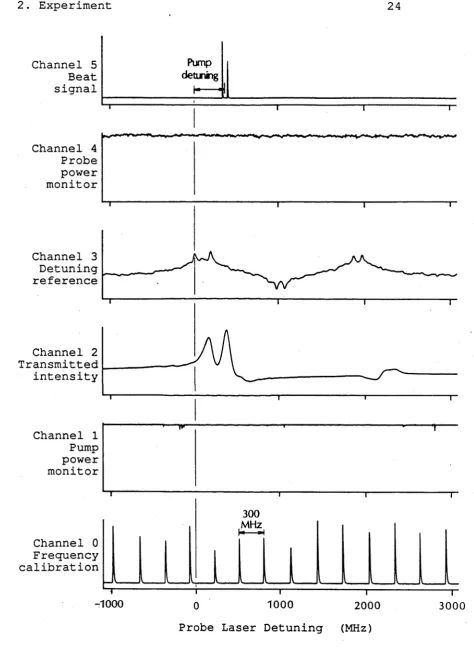
laser frequencies and intensities. The recorded information was later transmitted to a mainframe computer for comparison with calculated profiles. Figure 2.2 shows the signals
recorded during a typical probe laser frequency scan. It also indicates how the beat signal and auxiliary saturated absorption experiment were used to measure the laser
frequencies.
2.2 Important features of the experiment
The design considerations mentioned earlier were
followed as closely as possible, and the resulting experiment achieved most of these goals. However, there were some
The sodium cell was a satisfactory atomic source for this experiment because it met the requirements for a well controlled environment for the atoms. Because the windows w e r e heated, it was not n e c e s s a r y to i n t r o d u c e a b u f f e r gas into the cell to prevent sodium from condensing on the
windows. The mean free path between Na-Na collisions was calculated to be much greater than 10 metres, which was much larger than the dimensions of the cell. It is therefore reasonable to assume that the contribution from collisional processes to the homogeneous linewidth was negligible.
The Helmholtz coils also played an important part in ensuring that the environment of the atoms was well known and controlled. Stray fields of the order of 10 mG are small enough to ensure that Zeeman splitting is negligible. However, Zeeman splitting is not the only possible
perturbation caused by magnetic fields. Rinneberg et. al. (1979) observed changes in the amplitude of one of the crossover resonances in standard saturated absorption
profiles with magnetic fields below 100 mG. The calculated results shown in this paper suggest that at fields of 10 mG or less, there is little disturbance of the amplitude. This was confirmed by saturated absorption experiments carried out with varying magnetic fields in this range.
Both the probe and pump laser polarisers and the
polariser and the analyser could mask the signal in a polarisation spectroscopy experiment. Similarly, a
perturbation to the pump beam polarisation would disrupt the control over the driving fields in the interaction. Stress-induced birefringence in the windows of the main vacuum cell could have caused these undesirable effects. By enclosing the polarisers, the analyser and the main cell windows in a vacuum, atmospheric stress was eliminated from the main cell windows.
In order to reduce the angle between the propagation directions of the two beams, a small right-angle prism was used to reflect one beam from a side entry port (holding the initial polariser) onto the axis of the cell (see
Figure 2.1). Total internal reflection was used for this purpose because the amplitude reflection coefficients for the
field components perpendicular and parallel to the plane of incidence are equal (see, for example, Hecht and Zajac 1974, Chap 4.3).
The intensity of the reflected light is therefore independent of polarisation. The phase change upon total internal reflection is, however, different for the two polarisation components and the prism therefore acts as a wave-plate, with retardation dependent on the angle of
Since a retarder between the polariser and analyser would reduce the extinction ratio by creating a circularly
polarised component, this was done simply by optimising the extinction ratio with respect to rotation of the initial polariser.
Obviously it was only possible to treat linearly polarised light in this manner, so the propagation
arrangement of the beams had to be chosen accordingly. Since the probe beam was always linearly polarised, it was sent through the prism; while the pump, which was circularly polarised for some experiments, was sent straight into the cell. After interacting with the pumped atoms, the probe beam was potentially no longer linearly polarised, so it could not be sent through the second prism to the analyser. However, the polarisation of the pump beam was of no concern after the interaction, so it was reflected away from the photomultiplier by the second prism. This combination
ensured that both pump and probe beam initial polarisations were well known, and that the probe polarisation was only affected by the pumped atoms.
An ideal experiment of this nature would use exactly co-or counter-propagating beams, with no angular displacement between the beams. Such an arrangement maximises the signal
However, if the pump and probe beam wavelengths are equal and the two beams are not necessarily in orthogonal polarisation states, they may only be separated before the photomultiplier using a spatial separation. This
necessitates an angular separation between the beams, the size of which was determined (in this experiment) by the distance between the interaction region at the centre of the cell and the prisms. The angle between the two beam
directions was approximately 1.5°.
In some earlier experiments, it was necessary to increase this angle in an attempt to prevent partial
reflections of the pump beam from the main cell windows from creating additional (reduced intensity) pump beams of the opposite propagation direction. In later experiments, the window mounts were altered to deflect these spurious beams away from the interaction region.
Because the pump and probe beams are not exactly
parallel, Doppler broadening of the signals is not completely eliminated. The residual Doppler broadening is calculated
As described above, the linearity of the probe interaction was verified by observing the linewidths of saturated absorption profiles. Residual Doppler broadening could have masked probe power broadening since it was larger than the natural width and independent of probe intensity. This would have erroneously indicated a linear interaction with the probe field. To avoid this possibility, the probe linearity checks were made without using the secondary vacuum chamber, allowing the angular separation to be reduced.
Because the pump beam could be many times more intense than the probe, a small proportion of the pump intensity scattered into the photomultiplier was enough to mask the signal. Because the pump beam was chopped, the phase sensitive detector was very sensitive to scattered pump
light. For this reason a spatial filter, aligned for maximum transmission of the probe beam, was set up in front of the photomultiplier. However, pump scattering still caused a deterioration of the signal to noise ratio at higher pump laser intensities.
The ideal arrangement of uniform pump intensity over the interaction region could have been achieved if the probe beam had been focussed to a substantially smaller waist than the pump and the two beams had been exactly parallel and
However, despite a tighter probe focus, this was not possible because of the angle between the beam directions. Consideration of the geometry of the cell and polariser
chamber, and the sizes of the two beam waists indicates that, in the interaction region, the probe beam propagated through approximately 80% of the possible range of pump intensity. If the cell had been shorter, this range would have been reduced because some of the overlap volume between the two beams would have been outside the vapour. This large range may cause discrepancies between theory and experiment since the experimental profiles represent an average over the range of pump laser intensities while the theoretical calculations are restricted to a single intensity.
To finish this chapter, some important experimental parameters are collected together.
Sodium number density 5 x 1 0 ^ m
Cell length 10 cm
Transition
D 1 (589.
Natural width 10 MHz
Doppler width 1600 MHz
Residual Doppler width 25 MHz
Pump beam diameter 860 Jim
Figure 2.1 Schematic diagram of the experiment. Intense laser beams are shown as heavy lines, while weak beams are represented by fine lines. The angle between the propagation directions of the beams has been exaggerated for clarity. The analyser was used in polarisation spectroscopy
[image:33.558.65.529.50.697.2]Channel 5 Beat signal
Pump detuning
h
-Probe Laser Detuning (MHz)
Figure 2.2 The signals recorded in a typical scan. The use of the secondary saturated absorption experiment (Channel 3) to fix the probe laser detuning origin and the beat signal
[image:34.558.56.531.45.706.2]Chapter 3. Experimental Results
The results of the experiments described in the previous chapter are presented in this chapter. It is possible to gain a general understanding of the results without using the sophisticated theoretical treatment presented in Chapter 4. In addition to presenting the experimental results, this
chapter includes discussions of the processes which determine the form of the profiles. An understanding of the mechanism of Doppler broadening can explain the combinations of pump and probe detunings that produce resonances. Similarly, the amplitudes and polarities of the features can be explained in terms of hyperfine and Zeeman optical pumping.
The possible experimental configurations may be divided into three categories. Section 3.1 presents experimental results obtained in the first category: saturated absorption. The formation of the profiles from the possible Doppler free resonances is also discussed in detail in this section,
although it applies equally to all three categories of
experiment. Sections 3.2 and 3.3 present results in the two polarisation spectroscopy categories: linearly polarised and
circularly polarised pump beams respectively. A simple
3.1 Saturated absorption
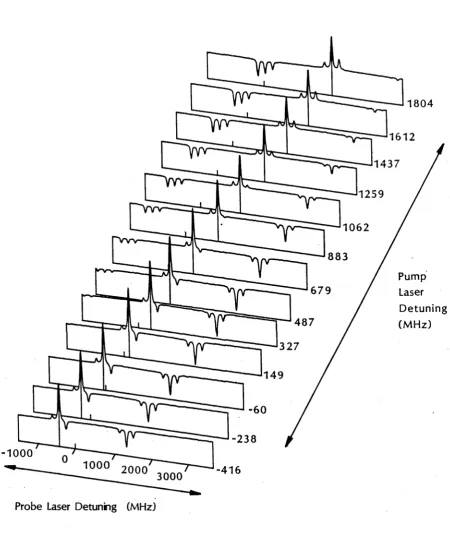
The results of a set of probe f r e q u e n c y scans are shown in Figure 3.1. The pump and probe lasers were linearly
polarised in the same direction and were co-propagating. The intensity of the probe laser after transmission through the vapour was measured without using an analyser. These
profiles are therefore standard saturated absorption profiles with the modifications mentioned in Chapter 1. The complete set of profiles has been combined into one three-dimensional plot to indicate clearly the variation of the profiles with pump laser detuning. The pump laser was weak enough to allow the individual features of the profiles to be resolved. At higher intensities many of the peaks could not be resolved due to power broadening.
The laser detunings indicated in Figure 3.1 (and used in the rest of this thesis) are relative to the lowest frequency hyperfine transition in the line, as shown in Fig. 3.2. Figure 3.2 also shows the hyperfine levels involved and indicates the labelling system used in the discussion. The detunings are given by
5n = % ' v ca “ vn ' v (3p 2pi/2 F=1 ^ 3s 2s i/2 F=2)
position where pump and probe laser detunings are equal.
The first point to establish in discussing these
profiles is the origin of the various features. In a Doppler free atomic system a feature would be expected whenever the lasers were both resonant with a transition. Detunings of 0 MHz, 189 MHz, 1772 MHz or 1961 MHz for either laser would be expected to produce a feature corresponding to resonance with the ac, ad, be and bd transitions respectively. There would be 16 peaks within the range of detunings of
Figure 3.1. Clearly, there are many more peaks and they are not restricted to these values of laser detuning.
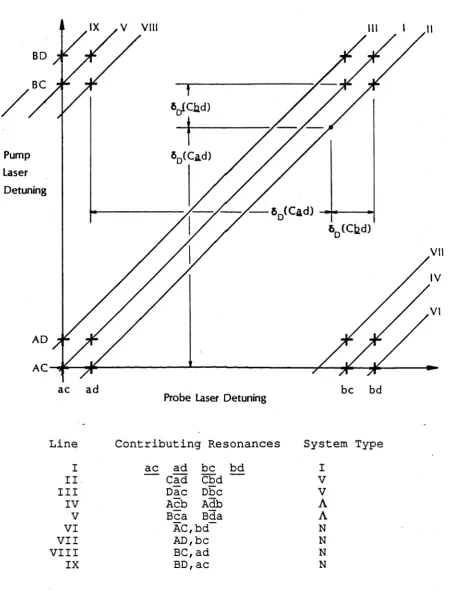
The configuration of features in Fig. 3.1 is due to the Doppler effect. To determine the origin of each peak,
consider the apparent frequencies of the lasers in the rest frame of the atoms of a particular velocity sub-group. The Doppler shifted detunings of the two lasers are
52 = 52 - 5d = 5 f (3.1)
e = 1 co-propagating fields
-1 counter-propagating fields
For a resonance to occur, the two Doppler shifted frequencies must both coincide with a transition. This is expressed by the second equality in each of Eqs. 3.1 where 8^ and 8f are detunings corresponding to a resonance. The possible values of 8 . and 8^ are 0 MHz, 189 MHz, 1772 M H z a n d 1961 MHz as
i f
listed above. Eliminating the Doppler shift from Eqs. 3.1 gives the condition on the laboratory frame detunings, 8^ and
82^ of the two fields for the production of a feature in the Doppler broadened profile
5 2 “ e^l = 8f - (3.2)
since 1/e = e.
When plotted in the 8^,82 plane this equation represents a set of straight lines inclined at ±45° to the 8^ and 82
axes. Points on these lines are combinations of 8^ and 82
for which there exists at least one velocity sub-group with both pump and probe lasers Doppler shifted into resonance with a transition. There are nine different values of
8f - e8i so there are nine lines in the set. These lines are plotted in Figure 3.3 for the co-propagating case
Although the three dimensional plotting distorts the orientation of the axes and makes it difficult to see the 45° lines in the data, Fig 3.1 shows the same positioning of
peaks along nine different 45° lines. Since the line from the baseline of each profile to the curve is drawn at the position of equal pump and probe detuning, these lines must all fall on line I of Fig. 3.3. Therefore, the largest peak in each profile of Fig. 3.1 lies on one of the expected 45° lines. Since the separations of individual peaks are
maintained as the pump detuning is changed, all other peaks lie along 45° lines as described above.
Some further information about the formation of the peaks can be obtained by considering the particular
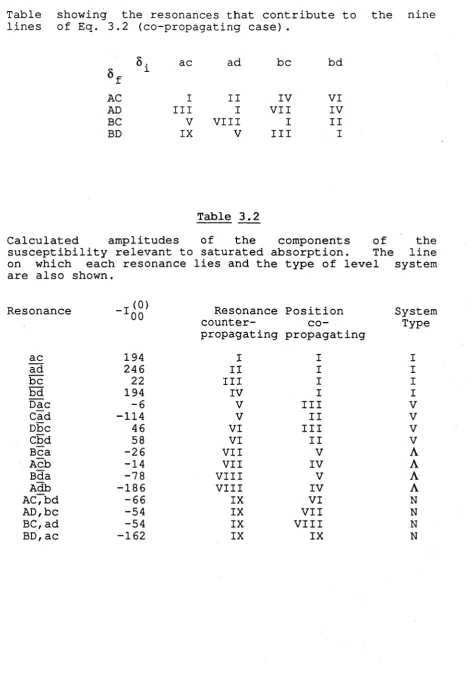
combinations of 8^ and 8^ that generate each of the nine possible lines. Table 3.1 shows the combinations of
resonances that produce the lines as labelled in Fig. 3.3. In this table, resonances for the probe laser (values of 8^) are indicated in lower case letters while upper case letters are used for the pump laser. This convention will be
followed in the rest of this thesis.
The table can be used to identify the resonances which contribute to any peak on the 45° lines in Fig. 3.3. For example, any peak on line I is due to the four velocity sub groups for which the pump and probe lasers are
velocity sub-groups: one for which the pump laser is resonant with the AD transition and the probe is resonant with ac, and the other with the pump tuned to BD and the probe to be.
From Table 3.1 and Fig. 3.2 it can be seen that the various 45° lines are made up of "I systems" (line I),
"V systems" (lines II and III), "A systems" (lines IV and V) and "N systems" (lines VI, VII, VIII and IX). "I systems" are those for which the pump and probe lasers are resonant with the same transition. This sort of system produces the "principal resonances" of standard saturated absorption and polarisation spectroscopy.
The pump and probe lasers share a common lower state in "V systems" and a common upper state in "A systems". An "N system" resonance is one with no common state. For an "N system" resonance, the influence of the pump laser on the probe (necessary for generating a signal in saturated
absorption or polarisation spectroscopy) is due to spontaneous emission from the upper state of the pump transition to the lower state of the probe. Peaks due to "V system", "A system" and "N system" resonances are known as crossover resonances.
When describing a combined pump and probe laser
is a "A system" resonance with the pump laser resonating with ac and the probe with be. This notation system has the
advantage of emphasising the type of resonance by indicating the number of levels involved in the transition by the number of characters in the designation. Using this notation, the contributing resonances for each line are shown in Fig. 3.3.
The signal at any given combination of pump and probe detuning is due to the sum of the contributions from all velocity sub-groups that generate a resonance. However, the terms in the sum are weighted by the relative numbers of atoms in the velocity sub-groups. This number is derived from the usual Maxwellian velocity distribution, although it is more convenient in this context to express it in terms of the Doppler shift, SD
The width of the Doppler profile in the experimental results (Fig. 3.1) was 1.6 GHz which is comparable to the ground state hyperfine splitting of 1.772 GHz. Eq. 3.3 shows that the Cbd resonance is therefore weighted substantially more strongly than the Cad resonance. It thus makes a greater contribution to the signal recorded at the example p o i n t .
Because the ground state hyperfine splitting is comparable to the Doppler width, it is possible to distinguish different lower levels in the experimental
profiles. This is demonstrated most obviously in Fig. 3.1 by peaks along line II. At low pump detunings they are produced predominantly by the Cad resonance and are negative going. However, at high pump detunings, the Cbd resonance is more
important and the signal is positive. The ability to separate different lower levels will help in determining mechanisms responsible for various features in the profiles.
The upper level hyperfine splitting (189 MHz) is substantially smaller than the Doppler width. This means that it is not possible to distinguish between contributions from different upper level resonances. A similarly placed example point on line I, for example, would experience
approximately equal contributions from be and bd resonances.
producing the signal are increasing so the Doppler weight factor is decreasing. Similar arguments explain the
reduction in signal with decreasing pump detuning along
lines V, VIII and IX. The same reductions would occur along lines I, II and III but at pump detunings beyond the range shown in Fig. 3.1.
It is worthwhile carrying out a similar analysis for standard saturated absorption experiments where the pump and probe frequencies are equal and the two beams are counter-propagating. Figure 3.4 shows the combinations of pump and probe frequencies which produce resonances for the counter-propagating case, e = -1. Because the two laser frequencies are equal, a standard saturated absorption profile is
represented by a scan along a line at +45° to the axes and passing through the origin. Features are expected whenever this line intersects one of the -45° lines in Fig. 3.4.
It can be seen from the identification of the sources of the various lines in Fig. 3.4 that, in contrast to the co propagating case, the four possible "I system" resonances appear as separate features. This geometry is therefore more directly suited to high resolution spectroscopy where the separations of levels are of interest, although the same
Figure 3.5 shows a standard saturated absorption profile from the same experimental apparatus and three of the
profiles from Fig. 3.1. The standard saturated absorption profile was taken during the initial set-up of the sodium cell before the Helmholtz coils were installed. For
comparison, pump detunings of -60 MHz, 883 MHz and 1804 MHz were chosen from Fig. 3.1.
The most obvious difference between the two types of profile is the apparent scaling of the probe detuning axis.
This is because a probe frequency scan is represented by a horizontal line in Fig. 3.3 (for a fixed pump detuning) and by a line at +45° in Fig. 3.4 (if the two laser detunings are equal). The probe detuning scan range required to intercept all three triplets of lines in the fixed pump detuning case is twice that required in the standard saturated absorption case, resulting in the larger separation of features.
The second major difference is in the sizes of the
peaks. This is largely due to the different combinations of resonances in the two geometries that produce each peak. Using Figs. 3.3 and 3.4 to identify the origins it can be seen that the two types of profiles are consistent. For example, the negative going peak in the centre of the standard saturated absorption profile is due to all
the two types of experiment can be weighted differently by the Doppler effect. This causes further differences in the amplitudes of some peaks.
Having identified the resonances that contribute to the features in the profiles, it is worthwhile to attempt to identify the processes that determine the amplitudes of the p e a k s .
The signal measured in this experiment was the intensity of the probe laser transmitted by the p u m p e d atomic medium. However, the pump laser was chopped and the transmitted intensity measured with a phase sensitive detector. This means that the signal was proportional to the difference between the transmitted intensity with and without the pump
laser. This is the reason for the absence from the profiles of any Doppler broadened absorption of the probe beam. It is also the reason for the generation of negative going peaks in some profiles.
First, consider the "I system" resonances. When the pump laser is present the lower state population is reduced by saturation and hyperfine optical pumping. The vapour therefore exhibits higher transmission in this half of the cycle and the signal is positive. In contrast, all peaks due to "A system" or "N system" resonances (lines IV, V, VI, VII, VIII and IX) in Fig. 3.3 are negative going. This is because the population of the lower state of the probe transition in each case is increased by hyperfine optical pumping when the pump laser is present. This causes a reduction in the
transmitted intensity during this half of the chopper cycle and therefore negative peaks.
Zeeman optical pumping becomes more important in the "V system" resonances of lines II and III. Consider first the Dac and Dbc resonances that contribute to line III. In both cases, all Zeeman sub-level populations of the probe transition are depleted by the pump laser, causing a positive going signal. The same argument applies to the Cbd
transition that is the major contributor to line II at large pump detunings. For these resonances, the same conclusion would be drawn if Zeeman degeneracy were ignored.
However the Cad resonance behaves differently.
Figure 3.6 shows that optical pumping by the K polarised pump beam increases the populations of the m = ±2 Zeeman
sub-a
levels as well as of level b. The k polarised probe beam
causes transitions from all five Zeeman sub-levels, some of which (m = ±2) experience increased absorption and some
(m = 0,±1) reduced. The magnitude and sign of the resultant a
peak arise from a balance between the degree of Zeeman optical pumping and the strengths of the individual Zeeman transitions.
The role of optical pumping in these profiles can be examined more closely with the aid of a theory developed by Nakayama (1981b, 1985). For all possible Zeeman transitions of the probe laser, modifications to the ground state
populations due to one cycle of optical pumping by the pump laser are calculated. The amplitude of each resonance is the sum of contributions from the constituent Zeeman transitions.
The amplitude is calculated from the susceptibility, (co), of the medium experienced by each polarisation component, p, of the probe beam in the presence of a pump beam of polarisation, q. The polarisation components
indicate K polarisation by p = 0, G+ polarisation by p = ± and G + or G_ polarisation by p = + or p = - respectively.
propagating in the same direction is a mixture of a + and G_ c o m p onents.
The expression for the susceptibility is (Eq. 1 Nakayama 1985)
(q) (c?) -i
X<G» “ Z r f ^ p p D(CO.,(D. ,AD ) (M-CO^-iy) (3.4)
i, j
where the pump and probe beams are Doppler shifted into resonance with transitions at frequencies CO^ and co^
respectively. D (co^, co^, is the Doppler weight factor for the velocity subgroup and (Cö^+Cüj)/2. The summation in Eq. 3.4 is taken over all Zeeman sub-levels that can interact with the two lasers. The amplitude, I
PP ' is calculated in terms of the transition probabilities of the individual
Zeeman transitions of the pump and probe lasers. It includes the effect of spontaneous emission bet w e e n levels involved in the pump and probe transitions and therefore accounts for optical pumping b etween Zeeman sub-levels.
Nakayama does not include the negative sign in the
expression for the susceptibility (Nakayama 1985). However, comparison of the expression for the amplitude factor (Eq. 2 Nakayama 1985) with Eq. 23 in his earlier paper where it was
B e c a u s e of the different c o m b i n a t i o n s of reson a n c e s that m a k e u p e a c h peak, it w a s not p o s s i b l e to u s e t h e v a l u e s in Table 1 of Nakayama's 1985 paper for the current experiment. That tab l e refers only to the s t a n d a r d s a t u r a t e d absorption g e o m e t r y and the calculations w e r e t h e r e f o r e r e p e a t e d to
include the co-pr o p a g a t i n g experiment.
The signal in a saturated a b s o r p t i o n e x p e r i m e n t w i t h p a r a l l e l linear polarisations is g i v e n by (Nakayama 1985)
since b o t h b e a m s have only K p o l a r i s a t i o n components. Table 3.2 s h o w s the calculated c o n t r i b u t i o n f r o m each r e s o nance and indicates the lines of Figs. 3.3 and 3.4 on w h i c h e a c h res o n a n c e is located. U s i n g the D o p p l e r shift for each resonance, the amplitude of e a c h p e a k can be calculated. These c a l c u l a t e d a m p l i t u d e s have b e e n m a r k e d on all the peaks in Fig. 3.5.
It c a n b e s e e n t h a t t h i s s i m p l e t h e o r y p r e d i c t s t h e general form of the profiles. The signs of all peaks are c o r r e c t l y p r e d i c t e d and the a m p l i t u d e s are a p p r o x i m a t e l y
correct. The d i s c r epancies in Fig. 3.5 are p r e s u m a b l y due to the in t e n s i t y of the p u m p laser. If the p u m p field is strong enough, the a s s u m p t i o n of a single cyc l e of opti c a l p u m p i n g m a y be invalidated, and coherences m a y also b e c o m e important.
have shown that atomic alignment must be included. They demonstrate (experimentally and theoretically) that magnetic
fields have a substantial influence on the amplitudes of the peaks, particularly the combined Dac and Cad crossover. This may be a contributing factor to the poor agreement for this peak in the standard saturated absorption profile of
Fig. 3.5.
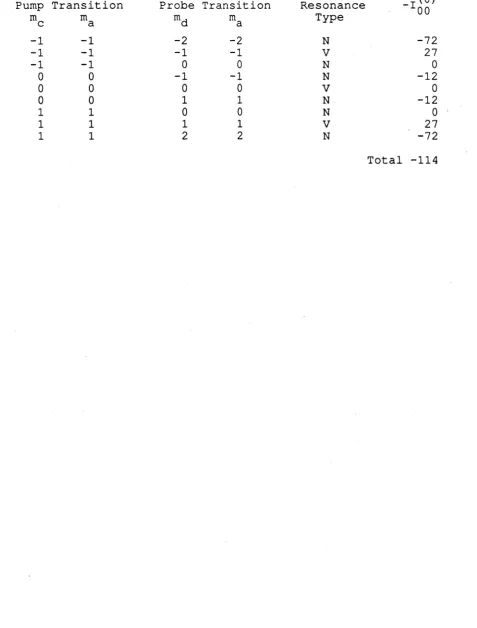
Despite the slight discrepancies shown in Fig. 3.5, this theory can be used to show the importance of Zeeman optical pumping in the Cad resonance. Table 3.3 shows the calculated contribution of each Zeeman transition to the amplitude.
Note that it includes "N system" combinations of Zeeman sub-levels where the pump and probe transitions do not share a common state. This sort of combination is the only type that can produce a contribution for the m = ±2 transitions of the probe beam.
It can be seen from Table 3.3 that probe transitions between m = ±2 sub-levels produce a strong negative
contribution to the signal. Probe transitions between m = ±1 sub-levels produce a positive contribution (adding the
four state system, but in general it is necessary to include the Zeeman sub-levels in order to predict the amplitude.
It is known that the polarisations of the two lasers influence saturated absorption spectroscopy profiles (Sargent 1976, Pappas et. al. 1980). Fig. 3.7 shows co-propagating saturated absorption profiles for four different combinations of pump and probe polarisation. Figs 3.7b to 3.7d are
earlier results without the slight tilt on the windows of the cell to deflect reflected pump beams away from the probe beam (see Chapter 2). Features marked with an asterisk are due to these spurious reflections and should be ignored.
Fig. 3.7 shows that the pump polarisation influences the relative heights of the "I system” (line I) and "V system”
(lines II and III) resonances more than the ”A systems” (lines IV and V) and "N systems” (lines VI, VII, VIII and IX) .
As mentioned earlier, Zeeman optical pumping is more important in the "V system" resonances. As the probe polarisation is rotated from being parallel to the pump polarisation to perpendicular, it changes from pure K
differing strengths of the Zeeman transitions that contribute to the probe transition. In particular, the Cad resonance is only negative going when the probe laser is K polarised.
Note that this cannot be seen directly from Fig. 3.7. This is because the line II peak at the pump detuning shown
contains a significant contribution from the Cbd resonance. However, profiles taken at lower pump detuning show a
positive peak on line II.
For the case of a circularly polarised pump laser (Fig. 3.7d), Zeeman optical pumping is again important for the "V system" peaks. The population of the m = 1 , 2
sub-a
levels is i n c r e a s e d by a G + pump laser. S o m e of the Z e e m a n transitions that contribute to the absorption of the probe laser experience increased absorption and some reduced. The sign of the resultant peak is again due to the relative
strengths of the individual transitions.
3.2 Polarisation spectroscopy: linearly polarised pump
Figure 3.8 shows a series of polarisation spectroscopy profiles with linearly polarised, co-propagating beams. Since the two lasers were co-propagating, the same
identification of the peaks (Fig. 3.3) can be made. However, the amplitudes of corresponding peaks are obviously
substantially different.
Amplitudes and signs of the peaks in polarisation
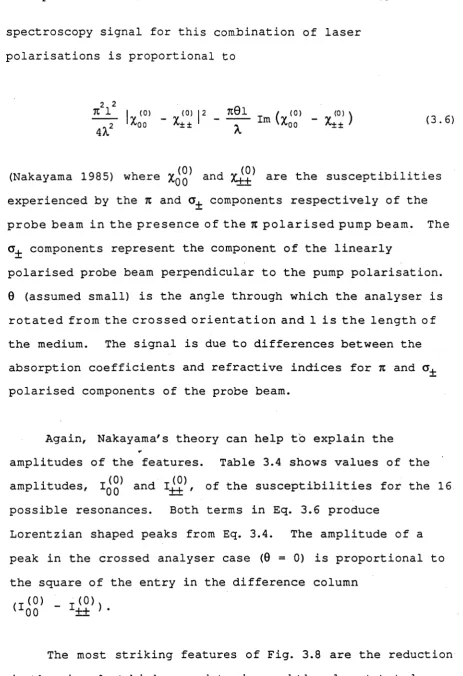
spectroscopy signal for this combination of laser polarisations is proportional to
2 . 2
K 1
4^
lx
(0)00 - Xh
(0) 12 7101
Im (x,
-)
(3.6)(Nakayama 1935) where Xq q1 and X++* are the susceptibilities experienced by the 7t and c + components respectively of the p r o b e b e a m in the p r e s e n c e of the n p o l a r i s e d p u m p beam. The
cj_i_ components represent the component of the linearly
polarised probe beam perpendicular to the p u m p polarisation. 0 (assumed small) is the angle through w h i c h the analyser is r o t a t e d f r o m the c r o s s e d o r i e n t a t i o n a n d 1 is the l e n g t h of the medium. The signal is due to differences between the absorption coefficients and refractive indices for k and G+ polarised components of the probe beam.
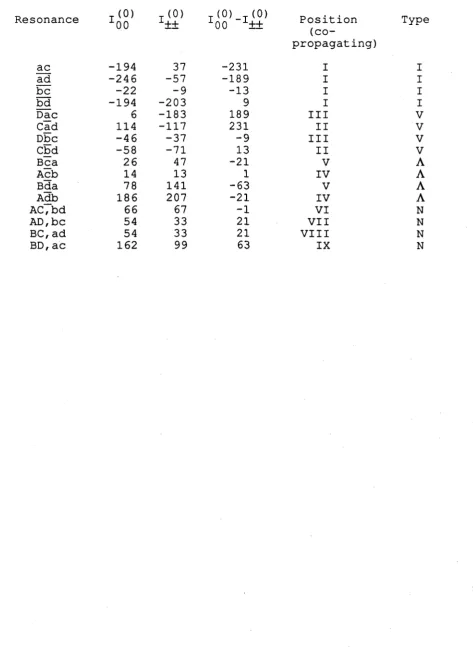
Again, Nakayama's theory can help to explain the
amplitudes of the features. Table 3.4 shows values of the amplitudes, Iq q^ and , of the susceptibilities for the 16 possible resonances. Both terms in Eq. 3.6 produce
Lorentzian shaped peaks from Eq. 3.4. The amplitude of a peak in the crossed analyser case (0 = 0) is proportional to the square of the entry in the difference column
(I(0) - I(0)
00 A±±
The most striking features of Fig. 3.8 are the reduction in the sign a l at h i g h p u m p d e t u n i n g and t h e a l m o s t total
[image:53.558.66.530.56.733.2]mentioned earlier, the signal on line I at low pump detuning is almost entirely due to the ac and ad resonances.
Table 3.4 shows that, in both cases, there is a strong
disparity between the susceptibilities for the n (Xq q^) and a (X^+^) components of the probe beam. The probe beam thus experiences a polarisation rotation (since the difference in absorption coefficient changes the relative amplitudes of the two components) and becomes elliptically polarised (since the two types of component become dephased due to the difference
in refractive index). These two effects cause a strong polarisation spectroscopy signal.
In contrast, the signal at high pump detuning is
predominantly due to be and bd resonances. As can be seen from Table. 3.4, both types of polarisation component of the probe beam experience a small effect from the be resonance, while the bd resonance produces strong effects. However, since the two susceptibilities are approximately equal in this case, there is little effect on the polarisation of the probe laser, resulting in a small signal. This highlights the importance of the detection technique in the profiles. Table 3.2 shows that the bd resonance produces a strong signal in a saturated absorption experiment. However, the polarisation spectroscopy signal is small, causing the reduction in signal at high pump detuning.
corresponding peaks on lines IV, VI and VII.
Polarisation spectroscopy experiments are often carried out with the analyser slightly rotated from the crossed
position, transmitting a small proportion of the probe beam. This light behaves as a local oscillator, mixing with the scattered signal beam. Negative going peaks are possible due to this heterodyning effect, whereas Eq. 3.6 shows that only positive signals are expected with a crossed analyser.
Figure 3.9 shows co-propagating polarisation spectroscopy profiles for a range of analyser orientations.
As the analyser is rotated away from the crossed position, it can be seen that the differences between the
sizes of the central peaks (principal resonances and "V system" crossovers) and the outlying crossovers
("A system" and "N system" resonances) are reduced. Eq. 3.6 shows that as 0 increases, the heterodyned term becomes more important. Compared with the linear dependence on the
susceptibility difference of this term, the quadratic dependence of the first term magnifies the range of peak heights due to the range of values of the susceptibility difference.
As the analyser is rotated, the heterodyned term causes significant changes to the profiles. However, if it is
rotated beyond a limiting position, no further changes to the form of the profiles occur because the heterodyned term
orientation that gives a predominantly heterodyned signal can only be determined from the experiment. This is because only relative values of the amplitudes, I ^ , of the
PP
susceptibility are calculated. It is therefore not possible to determine the relative importance of the heterodyned and quadratic terms for any particular value of 9.
The other dramatic effect of the analyser rotation is the change in polarity of some peaks. Eq. 3.6 indicates a dependence of the signal on the sign of the rotation of the analyser. Because of the negative sign in Eq. 3.4, if 0 is positive, the heterodyned term takes on the same sign as the difference term listed in Table 3.4. Figure 3.9 shows that, as the analyser is rotated, certain peaks become negative.
Using Fig. 3.3 the most obvious negative peaks may be identified as lying on lines I and V. The largest negative entries in the difference column of Table 3.4 correspond to resonances contributing to these lines. If the analyser rotation is positive, the optical pumping theory has
therefore correctly predicted the polarities of the features.
Examination of the derivation of Eq. 3.6 (Nakayama 1981b) shows that the angle 0 is defined to be positive if the analyser is rotated clockwise while looking in the
direction of propagation of the probe beam. As mentioned in Appendix A, the orientation of the analyser was adjusted