1
Performance of a Centrifugal Pump Running in
Inverse Mode
J Fernández
Universidad de Extremadura, Dpto. de Electrónica e Ingeniería Electromecánica Avda. de Elvas s/n. 06071 Badajoz, Spain
E Blanco, J Parrondo
Universidad de Oviedo, Dpto de Energía, Campus de Viesques, 33271-Gijón (Asturias), Spain
M T Stickland*, T J Scanlon
University of Strathclyde, Department of Mechanical Engineering, Glasgow, G1 1XJ Scotland.
Keywords
Turbomachinery, inverse mode, forces, constant head
ABSTRACT
This paper presents the functional characterization of a centrifugal pump used as a turbine. It shows the characteristic of the machine involved at several rotational speeds, comparing the respective flows and heads. In this way, the influence of the rotational speed on efficiency as well as obtaining characteristic at constant head and runaway speed can be observed. Also the forces actuating on the impeller were studied. An uncertainty analysis was made to assess the
*
2 accuracy of the results. The research results indicate that the turbine characteristics can be predicted to some extent from the pump characteristics, that water flows out of the runner free of swirl flow at the best efficiency point, and that radial stresses are lower than pump mode.
NOMENCLATURE
b2 impeller width at outlet
D2 impeller diameter at outlet
Hth theoretical head
Hp, Ht pump and turbine head
Kf flow coefficient
Khp head coefficient – pump mode
Kht head coefficient – turbine mode
Kpp power coefficient – pump mode
Kpt power coefficient – turbine mode
Ks radial force coefficient
pi pressure in the hole i
Q flow-rate T torque
u2, u1 peripheral velocity at impeller outlet and inlet
u2u, u2m tangential and meridian components of the absolute velocity
z number of blades
1 outlet angle
ph, ηht pump and turbine hydraulic efficiency p, ηt pump and turbine efficiency
fluid density
3
1. INTRODUCTION
Because of the depletion of natural resources and global environmental problems, there is a need to develop renewable energy sources with minimal environmental impact. One of the most mature techniques for renewable power generation is electric. A large number of hydro-electric power generation schemes have been implemented and the technology is now quite mature. However, the possibility for the implementation of large scale hydro electric power generation, whilst benefiting from the economies of scale, is not always technologically, economically, politically or environmentally feasible. Consequently, interest in small scale hydro electric power generation is increasing. However, construction costs for such plant are relatively high when compared with the small amount of power generation possible. The high construction costs limit the possibility for its implementation. If the construction costs could be reduced small scale hydro electric power production could be become more widespread especially in the third world.
For low and very low power plants (power less than 100 kW), the possibility of using pumps instead of turbines deserves consideration because, even though there is an efficiency reduction, there is a significant reduction in the capital cost of the plant, of the order of 10 to 1 or even more. The inverse working mode of hydraulic turbines has been investigated before by Kittredge[1], Knapp[2], and Stepanoff[3] but the technology for their use in electrical power generation was not available at that time. However, advances in electrical machinery control technologies, which allow the driving regulation with variable velocity, rotation sense and torque have created the possibility of the utilisation of pumps working in inverse mode for power generation
4
Most of the studies carried out were based on the hypothesis of the similarity between maximum efficiencies working in both modes, which is not easy to maintain, and other studies were based on algebraic relations as a function of efficiency. All of them have been achieved considering equal rotational speeds in both working modes. In this paper, the characteristics of a specific pump acting in inverse mode against rotational speed are shown. To accomplish this, a suitable facility has been designed, built and characterized. The facility consists of two pumps, the pump-turbine being tested and an auxiliary one, forming a closed loop through a regulation reservoir. The auxiliary pump is driven by a motor with adjustable speed of rotation by means of a variable frequency drive and provides the flow rate and head required by the pump-turbine. The pump-turbine (non-dimensional specific speed of pump is 0.52) can be connected either to a motor for pump operation or to a generator (turbine operation) that supplies electric power to a set of dissipative resistances. The turbine-generator set can rotate at any prescribed speed, Fernández[4].
Thus, when instrument calibration (torquemeters, tachometers, pressure transducers, flow meters and others) had been completed, characteristic curves at constant speed in pump and turbine modes were obtained, allowing comparison between them. New characteristics at constant head which allow the selection of turbines as well as the determination of runaway speed have been deduced.
The aim of this research has been to show the feasibility of using pumps in turbine mode in small hydroelectric stations, and to regulate the power by means of variations in the turning speed of the turbine-generator set.
The steps followed were:
- Pump performance, working in normal and reverse modes.
- Comparing radial thrust and velocity founding a relation between them and the best efficiency point.
5
2. EXPERIMENTAL SETUP
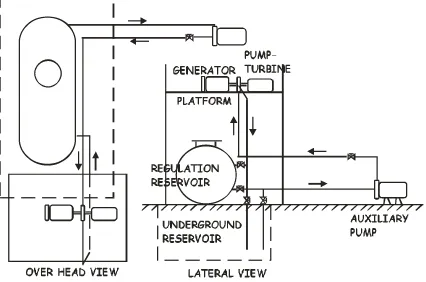
[image:5.595.86.512.424.706.2]The performance of the pump, operating either in the normal or inverse mode, was tested in a hydraulic set-up designed according to ISO 3555:1977, shown in figure 1. It consisted of a tank with 10 m3 of capacity, to which two pumps were connected through a piping network: the main pump and an auxiliary one. Appropriate piping permitted the water to be pumped from and returned to a reservoir. Flow-rate could be finely regulated by means of a set of butterfly valves located close to the discharge reservoir. The flow-rate was measured with an Ultraflux UF321 ultrasonic flow-meter (up to 0.008 m3/s) and with a calibrated orifice plate connected to a differential pressure transducer (flow-rates above 0.008 m3/s). The main pump was driven by a DC-motor governed by a regulation device that allowed for continuous adjustment of the rotational speed, with a precision of ±1 rpm.
6 The auxiliary pump supplies the flow rate and head required by the pump being tested as a turbine. It is capable of delivering 160 m3/h and a head of 90 m at the design point (2900 rpm with a 55 kW consumption) and it is driven, at any selected speed below 3000 rpm, by a motor controlled by a frequency variator. The auxiliary pump draws water from the tanks and delivers it to the inlet of the pump-turbine under study.
The pump used for this investigation had single axial suction and spiral volute casing (figure 2). It was equipped with an impeller of 200 mm outer diameter with 7 backward curved blades with logarithmic profile. Other impeller dimensions were; inlet diameter (tip) =52 mm, discharge width b2=16.9 mm, blade angle at outlet =29º, rake angle (outlet pressure
side) =10º, rake angle (outlet suction side) =29º. The cross-section of the volute increased linearly from 2.5 to 40 cm2 with a minimum gap between tongue and impeller of 10 mm (=10% of impeller radius).
10º
10º
29º 16.9 mm
4.5 mm U2
[image:6.595.178.460.382.538.2]Probes
Figure 2: Sketch of the test pump showing location of the pressure taps and detail of
impeller outlet (all dimensions in mm).
Pressure taps with 3 mm diameter were located every 10° around the front side of the volute,
at 2.5 mm from the outlet of the impeller, figure 2. Static pressure at these positions could be
obtained with a Kistler 4043A10 piezo-resistive pressure transducer and a current amplifier,
which provided absolute pressure values with an uncertainty of less than ±0.5% (according to
manufacturer's data). Each of the transducers, connected to an amplifier, provided pressure
7 data. The resulting pressure signals were digitized and stored in a personal computer equipped with a multi-channel analogue to digital conversion card. Spectral analysis of the signals was then performed by software.
The rotational speed was determined by a tachometer. To calculate the power, a torquemeter, placed between the turbine and the generator, was used. The torque was measured by a strain gauge transducer. Further information on the instrumentation may be found in Fernández [4].
The performance curves were obtained at a constant rotational speed, which could be fixed by means of the electrical control equipment connected to the turbine-generator set. Once the turbine velocity was fixed, the speed of the auxiliary pump was progressively increased, thus increasing the flow rate and the available head. For each flow rate, fixed by the auxiliary pump, flow rate, pressures and torque measurements were made.
An uncertainty analysis was applied to the measurements using the procedure developed by Kline and McClintock[5]. For each variable the uncertainty was calculated taking into account the apparatus uncertainty and the acquisition uncertainty due to the analogue to digital data acquisition card. The application of the uncertainty analysis to the best efficiency point of the 1500 rpm curve gives a relative uncertainty lower than 2.75 % in the efficiency, 0.82 % in torquemeter, 0.25 % in tachometer, 1.06 % in flow rate and 2.38 % in head. For details of the uncertainty analysis refer to Fernández[6].
3. EXPERIMENTAL RESULTS
3.1 Performance curves at constant speed
8 and efficiencies are defined as follows:
Power coefficient:
Kp = P/( 3D25 ) equation 1
Head coefficient:
Kh = gH/( D2)2 equation 2
Flow coefficient:
Kf = Q/( D23) equation 3
Pump and turbine efficiency:
ω ρ η
T gQH
p = ,
gQH T
t ρ
ω
η = equation 4
9 0.00 0.10 0.20 0.30 0.40 0.50 0.60 0.70 0.80
[image:9.595.99.502.81.329.2]0.000 0.005 0.010 0.015 0.020 0.025 0.030 0.035 Flow coefficcient H e a d c o ef fi cc ie nt a nd e ff ic ci e nc y 0.000 0.001 0.002 0.003 0.004 0.005 0.006 0.007 0.008 Po w e r co e ff ic ci e nt
Kpt
Kpp
Khp
Khp
η
t
η
p
Figure 3: Non-dimensional curves at 1500 rpm in pump and turbine modes
3.2 Radial thrust
The radial force was calculated by multiplying the pressure obtained by the outlet rotor width plus shroud width and by the circumferential length:
Fi = p (b2 + shroud width) circumferential length
∑
equation 5= = 36 1 i i F
Fr r
Later, these forces were added up giving a resultant, which goes through the centre of the rotor and an angle.
In pump mode, the radial force obtained was seen to diminish as the flow approached the design point where it reaches a minimum. The results are agree with another authors (Neumann[7], Iversen[8], Engeda[9]). Radial force can be put as well in non dimensional mode:
(
ω 4ρ)
2 2D F
Ks = equation 6
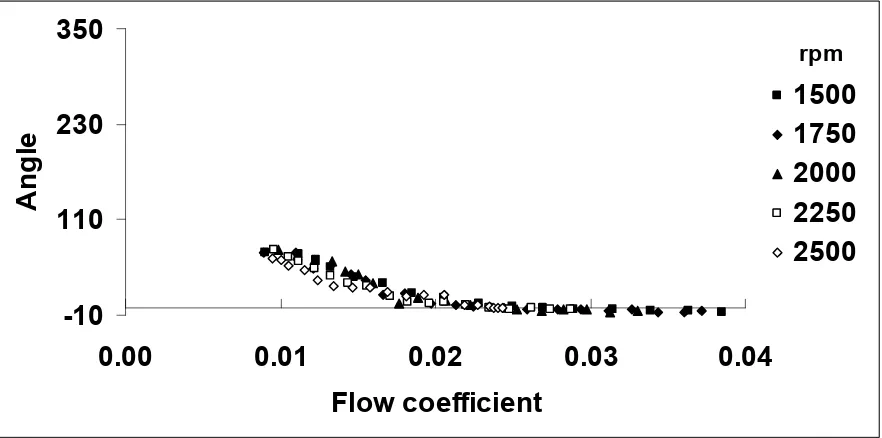
10 the angle of incidence of this force varies: shifting, ahead of the design point within 2nd quadrant angles (90° - 180°) and behind the design point within 4th quadrant angles (270° - 360°) as seen in figure 5. The results are logical as the pumps were made so that mechanical stress acting on the rotor and volute were minimal.
rpm
0 1 2 3
0.000 0.005 0.010 0.015 0.020 0.025
[image:10.595.74.527.193.402.2]Flow coefficient R a d ia l F o rc e c o e ff ic ie n t (K s ) 1500 1750 2000 2250 2500
Figure 4: Radial force coefficient in pump mode
rpm
-10
110
230
350
0.000
0.010
0.020
[image:10.595.76.521.380.655.2]Flow coefficient
A
n
g
le
1500
1750
2000
2250
2500
Figure 5: force angle in pump mode
11 increasing, but, excluding large flow rates, was lower than in pump mode. The turbine best efficiency point does not correspond to a minimum of the forces. The forces measured in the turbine are always smaller than the maximum forces found in pump mode, thus it may be concluded that the forces in turbine mode will not produce an increase in material fatigue compared with the pump mode.
rpm
0
1
2
3
0.00
0.01
0.02
0.03
0.04
[image:11.595.75.519.193.415.2]Flow coefficient
R a d ia l F o rc e c o e ff ic ie n t (K s )1500
1750
2000
2250
2500
Figure 6: Radial force coefficient in turbine mode
rpm
-10
110
230
350
0.00
0.01
0.02
0.03
0.04
Flow coefficient
A
n
g
le
1500
1750
2000
2250
2500
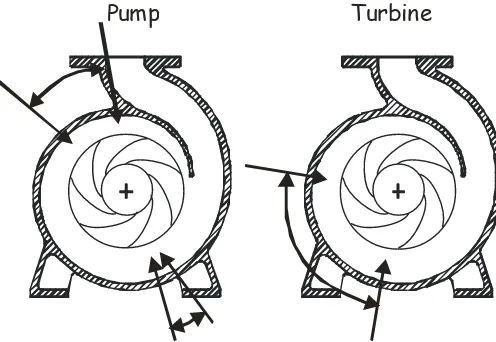
[image:11.595.79.520.492.711.2]12 Figure 8 shows the areas where the radial thrust is concentrate in pump and turbine modes.
Pump Turbine
Figure 8: Locations of radial thrust concentration
3.3 Post-rotation velocity
It is known that in pump mode, close to the best efficiency point, the velocity at inlet to the impeller has no rotation. For the pump acting in turbine mode the outlet velocity has the same characteristics.
To confirm this, because of the pump size, a three holes probe was manufactured in perspex. Details of the three hole probe and its calibration may be found in Fernandez[4]. Due to the pump design, two holes were made 18 mm from the impeller outlet and at 45º from a vertical line (figure 2). The probe was placed 10mm from the pipe wall towards the centre and measurements taken for several flowrates at the same rotation speed.
13
-1.0 -0.5 0.0 0.5 1.0
10 20 30 40 50
Radius (mm)
V
ta
n
/U
1
ti
p
K = 0.0256f
K = 0.0213f
K = 0.0194f
K = 0.0150f
K = 0.0171f
= 0.0127
f
K = 0.0104f
K = 0.0081f
[image:13.595.143.442.87.299.2]K
Figure 9: Non-dimensional tangential velocity component at the impeller outlet, turbine mode, at 1500 rpm for several flow coefficients
3.4 Prediction of Turbine Characteristics
Theoretical head in a turbomachinery, from of the Euler equation, is:
(
u v u v)
/gHtht = 2 2ut − 1 1ut equation 7
At the best efficiency point, the head in pump and turbine modes are:
g / v u
Hth = 2 2up equation 8
The hydraulic efficiency is defined as:
thp p
hp=H /H
η ηht =Htht /Ht equation 9
And then:
g / v u
14 The ratio between these equations is:
(
up hp ht)
utp
t H v v
H / = 2 / 2 η η equation 11
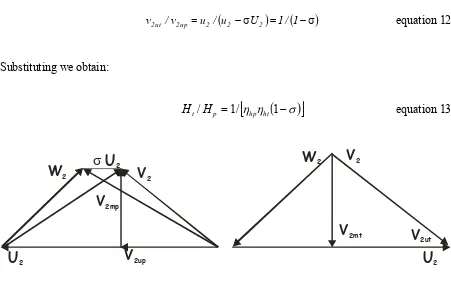
In the figure 10 we can see the velocity triangles for pump and turbine mode. In pump mode there is a slip at the impeller outlet. In turbine mode the relative flow angle at the impeller inlet is close to the blade angle at the best efficiency point. The following ratio is obtained:
(
−σ)
=(
−σ)
=u / u U 1/ 1 v
/
v2ut 2up 2 2 2 equation 12
Substituting we obtain:
(
)
[
η η −σ]
=1/ 1
/ p hp ht
t H
H equation 13
U
2U
2σ
U
2W
2W
2V
2V
2mpV
2mtV
2upV
2ut [image:14.595.72.523.246.529.2]V
2Figure 10: Velocity triangles at the impeller outlet (pump) and inlet (turbine)
For this pump the hydraulic efficiencies are known, Fernández[4], hp = 0.88 and ht = 0.84, and
then it can obtain the slip coefficient:
0.2176 sin
z =
=π β
σ equation 14
We have:
15
Figure 11 shows the ratios between turbine and pump at the best efficiency point for head, flowrate and efficiency. Results in head are close to the value obtained above. However, these results are higher than shown for other authors (Engeda[9]). In this case, we have a centrifugal pump, and the main process to convert the energy is not the flow diffusion but the centrifugal forces. The blades inlet in turbine mode is not rounded and so, the losses are increased and the hydraulic efficiency decreases.
The above values indicate the possibility that the characteristics in turbine mode can be predicted from the characteristics in pump mode. However, in order to predict this, numerical simulations are required to enable the comparison between pumps including those belonging to different families.
0.50
0.75
1.00
1.25
1.50
1.75
2.00
125
0
150
0
175
0
200
0
225
0
250
0
Rotational speed (rpm)
H
t/
H
p,
Q
t/
Q
p,
η
t/
η
p
Ht/Hp
Qt/Qp
[image:15.595.116.482.359.579.2]ht/hp
Figure 11: Ratios at the best efficiency point
3.5 Performance curves at constant head
16
Figures 12-13 show curves corresponding to 20 and 30 m head respectively. The shown values have been obtained from the characteristic curves. Power and efficiency are represented by families of curves, which have a common point of origin (zero power with the machine stopped) and the other point at the abscissa axis, which fixes the so called runaway speed at which the power generated is zero, consuming a certain supply flow rate. This speed increases with the head. For a head of 20 m the runaway speed is 2235 rpm.
0 20 40 60 80 100
1000 1250 1500 1750 2000 2250 2500 Rotational speed (rpm)
[image:16.595.153.464.243.420.2]F lo w ( m ^ 3 / h ), Ef fi cc ie n c y (% ) 0.0 1.0 2.0 3.0 4.0 5.0 6.0 P ow e r (k W )
η
Power FlowFigure 12: Constant head of 20 m
0
20
40
60
80
100
1000 1250 1500 1750 2000 2250 2500
Rotational speed (rpm)
[image:16.595.131.475.473.667.2]F
lo
w
(
m
^
3
/h
),
E
ff
ic
ci
en
cy
(
%
)
0.0
1.0
2.0
3.0
4.0
5.0
6.0
Po
w
er
(
kW
)
η
Power Flow17
4. CONCLUSIONS
This paper has described the behaviour of a centrifugal pump in turbine mode at several rotating speeds.
The stress in turbine mode will not produce greater material fatigue than in pump mode, although it is always rising. These forces do not indicate the best efficiency point.
Turbine characteristics were compared with pump characteristics. Once the characteristics in pump mode were known, the characteristics while operating in turbine mode could be approximately predicted. However, in order to predict the turbine characteristics with even more accuracy it would be necessary to obtain more test data and statistically analyze design data. The possibility of accomplishing this by numerical simulation will be the subject of a future paper.
The constant head curves which allow the selection of the generator rotating speed and, for machines liable to a varying inlet regime, a variable flow exploitation criterion were obtained; thus, a control program which allows the turbine to work at optimum efficiency versus the energy consumed was created.
5. ACKNOWLEDGMENTS
18
REFERENCES
1. Kittredge, C.P. "Centrifugal Pumps Used as Hydraulic Turbines". Trans. ASME, Vol. 63, 1941.
2. Knapp, R. T. "Centrifugal Pump Performance as Affected by Design Features". Trans. ASME, Vol.63, 1941.
3. Stepanoff, A. J. "Centrifugal and Axial Flow Pumps", Ed. J. Wiley. New York, 1957.
4. Fernández, J., "Caracterización del flujo en una bomba centrífuga operando en modo turbina centrípeta" (in spanish), Ph.D. Thesis, University of Oviedo, 1994.
5. Kline, S.J., "The purposes of Uncertainty Analysis", Journal of Fluids Engineering, June 1985, vol 107, pp 153-160.
6. Fernández, J., Santolaria, C., Ballesteros, R., Blanco, E.; "Test facility of inverse-working pumps for small and very small hydro-power plants", Proceedings of the International Congress on Hydropower into the next century. ISBN 0-9522642-2-6, pp. 657-664. Barcelona, June 1995.
7. Neumann, B. "The interaction between geometry and performance of a centrifugal pump". Mechanical Engineering Publications Ltd, London, 1999.
8. Iversen, H.W. et al, "Volute Pressure Distribution, Radial Force on Impeller and Volute Mixing Losses of a Radial Flow Centrifugal Pump", Trans. of ASME, Journal of Engineering for Power, Vol 82, n1 2, April 1960, p. 136-144.
20 List of Figures
Figure 1: Test facility, over head and lateral view
Figure 2: Sketch of the test pump showing location of the pressure taps and detail of impeller outlet (all dimensions in mm).
Figure 3: Non-dimensional curves at 15
Figure 4: Radial force coefficient in pump mode 00 rpm in pump and turbine modes Figure 5: Force angle in pump mode
Figure 6: Radial force coefficient in turbine mode Figure 7: Force angle in turbine mode
Figure 8: Locations of radial thrust concentration
Figure 9: Non-dimensional tangential velocity component at the impeller outlet, turbine mode Figure 10: Velocity triangles at the impeller outlet (pump) and inlet (turbine)
Figure 11: Ratios at the best efficiency point Figure 12: Constant head of 20 m