Economic Perspective 1
ELECTRONICS ENFLOnCMT Dl SCOTLAND
John Maclnnes, Department of Social & Economic Research, University of Glasgow Alan Sproull, Department of Economics, Glasgow College of Technology
Introduction
C o n s t r u c t i n g an a c c u r a t e record of electronics employment in Scotland faces four d i f f i c u l t i e s of d e f i n i t i o n . There i s f i r s t t h e problem of which SIC d i v i s i o n s or c l a s s e s t o i n c l u d e . M i c r o e l e c t r o n i c technology i s now a feature of a wider range of goods than before. Secondly, there i s the problem of assigning whole establishments to SIC h e a d i n g s when t h e i r p r o d u c t s a r e h e t e r o g e n e o u s . In p r a c t i c e whole establishments may be reclassified on the basis of less than complete changes in the nature of their production. Thirdly, SIC c l a s s i f i c a t i o n s have themselves changed, reflecting the evolution of technology and products in industry i t s e l f . Fourthly, time s e r i e s d a t a on e s t a b l i s h m e n t s (chiefly SCOMER) usually classifies past employment of establishments to t h e i r current activity. This final problem has been partly overcome by the development of data classifying establishments to their a c t i v i t y in each p a r t i c u l a r year by the Industry Department for Scotland Csee IDS 1986b). These qualifications should thus be borne in mind when d i s c u s s i n g electronics employment.
They do n o t , h o w e v e r , p r e v e n t us developing a general picture of trends in e l e c t r o n i c s employment in Scotland which i s relevant both to the formulation of economic and industrial policy and to the wider public debate about economic change and i t s impact on society. Electronics has been seen as very i m p o r t a n t in Scotland because i t has been identified as a new, high technology industry which has the p r o s p e c t t o r e p l a c e the wealth creation, skill generation and employment l o s t as a r e s u l t of the decline of older
staple industries like coal mining, steel manufacture, s h i p b u i l d i n g and heavy engineering. I t i s therefore interesting t o compare a s p e c t s of employment in electronics with manufacturing as a whole in Scotland, to examine j u s t what the absolute contribution of e l e c t r o n i c s has been, and how i t compares with other industries.
Net employment growth
Table 1 shows v a r i o u s ( d i f f e r i n g ) estimates of electronics employment. I t can be seen that the growth of electronics employment has tended to occur in waves of development: the 1960s saw the growth of the industry from a r e l a t i v e l y minor a c t i v i t y , accounting for about 1% of manufacturing employment to one employing over 30,000 (over 40,000 according to the SCOMER classification) workers: around 5% of manufacturing employment. During the 1970s employment stagnated and probably f e l l , but any f a l l was l e s s rapid than that occuring in manufacturing employment generally. At some point in the l a t e s e v e n t i e s , before 1978, e l e c t r o n i c s employment picked up again. Between 1980 and 1982 employment faltered once again, f a l l i n g from a peak of 43,100 in 1980 to 39,700 in 1982 according to the IDS ' c o n s i s t e n t ' s e r i e s . Since then there has been renewed growth.
Packard a r r i v e d . Figures from the 1973 Scottish Council Database suggest that by then 37$ of electronics employment was US owned. IDS e s t i m a t e s for 1978 put the figure a t 33%. Between 1978 and 1985 US owned employment increased by over one third, while UK owned employment decreased s l i g h t l y so t h a t by 1985 42J of electronics employment in Scotland was US owned (IDS, 1986b, p11).
Table 1 Estimates of electronics employment 19*6-1985 OfaxBards)
A B C Industry Dept for SOOCR, Latest Scotland Consis- Classification Survey teat Series 1966-1978(1968 & (SCDER) SK),1978-1985
Date
1945 1959 1966 1968 1971 1973 1978
1979 1981 1983 1984 1985
Censuses
3 7
37
34) » 37) 38
42
(SEC 1980)
39 42 41 43 45 44
(1980 S K )
41 48 48 49 48 45 48 43 41 43 44
Sources:
A 1945, 1959 see Crawford (1984); 1971, 1978: Census of Enjoyment on the 1968 SIC basis; 1978, 1981, 1984: Census of Employment on 1980 SIC basis. See also Table 9.1 Firn and Roberts (1984).
B IDS based on SCCtER using 1980 SIC classification of establishment at relevant employment year. See IDS (1986b) (ie plants which a t the time
produae(d) electronics goods).
C SCOMER 1968 or 1980 SIC definition based on latest knwon establishment classification (ie plants which nw produce electronics goods). » The two figures for 1978 are based on Census of
Employment results calculated on 1968 SIC (34,000) and 1980 SIC (37,000).
Definition of Electronics:
1968 Miranun l i s t headings 354, 363-367
1980 Activity Headings 3302, 3433, 3441-3444, 3453, 3454, 3710, 3732.
Table 1 columns B and C show t h a t employment in establishments currently classified to electronics has f a l l e n from around 48 thousand in 1979 to i t s 1985 level of 44 thousand. On the other hand electronics employment (ie employment in establishments c l a s s i f i e d to e l e c t r o n i c s in the relevant year has grown from around 39 thousand in 1978 to a peak of nearly 45 thousand in 1984. These differences a r i s e because of the two d i f f e r e n t ways employment change came about: from the change in the nature of establishment's production, so t h a t they become p a r t of the e l e c t r o n i c s industry, and through changes i n t h e employment l e v e l s of establishments in the industry. Thus, while employment in electronics activity was growing between 1979 and 1985, employment in the establishments where t h a t a c t i v i t y was now taking place had f a l l e n over the period. For example, watch and clock manufacture, previously seen as instrument engineering, i s now c l e a r l y p a r t of the e l e c t r o n i c s industry due to the extensive use of microchips. The r e c l a s s i f i c a t i o n h a s b o o s t e d e l e c t r o n i c s employment d e s p i t e the f a c t t h a t many watch and clock manufacturers have cut t h e i r labour force. These two d i s t i n c t employment trends suggest t h a t growth i n e l e c t r o n i c s employment i s associated with the loss of other forms of employment which a r e d i s p l a c e d by technological i n n o v a t i o n . In o t h e r words, growth in electronics jobs i s not a simple net gain.
Gross components of employment change
b e t t e r by examining t h e components of c h a n g e of e l e c t r o n i c s e m p l o y m e n t i n S c o t l a n d , and comparing i t w i t h o t h e r i n d u s t r i e s .
Table 2 C o m p o n e n t s o f c h a n g e o f e l e c t r o n i c s employment, Scotland 1978-85
1978 Stock of employment Openings 1978-85
Expansions 1978-85 Contractions 1978-85 Closures 1978-85 1985 stock
38,190 6,763 13,480 7,650 8,370 42,410
Table 3 compares components of employment c h a n g e i n e l e c t r o n i c s a n d a l l m a n u f a c t u r i n g f o r t h e p e r i o d 1968-77, u s i n g d a t a from SC0MER. I t shows t h a t t h e components of employment change a r e f a i r l y l a r g e for manufacturing as a whole b u t t h a t f o r e l e c t r o n i c s t h e y a r e s u b s t a n t i a l l y g r e a t e r . Indeed i n t h i s p e r i o d g r o s s j o b l o s s i n e l e c t r o n i c s was p r o p o r t i o n a t e l y g r e a t e r than i n s t a p l e i n d u s t r i e s , or i n d e c l i n i n g c o n u r b a t i o n a r e a s l i k e Glasgow 1 However, gross job c r e a t i o n w a s a l s o much h i g h e r p r o p o r t i o n a t e t o i t s employment s t o c k , e l e c t r o n i c s added twice as many new jobs a s s t a p l e s or e s t a b l i s h m e n t s i n Glasgow. This s u g g e s t s q u i t e a v o l a t i l e 'boom and b u s t ' employment p a t t e r n for e l e c t r o n i c s .
Source: IDS Consistent Data S e r i e s : IDS 1968b, Table
3-Notes
1) Components of change netted across two periods 78-81 and 81-85
2) e x c l u d e s f o u r e s t a b l i s h m e n t s and associated employment which opened and closed between 1981 and 85
3) i n c l u d e s c h a n g e s d u e t o r e c l a s s i f i c a t i o n of establishments.
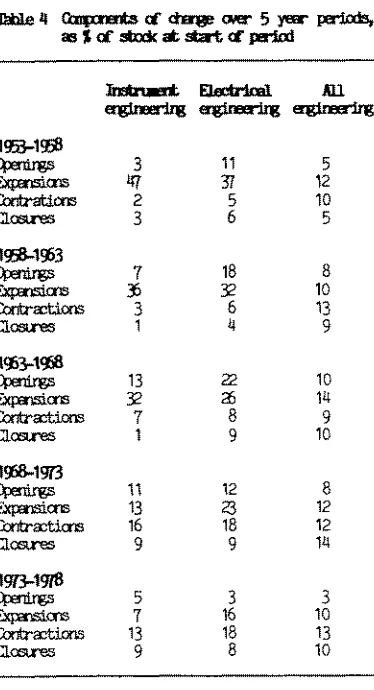
[image:3.507.249.436.279.624.2]T h e s e f i g u r e s c o v e r a p e r i o d when e l e c t r o n i c s employment was hardly growing. Table 4, based on quinquennial components
Table 4 Gompcnents of change over 5 year periods, as % of stock at start of period
Ihsb-iaent Electrical Ml engineering engineering engineering
Table 2 shows components of change between 1978 and 1 9 8 5 , d u r i n g whic]
[image:3.507.35.229.424.612.2]e l e c t r o n i c s employment grew by h p e r i o d 1U. In order t o do so new jobs equivalent t o over h a l f t h e i n d u s t r y ' s s t o c k of 1978 employment were added, meanwhile t h e equivalent of t w o - f i f t h s were l o s t . This suggests t h a t the components of employment change are very s u b s t a n t i a l .
Table 3 Gross uunjuMita of employment change 1968-77, Scotland: narrfactiring
Openings & Qoetres & expansions contracture as J of a s t o f 1968 stock 1968 stock
Electronics 101 98 Staple industries 46 74 Greater Glasgow 49 81 All manufacturing 63 77
1958 stock (000s)
45 167 167 667
Soiree: SCOMER, 1968 SIC definition, classified to
1953-1958 Openings Expansions Cbntrations desires
1958-1953 Openings Expansions Contractions Closures 1953-1958 Openings Expansions Conbr actions CLosires
1958-1973 Openings Expansions Contractions Closures
1973-1978 Openings Expansions Contractions Closures
3 47 2 3
7 36 3 1
13 32 7 1
11 13 16 9
5 7 13 9
11 37 5 6
18 32 6 4
22 26 8 9
12 23 18 9
3 16 18 8
5 12 10 5
8 10 13 9
10 14 9 10
8 12 12 14
3 10 13 10 latest known activity; components sunmed on
of change c a l c u l a t e d by Randall (1985)), confirms high l e v e l s of contraction and closures in e l e c t r i c a l and instrument engineering (a broader i n d u s t r i a l group, embracing about two t h i r d s as much employment again as electronics alone) in the period 1968 to 1978, but show lower levels for earlier years.
Employment profiles
Another way of examining components of employment change i s to look at employment profiles of groups of establishments. We can take the employment size of a group of establishments on opening, measure their s u b s e q u e n t employment p e r f o r m a n c e (including those which have closed and therefore have zero employees) and then express this as a percentage over time of their i n i t i a l employment. This gives us a good measure of the subsequent impact on e m p l o y m e n t of t h e g r o w t h of new establishments.
Analysis of p r o f i l e s for various periods between 1960 and 1978 for electronics and other p l a n t s showed t h a t a l l types of plant tend to generate employment growth for about the f i r s t four years as young establishments' growth outstrips the loss of jobs from establishments which decline and f a i l . After t h i s peak these two components tend to roughly balance out, and u l t i m a t e l y job l o s s in declining and closing establishments leads to a net loss of jobs. However, the employment growth of e l e c t r o n i c s establishments was about t h r e e t i m e s g r e a t e r t h a n o t h e r establishments. In the l a t e 1960s and early 1970s new electronics plants doubled t h e i r o r i g i n a l employment, while others grew by l e s s than one t h i r d , but e l e c t r o n i c s establishments shared the tendency with other establishments for employment growth to become weaker in the course of the 1970s. By the mid 1970s p l a n t s in the early expansion phase were adding only half the employment t h a t p l a n t s a t a s i m i l a r s t a g e in t h e i r development had added in the l a t e 1960s and early 1970s.
Table 5 looks at some of these profiles in g r e a t e r depth. I t appeared t h a t strong e m p l o y m e n t g r o w t h i n e l e c t r o n i c s establishments came from a combination of
f a c t o r s : they were about twice the s i z e of o t h e r opener e s t a b l i s h m e n t s , t h e s u r v i v o r s grew f a s t e r t h a n o t h e r establishments, and they were also l e s s l i k e l y to close. When we r e c a l l the f i n d i n g i n Table 3 about t h e l a r g e n e g a t i v e c o m p o n e n t of c h a n g e i n electronics employment, this suggests that when contractions and closures do occur in e l e c t r o n i c s , they tend t o involve large n u m b e r s of j o b s a t any one t i m e . Analysis of the figures for components of change for the period 68-77 found that the average employment loss per contraction in t h e p e r i o d was 89 for e l e c t r o n i c s e s t a b l i s h m e n t s , and only 22 for a l l establishments. The average employment size of closing electronics establishments was 86 compared t o 51 f o r a l l establishments.
The r e g i o n a l s h a r e of e l e c t r o n i c s employment
Table 6 compares electronics employment in Scotland and Britain as a whole, using the 1984 Census of Employment. i t shows that Scotland's p r o p o r t i o n of e l e c t r o n i c s employment i s roughly similar to that of the UK as a whole. If there i s such a thing as ' S i l i c o n Glen' then t h e r e are also s i l i c o n v a l l e y s and s i l i c o n dales south of the Border. Indeed, the region w i t h t h e g r e a t e s t c o n c e n t r a t i o n of electronics employment i s the South East, excluding Greater London, which has over a third of Britain's electronics employment and about double the average share.
Employment and productivity
Table 7 compares e l e c t r o n i c s employment and output in Scotland between 1978 and 1984. I t shows t h a t there has been very rapid growth in labour productivity, and t h a t when output growth has f a l t e r e d , employment has fallen. The l a t e s t output figures, which show an 11> f a l l in output in the f i r s t quarter of 1986 and a further f a l l of 4% in the second quarter must therefore give cause for concern about current employment prospects unless output recovers.
Discussion
Table 5 Opener establishment employment performance, electronics and all manufacturing 1950-69 and 1966-75
Main opener employment size Total opener employment Total employment growth year 5 % Survivors year 5
Mean survivor employment size year 5
Electronics 1950-69
79 7,900 219% 80%
314
1966-75 82 9,200 87% 77%
203
All manufacturing 1950-69
42 144,800 35% 70%
80
1966-75 38 91,900 26% 72%
66
Source: SCOMER, 1968 SIC definition, all establishments classified to latest known activity.
Table 6 1984 Electronics Employment: Scotland, South East England and Great Britain (in thousands)
Scotland Electronics
Manufacturing
All 1 Electronics as
% of all
41.6 433.7 ,903.9
2.18
South East England (excluding Greater London
160.4 917.1 3,755.2
4.27
Great Britain
470.2 5,326.6 20,845.9
2.26
Scotland as t of Great Britain
8.8 8.1 9.1
South East England (excluding Greater London) as % of Great Britain
34.1 17.2 18.0
Source: Census of Employment 1984; Department of Employment Gazette January 1987; 1980 SIC definitions.
Table 7 Employment, output and productivity
Year
Electronics in Scotland (1980 SIC definition) 1978-1984. Indices 1980=100
1978 1979 1980 1981 1982 1983 1984
97 89 92 Employment
Output Productivity
91 83 91
100 100 100
94 102 109
92 115 125
99 143 144
104 187 180
m o s t i m p o r t a n t i s t h a t S c o t t i s h e l e c t r o n i c s i s mainly a c a p i t a l goods industry. This means t h a t f l u c t u a t i o n s in demand for f i n a l products t r a n s l a t e i n t o l a r g e r swings in demand for the p r o d u c t s of the e l e c t r o n i c s industry i t s e l f . The SDA I n d u s t r y Database reported t h a t 25% of companies had 50% plus spare capacity in 1985.
The nature of many of the jobs in the i n d u s t r y may a l s o c o n t r i b u t e t o the f l u c t u a t i o n in numbers. S c o t t i s h e l e c t r o n i c s i s not a l l about s e c u r e , interesting, highly paid jobs in factories on g r e e n f i e l d s i t e s . The i n d u s t r y produces a range of jobs, some are highly s k i l l e d but many are r e l a t i v e l y l e s s s k i l l e d , r e p e t i t i v e and l i a b l e to be automated in the next few years (see the Economic Perspective by Walker in t h i s issue of the Commentary). A worrying aspect of the industry in Scotland i s the d i s a p p o i n t i n g l y low l e v e l of R & D expenditure outside the defence sector. The r e d u c t i o n o r c l o s u r e of a manufacturing facility i s less costly to a company if t h e i r investment in t r a i n i n g has not been extensive and i f highly s k i l l e d and scarce R & D teams are not being broken up. The SDA I n d u s t r y Database noted t h a t 74% of reported R&D expenditure was undertaken by UK companies (in which defence sector activity i s very important) while US companies accounted for only 24% of R & D d e s p i t e these same companies accounting for over 70% of the turnover in the industry.
The m u l t i - n a t i o n a l e n t e r p r i s e s (both UK and foreign-based) t h a t are so important in the industry normally adopt global production and marketing strategies. In the face of changing market conditions or technology they choose from a wide range of o p t i o n s , from r a t i o n a l i s a t i o n via complete closure of selected branch sites t o opening e n t i r e l y new p l a n t w i t h s u b s t a n t i a l numbers of new jobs being created. I t may be t h a t where foreign ownership and low r e l i a n c e on R & D go together then employment i s made more v u l n e r a b l e . T h i s s i t u a t i o n , i n conjunction with above average plant size i n t h e i n d u s t r y s u g g e s t s a g r e a t e r likelihood of major job l o s s e s or gains t h a n would o c c u r i n i n d i g e n o u s l y controlled industries.
The electronics industry i s very important in Scotland, but i t i s not a magic wand that can cure Scotland's i n d u s t r i a l i l l s .
i t i s e s s e n t i a l t h a t i t i s promoted and helped as an industry. The p o s i t i v e e l e c t r o n i c s image of Scotland and i t s a b i l i t y t o a t t r a c t inward e l e c t r o n i c s investment, often through SDA and Locate in Scotland i n i t i a t i v e s , b e n e f i t s the S c o t t i s h economy. But in employment terms i t i s a small industry and i t s existence i s no excuse for ignoring the p l i g h t of S c o t l a n d ' s t r a d i t i o n a l industries. From June 1979 to June 1986, Scottish manufacturing employment f e l l by 216,000, a figure t h a t represents a l o s s of over 130 jobs every working day for seven years. Electronics i s an important manufacturing industry but for every one job i t gained in t h i s period the r e s t of Scottish manufacturing lost over 50. An i n d u s t r i a l p o l i c y t h a t promotes our traditional as well as newer industries i s e s s e n t i a l to r e - e s t a b l i s h the health of the Scottish economy. Relying on sunrise industries like electronics i s not enough.
References
R Crawford (1984) "The E l e c t r o n i c s I n d u s t r y i n S c o t l a n d " , F r a s e r of
Allander Quarterly Economic Commentary, Vol 9, Ho 4, May.
J Firn and D Roberts, "High Technology I n d u s t r i e s " Industry, Policy and the
Scottish Economy, ed N Hood and S Young,
Edinburgh University Press, 1984.
Industry Department, Scotland (1986a) S t a t i s t i c a l B u l l e t i n No C1.1 January,
The Electronics Industry in Scotland.
Industry Department, Scotland (1986b) S t a t i s t i c a l Bulletin No C2.1, September,
'Employment in the Scottish Electronics Industry, 1978-85'.
J Maclnnes and A Sproull (1986) 'Union Recognition in the Electronics Industry in Scotland', CRIDP Research Report, No 4, University of Glasgow.
J N Randall (1985) 'New Towns and new I n d u s t r i e s ' in R S a v i l l e (ed) The
Development of the Scottish Economy,
1950-1980.