Impact
of
Electrolysers
on
the
Network
Part
of
the
Aberdeen
Hydrogen
Project
Research Report
November
2016
Authors:
Scottish and Southern Electricity Networks:
Steven Adams, Sorcha Schnittger.
University of Strathclyde:
Dr Ivana Kockar, Dr Nick Kelly, Han Xu, Filippo Monari,
Contents
1. Introduction ... 5
1.1 Aberdeen Hydrogen Bus Project ... 6
1.2 Overview of Kittybrewster Hydrogen Refuelling Station ... 6
1.2.1 Compressor and dispensers ... 6
1.2.2 Electrolysers ... 6
1.2.3 Storage ... 6
2. Predicted roll-out of electrolysers ... 8
2.1 UK H2 Mobility Project ... 8
2.1.1 UK market for FCEV ... 8
2.1.2 Supplying the consumer with hydrogen ... 9
2.1.3 The refuelling network map ... 11
3. Understanding the impact of electrolysers on the electrical distribution network ... 12
3.1 Method to evaluate the impact of HRS roll-out ... 12
3.2 Method to evaluate electrolyser operation for different objectives and constraints .. 13
3.2.1 Simulation system to run trials ... 13
3.2.2 Simulation set-up ... 13
3.3 Trial objectives and potential value... 15
3.3.1 Introduction to trials ... 15
3.3.2 Electrolyser set points ... 15
3.3.3 Time of Use (ToU) pricing scheme ... 15
3.3.4 Scheduling of hydrogen production ... 15
3.4 Trial types ... 17
3.4.1 Trial Benefits ... 20
3.4.2 Trial execution... 21
3.4.3 Weekly data analysis ... 22
3.4.4 Utilisation ... 24
3.4.5 Variance ... 24
3.5 Trial results ... 24
3.5.1 Trials evaluating Network Management objectives ... 25
3.5.2 Assessing responsiveness and controllability of the electrolyser during the trials
3.5.3 Controllability of the electrolyser during the trials ... 27
3.5.4 Additional power consumption ... 27
3.5.5 Responsiveness of the electrolyser during the trials... 28
3.6 Power Quality of the electrolyser during the trials ... 31
3.6.1 Voltage ... 31
3.6.2 Power Factor ... 32
3.7 Impact of HRS on the Aberdeen Network ... 34
3.7.1 Connection Points ... 34
4. Modelling the Aberdeen hydrogen refuelling station ... 36
4.1 Overview ... 36
4.2 Initial characterisation of storage charge/discharge ... 36
4.2.1 Bus fuel tank ... 36
4.2.2 Storage ... 38
4.2.3 Compressor ... 38
4.2.4 Electrolyser ... 38
4.3 Simulation model ... 39
4.3.1 Master controller ... 40
4.3.2 Electrolysers ... 41
4.3.3 Compressor ... 41
4.3.4 Storage controller ... 41
4.3.5 Storage tanks ... 41
4.4 Optimisation studies ... 42
4.4.1 Cost function ... 42
4.4.2 Scenarios ... 44
4.4.3 Demand profiles ... 44
4.4.4 Simulations ... 45
4.5 Results and discussion ... 46
4.6 Overview of simulation model results ... 51
4.6.1 Initial Analysis ... 51
5.2 Influence of commercial arrangements on electrolysers sizing and storage ... 52
6. Conclusion ... 54
7. Appendix A: Review of electrolyser technology developments ... 61
7.1 Technology developments and commercial availability ... 62
7.2 Technology conclusions ... 65
8. Appendix B: Contrasting hydrogen and batteries for grid support ... 67
8.1 Hydrogen production overview ... 67
8.2 Grid support capability ... 67
8.3 Key characteristics comparison ... 71
9. Appendix C: Review of NREL testing ... 73
9.1 Background for the investigation ... 73
9.2 Overview of services investigated by NREL Report ... 73
9.3 Testing aims and arrangements ... 74
9.4 Review of NREL test results ... 75
9.5 Comparison of NREL study to UK application requirements ... 79
9.6 NREL test conclusions ... 82
1.
Introduction
The use of fuel cell electric vehicles (FCEV) powered by hydrogen has the potential to compete with fossil fuelled vehicles in the foreseeable future. The UK H2Mobility Project [1] predicts that there could be over 1.6 million such vehicles in the UK by 2030, involving public transport, goods and private vehicles. For FCEV to be a viable alternative to conventional fossil fuelled vehicles, a reliable supply and storage/dispensing infrastructure for hydrogen will be required. UK H2Mobility suggests that 51% of required hydrogen will be produced by electrolysers in 2030. FCEV do not produce any direct carbon emissions; however the production of hydrogen through electrolysis requires electricity. This increased demand for electricity will place additional demands on the electricity network which may initiate a need for network reinforcement. Network reinforcement can be costly, time consuming, and disruptive to local communities.
The Scottish Government’s ‘Electricity Generation Policy Statement – 2013’ sets out a target of delivering the equivalent of 100% of Scottish gross electricity consumption from renewables by 2020. There is growing consensus that the electricity network needs to become more flexible to accommodate this move to a lower carbon generation mix. The National Infrastructure Committee report published earlier in 2016 identifies three sources for this flexibility – increased interconnection, energy storage and demand side management. Electrolysers can provide both energy storage and demand side management and could offer significant benefits by providing grid‐balancing services, which could allow the deployment of additional renewable generation and may alleviate network constraints. It is clear that the ability of electrolysers to be integrated with renewable technologies needs to be better understood to realise these potential benefits.
The “Impact of Electrolysers on the Distribution Network” project was commissioned to establish if it is possible to manage the production of hydrogen by electrolysis such that the need for network reinforcement is reduced, delayed or removed, and also to investigate the impact on renewable generation output where electrolysers are integrated with renewable technologies.
Scottish and Southern Electricity Networks (SSEN) operated as a partner in the Aberdeen Hydrogen Bus Project which included the design, construction and operation of a Hydrogen Refuelling Station (HRS) located in the Kittybrewster area of Aberdeen.
SSEN developed a control system to run trials on the Kittybrewster HRS. Through the trials a series of network scenarios were simulated including demand‐constrained and generation‐ constrained networks. The capacity of the electrolysers to operate flexibly in response to network, generation, and economic signals was also investigated and the outcomes of these trials are contained in this report.
1.1
Aberdeen
Hydrogen
Bus
Project
The Aberdeen Hydrogen Bus Project (AHP), which has backing from public and private sector organisations from the UK and Europe, was delivered as part of the Aberdeen City Council’s H2 Aberdeen initiative. The Project established the first commercial‐scale hydrogen production and bus refuelling station in the UK, the Kittybrewster hydrogen refuelling station (HRS), to fuel ten hydrogen buses in operation in Aberdeen City [2].
The Impact of Electrolysers on the Distribution Network project received Ofgem Low Carbon Networks Fund (LCNF) Tier 1 and Network Innovation Allowance (NIA) funding to undertake additional testing at the Kittybrewster HRS to specifically identify the risks and opportunities to the network associated with any future uptake of this technology in the UK.
The AHP has been co‐funded by Scottish, UK and European partners including Innovate UK, Scottish Government, Scottish Enterprise, Fuel Cells and Hydrogen Joint Undertaking (FCHJU) through the High V.LO‐City and HyTransit projects, Aberdeen City Council, First, Stagecoach, SSEN, and SGN. BOC has invested £1 million in the hydrogen production and refuelling station constructed at Kittybrewster.
1.2
Overview
of
Kittybrewster
Hydrogen
Refuelling
Station
The physical arrangement of the plant at Kittybrewster in Aberdeen city includes three Hydrogenics Hystat™60 electrolysers (hydrogen generator units) [3], two hydrogen compressors, two hydrogen dispensers, hydrogen storage and associated control systems and cooling plant. Hydrogen is dispensed under pressure to fuel a fleet of ten buses which operate on scheduled routes around Aberdeen. This equipment is described in more detail in the sections below.
1.2.1
Compressor
and
dispensers
The Linde IC 90 compressor takes gas at a maximum pressure of 30bar and compresses it, using multiple piston stages, to 500bar in this case. The maximum stated operating pressure is 1000bar and the maximum delivered flow rate is 33.6/67.2kg/h for single or double line units. The nominal power consumption is 2.7kWh/kg, corresponding to a power demand of 90/180kW.
1.2.2
Electrolysers
The filling station includes three Hydrogenics HystatTM60 alkaline electrolysers, each of which operates at approximately 80oC and 10bar providing a maximum hydrogen flow rate of 60Nmt/h or 5.4kg/h. The power demand at this rate of production is stated as 312kW.
1.2.3
Storage
as the stores are depleted there is still high pressure H2 available to fill the bus, as shown in Figure 1.1. The onsite storage feeds two hydrogen dispensers, each capable of providing a 30kg fill in approximately ten minutes. The layout is shown in Figure 1.2.
Figure 1.1: Screenshot (Courtesy of BOC) showing depletion of hydrogen storage. The system uses the lowest
possible pressure to refuel the bus, taking only a portion from the high pressure tank.
2.
Predicted
roll
‐
out
of
electrolysers
To understand the scale of potential electrolyser deployment on the distribution network a review of the UK H2 Mobility Project [1] was undertaken.
2.1
UK
H
2Mobility
Project
Fuel Cell Electrical Vehicles (FCEV) provide the potential to decarbonise road transport, create new economic opportunities, diversify national energy supply, and reduce significantly the local environmental impacts of road transport. The UK H2 Mobility project was established to evaluate the benefits of FCEV to the UK and to develop a roadmap for the introduction of vehicles and hydrogen refuelling infrastructure.
The roll‐out of FCEV will depend on a successful commercialisation and will require the development of a hydrogen refuelling network to support FCEV and their sales..
2.1.1
UK
market
for
FCEV
A number of analyses looked into the demand model and consumer analysis and some of the key findings include:
By 2030 a cumulative FCEV fleet of 1.6 million vehicles can be achieved as the vehicles become cost‐competitive and the Hydrogen refuelling station (HRS) network develops. Annual sales could exceed 300,000 p.a. by 2030.
Early demand will be driven by the 10% of the population attracted to and willing to buy FCEV at the prevailing total cost of ownership. These early adopters would generate sales of FCEV in the UK of approximately 10,000p.a. by 2020.
Initial uptake rates, amounting to 13,000 vehicles in the first five years, are limited by the cost of buying the vehicles. No subsidy for FCEV purchase or operation has been assumed in the roadmap. Accelerating demand in this period requires a substantial reduction in the premium of FCEV over diesel vehicles.
The market growth predicted in the UK H2 Mobility roadmap implies a UK share of 10‐15% of expected global FCEV sales.
The expectations of the vehicle manufacturers and the consumer demand model show a strong correlation. The demand curve is very similar to the experience of
Figure 2.1 UK consumer demand for FCEV increases as the cost premium diminishes and the network of HRS
expands [1]
2.1.2
Supplying
the
consumer
with
hydrogen
Convenient and accessible hydrogen refuelling stations (HRS) are critical for the FCEV uptake, as analysis shows that the availability of hydrogen and cost of ownership are consumers’ primary concerns. The report indicated that consumers expected that the convenience of the HRS network would be similar to the diesel refuelling network. As shown in Figure 2.2, convenient access to HRS has a significant effect on customers’ attitude towards FCEV.
Figure 2.2 Early adopter groups are willing to drive further to refuel their FCEV than late adopters and followers [1]
As a suitable HRS network is crucial, the UK H2 Mobility project states that it is important to consider the following issues:
Creating a network that delivers the best possible return on the up‐front investment.
This means that successful roll‐out of HRS network will need to cover the most populous areas in the UK and also key motorway and trunk routes. The development of this network should start from the outset as a “national” network of HRS, as this will enable both localised commuting, and weekday and weekend travel for the population, while crucially also providing for national travel for commercial vehicles.
Access to only one local HRS has been perceived as a significant inconvenience, which means that the successful HRS roll‐out will require at least two, and in some instances more, HRS per Local Authority District (LAD).
An initial network of stations is necessary to get the market started, and a key finding of the UK H2 Mobility project is that an optimised roll‐out strategy involves introducing FCEV and HRS first in selected localities, with an initial minimum network of 65 stations across the UK in the right locations. This network would cover major population centres, and connecting motorways and A roads to enable national mobility. It is based on having a minimum of two HRS per LAD in the targeted regions, with 8km between HRS and within a ten minute drive.
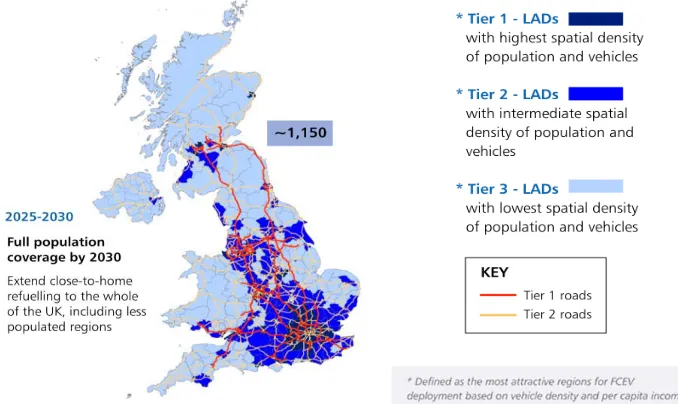
As shown in Figure 2.3, the model indicates a need for the HRS network to grow to 329 stations by 2025 (with the appearance of medium size HRS), and to further expand to 1,150 stations by 2030 (when all of the HRS are predicted to be of the medium or large size). This would mean that all of the UK’s population would have access to an HRS (defined as having at least one HRS in their LAD). The majority would have access to more than one station locally, as shown in Figure 2.4.
Figure 2.4 The development of local HRS network coverage in terms of the proportion of the UK vehicle fleet with
access to zero, one and two or more HRS in their local district
2.1.3
The
refuelling
network
map
With an estimated 51% of hydrogen being delivered by electrolysers, we can conclude that the roll‐out of HRS could have significant impact on the power system network, as the electrolysers connect to the network. Figure 2.5 indicates the expected density of FCEV and location of HRS in 2030, which can be used to evaluate effects of rollout of FCEV and HRS on electricity infrastructure.
Figure 2.5 HRS network in 2030
[image:11.595.133.472.415.617.2]3.
Understanding
the
impact
of
electrolysers
on
the
electrical
distribution
network
3.1
Method
to
evaluate
the
impact
of
HRS
roll
‐
out
One of the aims of modelling the impact of electrolysers is to study if the roll‐out of HRS and FCEV across the UK (as described in Chapter 2: Predicted roll‐out of electrolysers) will lead to additional requirements for network reinforcement.
The number of hydrogen FCEV has been estimated based on data published by the Office for National Statistics (ONS) [67], which summarises the number of vehicles available in each Local Authority District (LAD). It is estimated by UK H2Mobility report that there will be 1.6 million FCEV in the UK by 2030, with 51% of the hydrogen required produced by hydrogen electrolysers.
SSEN used this data to approximate the number of FCEV in each area by 2030. The analysis assumed that the 1.6 million FCEV would be distributed among LAD proportionally to the current car ownerships as per national statistics. The electrolyser connection requirements in a particular LAD can then be evaluated based on the estimated number of hydrogen vehicles and conclusions from the UK H2 Mobility report that successful HRS roll‐out requires at least two HRS per LAD.
The potential impact of electrolysers was modelled by the University of Strathclyde (UoS) by adding an adequate number of electrolysers in a distribution network, as described above. Connecting points of electrolysers, i.e. hydrogen refuelling stations, in each of the representative local networks were selected to ensure convenience for customers, and were therefore chosen where possible to be at an intersection of main roads, and close to population centres. Furthermore, 2030 levels of the electricity demand in the network were estimated based on the SSEN Long Term Development Strategy (LTDS).
As described above, the evaluation methodology used in this project consists of the following steps:
For the chosen LAD, determine the number of expected FCEV based on ONS data for car ownership.
Determine the total number of electrolyser units and their sizes to provide sufficient hydrogen supply for the estimated number of FCEV.
assumption provides a more critical case, but avoids potentially reducing the ability of the neighbouring LADs to supply FCEV on their territory.
Evaluate how connections of the HRS affect system operation and network capacity.
The method was applied to two types of distribution networks urban network and semi‐ urban/rural at two instants in time: current (2016 demand), and future 2030 demand. In addition, each scenario was modelled with distributed generation running at maximum output and at zero output. The impact of electrolysers on the network is analysed by evaluating power flows and the need for the network upgrades is indicated by overloads.
3.2
Method
to
evaluate
electrolyser
operation
for
different
objectives
and
constraints
3.2.1
Simulation
system
to
run
trials
While NREL tests [14] sought to evaluate physical characteristics of an electrolyser in the laboratory, and how quickly it could respond to variations in set‐points, this project evaluated how operation of an electrolyser can be managed in an operational setting.
This project aimed to explore and develop operational practices to evaluate how future implementation of new equipment will impact on the distribution system, and how this can be managed. Scottish and Southern Electricity Networks (SSEN) has previously implemented a number of Active Network Management (ANM) schemes, where the variable output of renewable (wind) generators is managed in real time to ensure that network capacity is not exceeded. Through this mechanism network assets can be utilised better, resulting in reduced spending on network reinforcement and quicker connections for generators. These trials explored how electrolysers producing hydrogen can be used to act as a flexible demand, thereby providing a service to the electrical network to manage capacity or participate in energy and ancillary services markets.
3.2.2
Simulation
set
‐
up
Evaluation of how the electrolyser can respond to various technical and commercial requests has been tested via a number of trials which have simulated instructions to change a set point. The aim was to evaluate how the electrolyser would follow such outside signals instructing it to change its set‐point, while also ensuring predefined hydrogen levels in the storage tanks would be met. The simulation control signals were determined using software supplied by SSEN and SGS, but the owner of the electrolyser (BOC) was able to override these simulation signals if it deemed that hydrogen targets would not be met, or if the level of hydrogen in storage went below pre‐specified limits.
Figure 3.1 Aberdeen Hydrogen Project Trial System (AHPTS) [image: Smarter Grid Solutions]
The AHPTS consists of three components:
The AHPTS‐Simulation System, (“sgs comms hub”) located at SSEN premises
The AHPTS‐Device Controller, (“sgs connect”) located at the Kittybrewster site with the Electrolyser
The AHPTS‐Trial Scheduler application (HMI). The AHPTS‐Trial Scheduler is a Windows application providing a user interface that allows authorised users to schedule Trials within the AHPTS. An operator can remotely login to the “sgs comms hub” to access the HMI.
The AHPTS‐Simulation System itself consists of:
The AHPTS‐Trial Engine which runs the Trials, using data collected by the AHPTS‐ Signal Handler and passing a set point to the electrolyser, via the AHPTS‐Signal Handler and AHPTS‐Device Controller.
[image:14.595.158.441.118.472.2]3.3
Trial
objectives
and
potential
value
3.3.1
Introduction
to
trials
The electrolyser is operated under scenarios defined by SSEN to reflect potential future scenarios for HRS operation in the UK. The scenarios include operating the electrolyser to satisfy network condition limitations, to minimise operation during network peaks, and to use renewable energy resources to power the electrolyser. All of the scenarios must ensure that there is sufficient hydrogen supply for the ten hydrogen fuel cell buses that are running daily and require refuelling.
3.3.2
Electrolyser
set
points
The site at Kittybrewster has three individual electrolyser units. In the rest of the report the term ‘electrolyser’ is used to describe a single entity with the maximum power consumption of all three units, (excluding compressors and other balance of plant equipment). Table 1 summarises the range of set points available to the AHPTS when different numbers of electrolyser units are available. The minimum set point is 13.33% of the full capacity value.
Table 1 Electrolyser set points
Number of electrolysers available Maximum set point Minimum set point
3 100% 13.33%
2 66.7% 13.33%
1 33.3% 13.33%
3.3.3
Time
of
Use
(ToU)
pricing
scheme
Under a Time of Use (ToU) energy price tariff, the energy price has different (pre‐determined) values at different time periods of the day. This pricing scheme is used to entice flexible demand to shift operation from peak to off‐peak hours. Typically, energy price during peak time periods will be higher while prices at night time will be lower.
For a number of trials, ToU was used as an incentive for the electrolyser to reduce its operational costs, while helping system operator reduce (or at least not significantly increase) the peak demand. The ToU pricing scheme used in AHP consists of four energy price bands: Red, Amber, Green, and Night. Red time period has the most expensive energy price, while Night has the least expensive value.
3.3.4
Scheduling
of
hydrogen
production
defined by each of the trial or by technical limitations of the electrolyser. If the trial schedule is unable to meet H2 demand during a trial the BOC system will take over control and revert to maximum production to ensure the bus demand is met; this may cause the HRS to operate during peak electricity hours and/or to breach a (simulated) demand constraint.
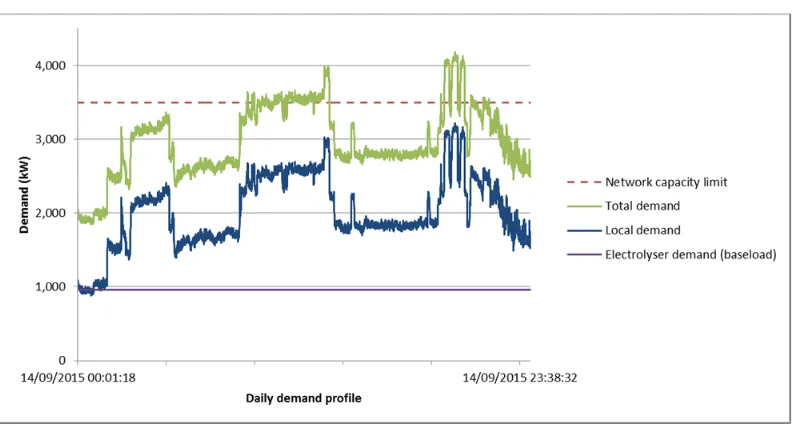
An example of a schedule to avoid breaching a demand constraint is shown in Figure 3.2.
Figure 3.2 Local demand and additional electrolyser demand could breach local network limit at some periods of
the day.
Flexibility provided by electrolysers that have storage capacity can allow the suspension or reduction of operation during peak periods. As shown in Figure 3.3, for the same daily demand profile the combined local and electrolyser demand can remain below the network capacity limit.
[image:16.595.89.491.201.414.2] [image:16.595.88.489.517.725.2]
3.4
Trial
types
The main constraints for each trial type are summarised in Table 2.
It is worth noting that the primary constraint on each trial was that the level of stored H2 at the end of the trial period should match a specified target value. As the buses were able to refuel at any point during the trial, the electrolyser set‐points were constantly re‐calculated throughout the trials to ensure this level could be met in the remaining trial time. Where buses refuelled towards the end of the trial the electrolysers would be set to run using maximum available power, even if this fell during a Red pricing period. This characteristic would not occur during normal operation of an electrolyser and is specific to the trials.
Table 2 Summary of objectives and constraints for the 12 project trials
Due to the similarity between trials 4/11 and trials 5/12, these have been grouped in the table
Trials Constraints Hydrogen Demand Renewables output Minimise Cost Network Constraint Local Demand Follow Gas Base load
Trial 1 Demand
management
network constraint
✔ ✔ ✔ ✔
Trial 2 Cheapest H2
✔ ✔
Trial 3
Gas flows ✔ ✔ ✔
Trial 4/11 Maximise net
wind/PV
✔ ✔
✔ ✔
Trial 5/12 Network
constraint wind/PV
✔ ✔
✔ ✔
Trial 6 Demand
management
network constraint
2
✔ ✔ ✔ ✔
Trial 7
Wind farm tracking ✔ ✔ ✔
Trial 8
Earliest wind ✔ ✔
Trial 9 Max Wind &
Fastest
✔ ✔
Trial 10
Trial 1 ‐ Demand management network constraint
During Trial 1, the electrolyser is simulated to be placed in part of an electrical network where there is a demand constraint. The electrolyser set point is calculated so that the ‘available power’ to the electrolyser is restricted by the constrained network power supply. The forecast constraint is an average hourly value, and is used to create a H2 production schedule to minimise cost, based on the TOU tariff.
Trial 2 ‐ Cheapest H2
Trial 2 schedules the electrolyser to minimise H2 production cost (based on the ToU tariff). There is no limit on the power that it can use for hydrogen production at any time period ‐ least cost of hydrogen production is the only aim of this trial.
Trial 3 ‐ Gas flows
During Trial 3, the production of H2 must match the demand from a gas injection point, which is variable throughout the day. The H2 production schedule is based on minimising H2 production cost based on the ToU tariff.
Trial 4 ‐ Maximise net wind
Trial 4 assumes that the available power to the electrolyser follows the output profile of a simulated wind farm with an associated local electrical demand. There is no wind forecast data for this trial. The power from the wind farm is used to fulfil the local demand, and any excess power from the wind farm (the ‘spill’) is used to operate the electrolyser. A baseload is in place to avoid cycling of the electrolyser if available power dips below the minimum required to operate. This means that even if there is no ‘spill’ power available the electrolyser will continue to produce hydrogen at a low rate.
Trial 5 ‐ Network constraint (wind)
Trial 5 assumes that the available power to the electrolyser follows the output profile of a simulated wind farm where there is a local generation constraint. Hence, there will be times when the wind farm is unable to operate at full capacity. During Trial 5, the electrolyser will be run at times when the wind farm would normally be constrained in order to take up the excess capacity from the wind farm. If the excess capacity falls below a set base load value then the electrolyser will continue to operate at the base load level.
Trial 6 ‐ Demand management network constraint 2
Trial 6 is similar to Trial 1, where the operation of the electrolyser is based on a locally constrained power supply. The electrolyser set point is calculated so that the ‘available power’ to the electrolyser is restricted by the constrained network power supply. The forecast constraint is a maximum hourly value (rather than average), and is used to create a H2 production schedule to minimise cost, based on the TOU tariff.
Trial 7 ‐ Wind farm tracking
Trial 8 ‐ Earliest wind
During Trial 8, the electrolyser is run at full capacity until the predicted output from the forecast wind generation is sufficient to generate the remainder of the required H2.
Trial 9 ‐ Max wind & fastest
During Trial 9, the electrolyser is scheduled to run at full available power capacity only during the forecast periods of maximum wind generation.
Trial 10 ‐ Off peak & wind
For Trial 10, the electrolyser runs at full capacity during off peak hours (i.e. Green pricing). During peak hours (Red and Amber price bands), the electrolyser is powered solely by the wind farm. There is no forecast data.
Trial 11 ‐ Maximise net PV
Trial 11 is the same as Trial 4, except it uses power from a PV solar farm rather than a wind farm.
Trial 12 ‐ Network constraint PV
Trial 12 is the same as Trial 5, except it uses power from a PV solar farm rather than a wind farm.
3.4.1
Trial
Benefits
A number of the trials were designed to help increase utilisation of renewable generation such as wind and PV. For example, the electrolyser can consume excessive renewable power to avoid wind/PV curtailments. As Figure 3.4 illustrates, the UK made constraint payments of £170k in 2010. The trend of increasing renewable generation curtailment and constraint payments led to 877GWh of energy curtailed in 2015, with associated curtailment payments of £90.5 million [69]. Electrolysers could be used to increase demand during periods of high renewable generation so that these payments could be reduced.
Trials 1, 2 and 6 all seek to minimise the cost of running the electrolyser, so they benefit the electrolyser owner by lowering the overall cost of operation, and the end‐user who will pay less for the product. Trials 1 and 6 also schedule the electrolyser under a demand constrained network and thus may enable deferral or avoidance of network reinforcement.
Figure 3.4 Constraint Payments UK [69]
The remaining trial types are linked to renewable resources and could result in benefits including a reduction in constraint payments, avoidance of network reinforcement and faster connection for generation customers, improved use of network assets (allowing higher utilisation during periods of low demand/high renewable generation) which can reduce overall network charges to all customers.
3.4.2
Trial
execution
The 12 Trials were conducted over an eight‐month period, and aimed to understand the impact on DNOs if the roll‐out of this technology becomes more widespread.
Within each of the trials the operation of the electrolyser is given via the calculation of set points.
Depending on the trial, network capacity, real‐time data from a local demand, a gas injection supply point, historic wind farm and PV data are used as inputs for scheduling purposes. In addition, Time of Use (ToU) pricing is applied to several trials where a commercial aspect is considered.
The amount of hydrogen stored is monitored during the scheduling process in order to ensure the hydrogen supply is adequate. If the level of hydrogen goes below a predefined lower level, the BOC control system overrides any trial in progress to implement maximum hydrogen production. This procedure is terminated once the hydrogen storage reaches a predefined upper level.
[image:21.595.106.488.110.334.2] Trial control time greater than 10% of the total trial duration. This is the time where an override is not in place due to low H2 storage levels, so the trial is being controlled by SSEN.
The amount of hydrogen generated during the trial is greater than 5kg. This removes any trials where, due to limited demand from the buses, there was minimal requirement to actually run the electrolyser.
The number of successful and unsuccessful instances for each of the 12 Trials is shown in Figure 3.5. At the beginning of the project we experienced a relatively high number of unsuccessful trials as we developed our understanding of the impact of bus fills on the control strategy.
Figure 3.5 Number of trials completed by trial type and success
3.4.3
Weekly
data
analysis
Figure 3.6 summarizes the amount of hydrogen generated in each calendar week for a period of 2015 and 2016 and Figure 3.7 shows the number of buses refilled during the same period. As expected the amount of hydrogen produced mirrors the demand of the buses.
The average hydrogen generated during the successful trials was around 740kg for one calendar week. The lowest hydrogen generation in one week was 115kg, while hydrogen production was above 1000kg during other weeks; this is directly linked to the amount of hydrogen required by the fuel cell buses running daily in Aberdeen area. Discrepancies in the amount of hydrogen produced do occur where we have experienced unsuccessful trials during the week, where hydrogen was produced under control of BOC.
Figure 3.6 Summary of hydrogen generated by calendar weeks
Figure 3.7 Summary of number of buses refilled by calendar weeks
The efficiency indicates how much energy has been used to produce one kilogram of hydrogen. This is shown in Figure 3.8 for each trial type. The average efficiency across all trials (following removal of outliers) was found to be 69.3kWh/kg.
3.4.4
Utilisation
The utilization indicates the percentage of time that hydrogen production is controlled by the scheduler compared to the total trial time period. The average utilisation of all the successful trials is around 41%. The utilisation reflects the total time where the electrolyser was producing hydrogen under control by SSEN. A low utilisation figure reflects trials where hydrogen production is low (due to low demand or unsuitable conditions), or where hydrogen storage has dropped below a pre‐set level leading to an override of the system by BOC.
Trials with a utilisation figure less than 10% are deemed ‘unsuccessful’.
3.4.5
Variance
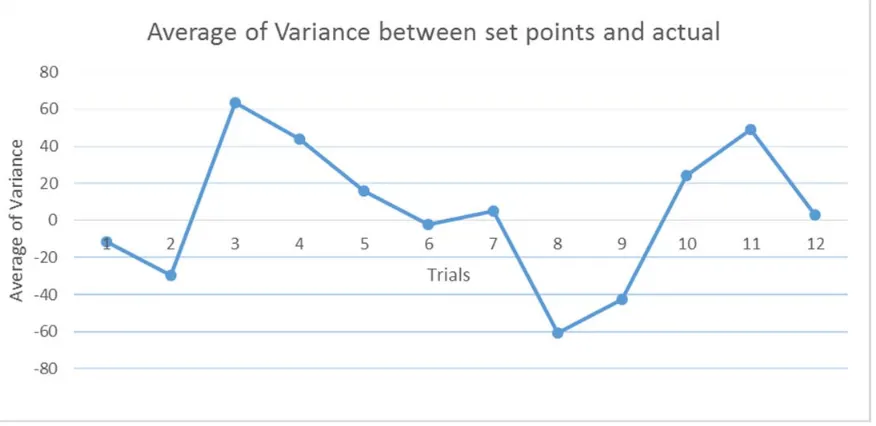
The average variance between the set point issued to the electrolyser and the actual power consumed by the electrolyser is summarized Figure 3.9. The difference between the set point issued and the actual measured power is mainly caused by the power consumed by compressors and other circuit components linked with the electrolyser. Moreover, a large variance can be caused by the BOC automated override, which ignores system set‐points when the hydrogen levels fall below a set level. Also, for those trials which have no baseload level configured to prevent electrolyser cycling, the measured power finds it hard to follow frequent on/off of set points in a cycling period, and this can also lead to variance between the set point and actual power.
Figure 3.9 Summary of average of variance between set points and actual by trials
3.5
Trial
results
[image:24.595.89.527.441.654.2]
is to study the potential effect that the increasing number of hydrogen refuelling stations will bring. Through analysing the behaviour of the electrolyser under different trials, the trial results will help DNOs with future planning and operating issues that they may face.
In the following analysis trials are divided into three categories depending on the operational scenarios, and are evaluated on the basis of the objectives and constraints involved in each category. Typical trial results are presented and reviewed to illustrate certain behaviours of the electrolyser, and certain control aspects regarding the performance of the electrolyser.
3.5.1
Trials
evaluating
Network
Management
objectives
With growing demand and roll out of electrolysers in the near future, it can be expected that network capacity will be exceeded in certain areas. One category of the trials tested the operation of electrolysers in a constrained network. This was to evaluate if they can be operated to avoid triggering network reinforcement. The following trials fall into this category: Trial 1 (Demand Management Network Constraint), Trial 5/12 (Network Constraint Wind/PV), and Trial 6 (Demand Management Network Constraint 2).
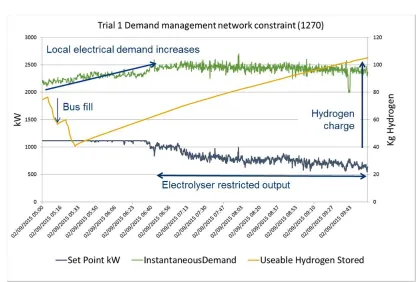
Figure 3.10 shows an extract of results for one successful run of Trial 1. During this trial the electrolyser is simulated to be placed in part of an electrical network which is demand constrained. The electrolyser set point is calculated so that the ‘available power’ to the electrolyser is restricted based on local demand. The forecast constraint is an average hourly value, and is used to create a H2 production schedule to minimise cost, based on the TOU tariff.
Figure 3.10 Scheduling results for Trial 1 (ID 1270)
3.5.2
Assessing
responsiveness
and
controllability
of
the
electrolyser
during
the
trials
Electrolysers, in addition to generating hydrogen, have the potential to provide support to the electrical power systems sector by modulating their electricity consumption profile [12]. Alkaline electrolysers can change their electricity consumption in the range 15–120% of their nominal power within one second [58]. This feature makes them attractive for coupling with wind turbines. In addition, electrolysers available now in the market have the ability to provide fast response and thus can be used to maintain network frequency within operational limits by altering their consumed power as a function of the network frequency [59], [60], and [61]. A test performed on an alkaline electrolyser with rated power of 40kW shows that alkaline electrolysers can provide a fast response by increasing or decreasing load in just 0.2 seconds following a set‐point change. The test results also show that the electrolyser starts to respond to the received set‐point in less than 24.3 milliseconds [55].
[image:26.595.81.499.105.387.2]3.5.3
Controllability
of
the
electrolyser
during
the
trials
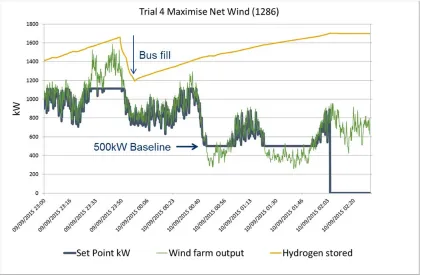
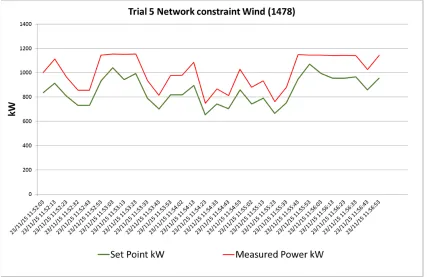
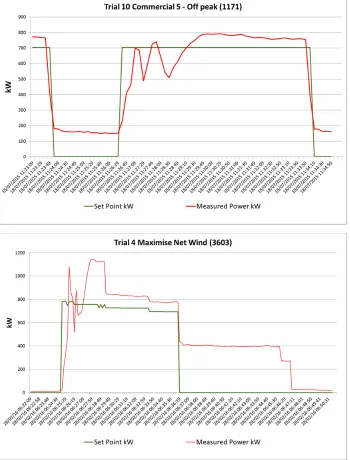
A number of trials have shown that the electrolyser can be controlled effectively through set points even where these follow an erratic profile such as that of a windfarm output. Figure 3.11 shows an example of results of a trial 4 – Maximise net wind. During this trial, power from the wind farm is used to fulfil the local demand, and any excess power from the wind farm (the ‘spill’) is used to operate the electrolyser. A baseload is in place to avoid cycling of the electrolyser if available power dips below the minimum required to operate. This means that even if there is no ‘spill’ power available the electrolyser will continue to produce hydrogen at a low rate. It is clear from the figure that the electrolyser is acting as responsive load as it starts consuming the additional power generated by the wind farm.
Figure 3.11 Results of Trial 5 network constraint wind (1478)
3.5.4
Additional
power
consumption
[image:27.595.88.509.280.556.2]
production and storage process which add to the difference in measured power versus set‐ point.
3.5.5
Responsiveness
of
the
electrolyser
during
the
trials
As the previous results show that the electrolyser load can be successfully controlled, the time taken by the electrolyser to start changing its load following a set‐point change is very important factor. Figure 3.12 shows the electrolyser response time to rapid load variations. It is clear that the electrolyser responds to the set‐point change within several seconds.
Figure 3.12 Response of the electrolyser to rapid load variations
[image:28.595.87.514.271.548.2]
Figure 3.13 Response of the electrolyser to a step change in set‐point
[image:29.595.140.490.122.582.2]
storage. In Trial 3603 the measured power remains at 400kW for ten minutes after the set‐ point change, probably due to the operation of the compressors.
Although the ramp‐down is leaner, the overall response time is slow in comparison to the 0.2 seconds response time cited from trials of a smaller alkaline electrolyser with a rated power of 40kW [55]. The slow response of some trials can prevent the electrolyser from participation in certain applications such as dynamic frequency response.
Most of the trials show that the electrolyser has a good initial response, and the set‐point is achieved quickly. Most of the trials with power variations caused by network limitations and the utilization of renewables have successfully accommodated the power fluctuations. Thus, electrolysers can be a valuable asset in the integration of intermittent generation from renewable sources. To assess the electrolyser response time in greater detail, a measurement step‐time of one second or less would be essential, as the electrolyser response time is within this time frame.
[image:30.595.125.479.413.662.2]The conclusion that can be drawn from the current ten seconds time‐step is that the electrolyser has the ability to respond to the predefined set‐points within this time. For regulation markets requiring a response time on the order of minutes the electrolyser can respond quickly enough to participate in regulation markets while producing hydrogen – see Figure 3.14 for typical ancillary services requirements.
Figure 3.14 Response time and duration of different ancillary services [62].
3.6
Power
Quality
of
the
electrolyser
during
the
trials
3.6.1
Voltage
Distribution Electrical Network Operators are required to manage and control the voltage on the electrical network. Voltage is carefully managed by tap changers on transformers at the substations. Therefore any new load or generation added to the network may adversely affect the voltage. In order to ensure that the voltage remain with limits the DNO may need to re design the electricity network. This may involve installing new substations, new lines and cables, or the changing of equipment in existing substations. This can be a costly exercise.
[image:31.595.128.471.421.671.2]During the course of this project SSEN installed additional monitoring equipment to the network to monitor the effects of the electrolyser on the primary substation.
Figure 3.15 below shows the stepped voltage changes before the installation of the electrolyser and during Trials 1, 3 and 4.
The electrolyser is installed on the 11kV network. An increase in the number of step changes above 1% (0.11kV) would be considered detrimental; it should be noted that the small spike in changes around 0.5% and 0.6% are likely to be due to the operation of the tap changer at the 33/11kV substation to restore the voltage to its target level.
Figure 3.15: Voltage change and number of changes on the 11kV network (*measured over a three hour period at
similar times of day)
The graph shows that the installation of the electrolyser has not had a detrimental impact on the network during the trials as there has not been any significant increase in the number of voltage changes. In addition there is no significant difference in the profiles between the three selected trials.
3.6.2
Power
Factor
The power factor has been plotted against the load at the primary substation prior to the electrolyser and for the above trials in Figure 3.16.
Figure 3.16 Load affecting Power factor measured at the primary substation
[image:32.595.90.534.246.518.2]
Figure 3.16 shows a clear correlation between load increase and a decrease in power factor. Consumers are penalised for increasing the MVA and reducing the power factor.
Measurements for the same period were also taken at the primary substation for the previous year prior to its installation.
This confirms that the increased load at the electrolyser site has decreased the power factor on the network and that this has been carried through to the primary substation.
The electrolyser site already has power factor correction equipment with 6 x 100kVAR and 6 x 50kVAR stages built in. Further analysis was undertaken to ascertain the added levels of power correction required in order to maintain a 0.95 power factor at the electrolyser site, which demonstrated that a further 200kVAR would be required.
An increase in reactive power on a network is not necessarily a bad thing and if electrolyser were placed on parts of the network where there was wind generation this reactive power
y = ‐7.64907713E‐05x + 9.94416943E‐01
0.9 0.91 0.92 0.93 0.94 0.95 0.96 0.97 0.98 0.99 1
0 500 1,000 1,500 2,000 2,500 3,000 3,500
Po
we
r
Fa
ct
or
kW
3.7
Impact
of
HRS
on
the
Aberdeen
Network
The methodology for evaluating the impact of the HRS roll‐out on the network, presented in Section 3.1 of this report, is now used to assess effects on the Aberdeen Network, where the electrolyser is connected for the AHP project. It is estimated there will be 7,317 FCEV cars in Aberdeen Local Authority Area.
To support this number of FCEV, the electrolyser connection requirement is 8.5MVA.
3.7.1
Connection
Points
Based on methods described above it is assumed that there will be four HRS connected at Bridge of Don, St Machar, Haudagain and Stoneywood, as illustrated in Figure 3.17, belonging to the Persley Network.
The Persley network has connections of both distributed generation (DG) and a number of loads. Modelling was undertaken for a case with DG at both maximum and at zero output levels.
Results of the network analysis given in Table 8 showed that two transformers would be overloaded in 2029/30, however this overload would be caused by a forecast increase in general demand, and not solely due to HRS connections.
Table 3 summarizes the potential size and location of the assumed four HRS stations.
Table 3 Summary of Hydrogen Refuelling Station Potential Connection Points in Aberdeen
Station Type Connection Substation Circuit kV
1 4 x Hystat60 2 MVA Bridge of Don 33/11
2 4 x Hystat60 2 MVA St Machar 33/11
3 4 x Hystat60 2 MVA Haudagain 33/11
4 5 x Hystat60 2.5 MVA Stoneywood 33/11
Figure 3.17 Potential Electrolyser Connection Points for Aberdeen City area
Table 4 Case Studies Results for Transformers in 2029/30 Persley Network
Transfo
rmers
Base Case Stoneywood Bridge of Don St Machar Haudagain Stoneywood +Bridge
of Don+ St
Machar+Haudagain
DG@
max DG@ 0 DG@ max DG@ 0 DG@ max DG@ 0 DG@ max DG@ 0 DG@ max DG@ 0 DG@ max DG@0
T1 54.2% 54.2% 58.3% 58.3% 54.2% 54.2% 54.2% 54.2% 54.2% 54.2% 54.2% 54.2%
T2 50.2% 50.2% 54.3% 54.3% 50.2% 50.2% 50.2% 50.2% 50.2% 50.2% 50.2% 50.2%
T3 25.0% 33.3% 25.0% 33.3% 29.2% 37.5% 25.0% 33.3% 25.0% 33.3% 25.0% 33.3%
T4 25.0% 33.3% 25.0% 33.3% 29.2% 37.5% 25.0% 33.3% 25.0% 33.3% 25.0% 33.3%
T5 146.8 % 146.8 % 146.8 % 146.8 % 146.8 % 146.8 % 146.8 % 146.8 % 146.8 % 146.8 %
146.8% 146.8%
T6 146.8 % 146.8 % 146.8 % 146.8 % 146.8 % 146.8 % 146.8 % 146.8 % 146.8 % 146.8 %
146.8% 146.8%
T7 41.7% 45.8% 41.7% 45.8% 41.7% 45.8% 45.8% 50.0% 41.7% 45.8% 41.7% 45.8%
T8 41.7% 45.8% 41.7% 45.8% 41.7% 45.8% 45.8% 50.0% 41.7% 45.8% 41.7% 45.8%
[image:35.595.155.438.118.462.2] [image:35.595.82.526.520.770.2]4.
Modelling
the
Aberdeen
hydrogen
refuelling
station
4.1
Overview
This report looks at the main components of the Aberdeen filling station (storage, electrolyser and compressor) and comprises two main parts. The first looks at the use of the hydrogen system as it is currently configured using basic state equations to investigate the characteristics of on board and on site hydrogen storage charging and discharging. The second part looks at how the operation of the filling station system using modelling and simulation, with an attempt to optimise the size of the filling station against different hydrogen demands and operating strategies.
4.2
Initial
characterisation
of
storage
charge/discharge
Spreadsheet models of the hydrogen storage, and bus fuel tank were developed. These made use of the “REFPROP” excel library extension from the US National Institute for Standards and Technology [70], which enables the properties of a gas at any pressure or temperature to be determined from an extensive empirical database. For hydrogen, this is preferable to using an idea gas model, as at high pressures and low temperatures hydrogen ceases to behave as an ideal gas.
4.2.1
Bus
fuel
tank
The bus fuel tank holds approximately 50kg of hydrogen at 15°C and 350bar [71]; this indicates an on board storage volume of roughly 2m3. A typical bus fill is around 30kg, so there is a residual 20kg of hydrogen remaining prior to a hydrogen fill.
Figure 4.1 shows the variation and pressure for a 30kg charge, starting from 20kg of residual hydrogen. This assumes that the incoming hydrogen is at 15°C and that the on‐board hydrogen is at the same temperature.
Figure 4.1 Variation in bus fuel tank pressure during an isothermal fill.
The tank pressure at the beginning of the fill is approximately 200bar, rising to 350bar at the end of the fill. Note that if the fuel is pre‐cooled, then a greater mass of hydrogen could be stored on board. For example, if the incoming fuel is cooled to ‐40oC, then an additional 4kg of H2 could be added before the 350bar limit was reached (Figure 4.2), increasing the range of the bus between fills. The Linde website indicates that the H2 leaving the IC90 compressor is cooled to ‐40oC [77]. However, the hydrogen leaving the compressor at the Aberdeen site is only cooled to 10oC [75]. Hydrogen heats as it expands (owing to its negative Joule‐Thomson coefficient above 200K), so the temperature in the tank will be higher than 10oC.
[image:37.595.69.513.94.307.2]
4.2.2
Storage
The onsite storage comprises 120 cylinders that can hold approximately 400kg of hydrogen at 15°C. The store is divided into three banks all of which are charged to 500bar. As a pressure difference is required to push H2 into the bus tank, then at least one of the storage banks must at a pressure above 400bar for the bus fuel tank to be fully filled. Figure 4.3 shows the variation in pressure of the storage tank as it discharges.
Figure 4.3 Variation in stored H2 mass and pressure in a single storage bank.
Assuming that the hydrogen is in equilibrium with surroundings (approx. 10°C), then the maximum pressure for the store is approximately 530bar. According to BOC the ‘high’ storage bank is discharged until it drops to 400bar, while the pressure can drop to 200bar in the other banks. This gives a usable mass of approximately 150kg of hydrogen for the three banks.
4.2.3
Compressor
The Linde IC 90 compressor takes gas at a maximum pressure of 30bar and compresses it to 500bar using multiple piston stages. The maximum stated operating pressure is 1,000bar and the maximum delivered flow rate is 33.6/67.2kg/h for single or double line units. The nominal power consumption is 2.7kWh/kg, corresponding to a power demand of 90/180kW. The hydrogen is cooled to 10oC after compression.
4.2.4
Electrolyser
[image:38.595.95.493.224.471.2]
demand at this rate of production is stated as 312kW. Measurements by SSEN indicate that the power consumption including balance of plant is closer to 374kW. Based on the storage analysis, the three electrolysers would need to run at full capacity for approximately nine hours to replenish the onsite storage (150kg).
4.3
Simulation
model
A simulation model of the Aberdeen filling station model has been developed using the TRNSYS systems simulation tool. The theoretical basis for both TRNSYS and its hydrogen component models can be found in TRNSYS [80] and Ulleberg [79] respectively. TRNSYS has been used extensively in the modelling of H2 demonstration projects including the Utsira standalone H2 system, the Reykjavik filling station and Pacific spirit filling station in Vancouver [78].
TRNSYS is a systems modelling and simulation tool, where a system is described using a connected network of connected components. Each component is essentially a mathematical model that calculates an output state or states based on one or more inputs. TRNSYS solves the resulting coupled set of equations, with boundary conditions (e.g. climate) and control constraints allow the evolving state of the system with time to be determined.
The TRNSYS model of the Aberdeen HRS is shown in Figure 4.4. This includes the key components of the electrolysers, compressor, storage banks, and charge/storage controllers.
Figure 4.4 TRNSYS model of the AHP station
The main components of the TRNSYS model are as follows:
4.3.1
Master
controller
The maximum power given to the electrolysers when they are producing hydrogen has been taken from monitored data at 374kW per electrolyser; this figure includes the power draws for balance of plant, but not the demand from the compressors. The minimum power provided to the electrolysers when they are in stand‐by is 120kW per electrolyser.
The maximum pressure level allowed in the compressed storage tanks has been set at 550bar. The nominal operating pressure is 500bar.
Following a site visit to the filling station and analysis of the monitored data, the minimum pressure level allowed inside the medium and low storage tanks, has been set to 200bar. If the pressure of the stored hydrogen drops below 400bar in the high tank the pressure level inside all of the storage tanks is recovered to 500bar by starting the production of hydrogen in the electrolysers and the compressor.
4.3.2
Electrolysers
Three identical electrolyser models are used. The important model parameters include the area of the electrode; the number of cells; the number of stacks per electrolyser the operating temperature (75oC) and pressure.
The number of stacks and the electrolyser pressure has been taken from the Hydrogenics specifications as four stacks and 10bar. The cell area was estimated as 1.0m2, while the electrolyser temperature has been assumed constant and equal to 75oC. The maximum hydrogen production rate is 120kg/day.
4.3.3
Compressor
The component used represents a 5‐stage poly‐tropic compressor. It compresses the hydrogen produced by the three electrolysers from 10bar to 500bar and fills the three compressed storage tanks according to the control law established in storage controller.
4.3.4
Storage
controller
This determines the proportions of produced hydrogen filling the three compressed storage tanks. Currently the filling is performed so that the pressure levels inside the different tanks increase at the same rate once the minimum pressure has been reached in the “high” pressure storage bank. This component also measures the maximum pressure level in the three tanks and passes this to the master controller, so that if the storage pressure level in the high bank drop below the 400bar, an automated, unscheduled re‐charging fill is triggered.
4.3.5
Storage
tanks
4.4
Optimisation
studies
A series of optimisations were undertaken with the TRNSYS model, looking at the size of storage and number of electrolysers required to supply different daily volumes of hydrogen, minimising an indicative ten‐year cost for the filling station.
A link between the TRNSYS simulation environment and the optimisation tool GENOPT has been included in the model, in order to perform optimisation analysis, particularly in relation to component sizes and capacities. The operation of the tools is shown in Figure 4.5.
Figure 4.5 Operation of the TRNSYS and GENOPT tool
4.4.1
Cost
function
The filling station system was optimised against an indicative ten‐year cost, which included the cost for the electrolysers, compressors and storage, along with running costs for the electrolysers and compressors. In this instance optimisation implies sizing the number of electrolysers, compressors and size of storage for minimum running costs against a fixed hydrogen demand profile.
520 (1)
is the indicative ten‐year station cost, which includes capital and running costs; is the electrolyser unit cost and is the number of electrolysers; is the storage unit cost and b is the storage volume; is the compressor unit cost; and is an automated, unscheduled re‐ charging fill cost penalty and is the number of automated, unscheduled re‐charging fills, is an unused storage penalty, V is any unused storage volume. Running costs include , the electrolyser time‐varying electricity price and the compressor time varying electricity price. is a fixed weekly capacity charge, related to the size of the filling station supply – in the simulations, this was taken as the installed capacity of the electrolysers.
![Figure 3.1 Aberdeen Hydrogen Project Trial System (AHPTS) [image: Smarter Grid Solutions]](https://thumb-us.123doks.com/thumbv2/123dok_us/1504725.103159/14.595.158.441.118.472/figure-aberdeen-hydrogen-project-trial-system-smarter-solutions.webp)
![Figure 3.4 Constraint Payments UK [69]](https://thumb-us.123doks.com/thumbv2/123dok_us/1504725.103159/21.595.106.488.110.334/figure-constraint-payments-uk.webp)