City, University of London Institutional Repository
Citation
:
Omidyeganeh, M. & Piomelli, U. (2013). Large-eddy simulation of
three-dimensional dunes in a steady, unidirectional flow. Part 2. Flow structures. Journal of Fluid
Mechanics, 734, pp. 509-534. doi: 10.1017/jfm.2013.499
This is the accepted version of the paper.
This version of the publication may differ from the final published
version.
Permanent repository link: http://openaccess.city.ac.uk/6947/
Link to published version
:
http://dx.doi.org/10.1017/jfm.2013.499
Copyright and reuse:
City Research Online aims to make research
outputs of City, University of London available to a wider audience.
Copyright and Moral Rights remain with the author(s) and/or copyright
holders. URLs from City Research Online may be freely distributed and
linked to.
City Research Online:
http://openaccess.city.ac.uk/
[email protected]
Large-eddy simulation of three-dimensional
dunes in a steady, unidirectional flow.
Part 2: Flow structures.
Mohammad Omidyeganeh and Ugo Piomelli
Department of Mechanical and Materials Engineering, Queen’s University, Kingston (Ontario) K7L 4L9, Canada
(Received 13 September 2013)
We performed large-eddy simulations of the flow over a series of three-dimensional (3D) dunes at laboratory scale. The bedform three-dimensionality was imposed by shifting a standard two-dimensional (2D) dune shape in the streamwise direction according to a sine wave. The turbulence statistics were discussed in Part 1 of this article [M. Omidyeganeh, U. Piomelli,J. Fluid Mech.721, pp. 454–483, (2013)]. Coherent flow structures and their statistics are discussed concentrating on two cases with the same crestline amplitudes and wavelengths but di↵erent crestline alignments: in-phase and staggered. The present paper shows that the induced large-scale mean streamwise vortices are the primary factor that alters the features of the instantaneous flow structures. Wall turbulence is insensitive to the crestline alignment; alternating high- and low-speed streaks appear in the internal boundary layer developing on the stoss side, whereas over the node plane (the plane normal to the spanwise direction at the node of the crestline), they are inclined towards the lobe plane (the plane normal to the spanwise direction at the most downstream point of the crestline) due to the mean spanwise pressure gradient. Spanwise vortices (rollers) generated by Kelvin-Helmholtz instability in the separated shear-layer appear regularly over the lobe with much larger length scale than those over the saddle (the plane normal to the spanwise direction at the most upstream point of the crestline). Rollers over the lobe may extend to the saddle plane and a↵ect the reattachment features; their shedding is more frequent than in 2D geometries. Vortices shed from the separated shear-layer in the lobe plane undergo a three-dimensional instability while advected downstream, and rise toward the free surface. They develop into a horseshoe shape (similar to the 2D case) and a↵ect the whole channel depth, whereas those generated near the saddle are advected downstream and toward the bed. When the tip of such a horseshoe reaches the free surface, the ejection of flow at the surface causes “boils” (upwelling events on the surface). Strong boil events are observed on the surface of the lobe planes of 3D dunes more frequently than in the saddle planes. They also appear more frequently than in the corresponding 2D geometry. The crestline alignment of the dune alters the dynamics of the flow structures, in that they appear in the lobe plane and are advected towards the saddle plane of the next dune, where they are dissipated. Boil events occur at a higher frequency in the staggered alignment, but with less intensity than in the in-phase alignment.
1. Introduction
two-dimensional transverse dunes (in which the crestline is straight and normal to the flow) regularly exist in pure oscillatory flows (Allen 1968), they appear occasionally in unidirectional flows in rivers and laboratory flumes for a short period of time (Venditti
et al. 2005); most dunes generated in unidirectional flows have sinusoidal or irregular crestlines (Ashley 1990). The flow separates at the crest and reattaches at the beginning of the stoss side (Kostaschuk 2000). Note that in large sand-bed alluvial channels dunes may possess low-angle lee side and intermittent separation of the flow at the crest (Roden 1998; Best & Kostaschuk 2002); here we study typical dune models with an angle of repose slip face where the flow permanently separates at the crest (Roden 1998; Kostaschuk 2000). In the first part of this paper (Omidyeganeh & Piomelli 2013), the past research on two- and three-dimensional dunes was reviewed, and thus here we limit ourselves to a brief summary.
The main features of the flow over dunes are flow separation at the crest and the re-sulting separated shear-layer, the recirculation region, and the downstream developing internal boundary layer. Each of these generates a variety of coherent structures with a broad range of length- and time-scales. Detailed investigation of the turbulent structures has revealed the importance of Kelvin-Helmholtz instability of the shear layer, which causes large-scale eddies (with length-scales comparable to the river depth; Kostaschuk & Church (1993); Bennett & Best (1995); Omidyeganeh & Piomelli (2011)). Very large structures contribute significantly to the transport of mass and momentum (Babakai↵& Hickin 1996; Lapointe 1996; Best et al.2001). Correlations between the ejection events over the lee side of dunes and suspended sediments, measured in the experiments (La-pointe 1996; Schmeeckle et al. 1999; Shugar et al. 2010), showed the contribution of separated vortices to the sediment transport. Lapointe (1996) showed that most of the sediment suspensions in rivers are due to turbulent ejection events.
These large eddies are often associated with “boils”, i.e., upwellings at the water sur-face that occur when a horizontally oriented vortex reaches the sursur-face (Matthes 1947). Various conjectures were advanced to explain their occurrence (Jackson 1976; M¨uller & Gyr 1986; Nezu & Nakagawa 1993; Kadota & Nezu 1999; Best 2005a); Omidyeganeh & Piomelli (2011) confirmed the conjectures by M¨uller & Gyr (1986) and Best (2005a) and showed that they are due to horseshoe vortices of size comparable to the flow depth originating in the separated-shear layer.
1987)). Characteristics of the secondary currents and their impact on the channel re-sistance, water surface response, and turbulence statistics were investigated by Maddux
et al.(2003b,a) for crestlines that are staggered (i.e., each lobe is followed by a saddle, and vice-versa), and by Venditti (2007) for in-phase crestlines.
Omidyeganeh & Piomelli (2013) compared in-phase and staggered alignments, and also considered di↵erent amplitudes and wavelengths of the crestlines. They studied the sensitivity of the flow field to the crestline parameters (deformation amplitude, wave-length, and alignment) by performing a numerical study of 3D dunes created by shifting a standard 2D dune shape (Omidyeganeh & Piomelli 2011) in the streamwise direction according to a sine wave. The statistics of the flow were discussed. The three-dimensional flow separation at the crestline was found to alter the distribution of wall pressure; near the bed, fluid is directed from the saddle toward the lobe and near the flow surface the direction of flow is reversed. This results in the counter-rotating streamwise vor-tices straddling the lobe plane. These features of the mean flow are shown in Figure 2 and are discussed briefly in Results. For crest wavelengths smaller than the flow depth, however, the secondary flow exists only near the bed and the mean flow away from the bed resembles the two-dimensional case. Staggering the crestlines alters the secondary motion; the fastest flow occurs between the lobe and the saddle planes, and two pairs of streamwise vortices appear (a strong one, centred about the lobe, and a weaker one, coming from the previous dune, centred around the saddle). The sensitivity of the aver-age reattachment length, which depends on the induced secondary flow, the streamwise and spanwise components of the channel resistance (the skin friction and the form drag), and the contribution of the form drag to the total resistance were also studied: the three-dimensionality of the bed increases the drag in the channel; the form drag contributes more than in the two-dimensional case to the resistance, except for the staggered-crest case. Turbulent-kinetic energy is increased in the separated-shear layer by the introduc-tion of three-dimensionality. The upward flow on the stoss side and higher deceleraintroduc-tion of flow on the lee side over the lobe plane lift and broaden the separated shear-layer, respectively, a↵ecting the turbulent kinetic energy.
Turbulent structures are responsible for sediment transport over bedforms (Lapointe 1996; Schindler & Robert 2005); their importance in an open channel flows with smooth and rough beds on the sediment transport mechanism has been discussed in the literature (Sutherland 1967; Jackson 1976; Best 1992; Kaftoriet al.1995a,b; Nino & Garcia 1996). Ejections may persist for a long time and lift up the sediment. If the wall-shear stress increases, more particles are entrained in the outer region of the flow, especially over rough beds (Nino & Garcia 1996). The inrush of high-momentum fluid into the bed (sweep events) coalescing with surrounding events, on the other hand, may cause a small defect on the bed (Best 1992) and grow to a large-scale deformation. Despite the importance of wall-turbulence and of sweeps and ejections near the bed, and their impact on the bed deformation, their dynamics have not yet been studied in depth.
The field observations of Parsons et al. (2005) highlight the importance of 3D bed-forms for flow structures and sediment transport; secondary flows over saddle- or lobe-shaped crestlines were observed to direct the downstream bed morphology and sediment-suspension mechanism in the flow. Moreover, the distribution of coherent structures in the bulk flow, especially horseshoe vortical structures that interact with the free surface and cause strong boil events and their statistics have to be studied.
must be studied to explore the morphology mechanics and channel resistance in rivers, and to understand bed deformation mechanism (Best 2005a). In the first part of this article (Omidyeganeh & Piomelli 2013), we performed a controlled investigation of simple sinusoidal crestline deformations and analyzed the e↵ect of geometrical parameters of the crestline on the mean-flow characteristics. Here, in the second article, we study the e↵ect of the three-dimensionality on the turbulent structures near the bed, in the separated-shear layer, and in the bulk flow. The present qualitative and quantitative analysis on these coherent structures will provide insights on the boil events at the free surface.
In the following, we begin by reviewing the numerical model. We then present vi-sualizations and statistical measures of turbulent eddies, first in the near-wall region, then in the separated shear layer. A discussion of the e↵ects of crestline deformation on the generation of boils will follow. Finally, we will draw some conclusions and make recommendations for future work.
2. Problem formulation
In large-eddy simulations, the velocity field is separated into a resolved (large-scale) and a subgrid (small-scale) field, by a spatial filtering operation (Leonard 1974). The non-dimensional continuity and Navier-Stokes equations for the resolved velocity field are
@ui
@xi
= 0 (2.1)
@ui
@t +
@uiuj
@xj
= @P
@xi
@⌧ij
@xj
+ 1 Reb
@2u
i
@xj@xj
(2.2)
where Reb =UbHb/⌫, Hb is the average channel depth, andUb is the bulk velocity at
the streamwise location where the channel depth is equal to the average channel depth (x⇡14h).x1,x2andx3are the streamwise, vertical and spanwise directions, also referred to as x, y and z. The velocity components in these directions are, respectively, u1, u2 and u3 (or u, v andw). An overline denotes a filtered quantity, and ⌧ij =uiuj uiuj
are the subgrid stresses, which were modeled using an eddy-viscosity assumption
⌧ij ij⌧kk/3 = 2⌫TSij= 2C 2|S|Sij. (2.3)
Here, = 2 ( x y z)1/3is the filter size,Sij = (@ui/@xj+@uj/@xi)/2 is the resolved
strain-rate tensor and|S|= 2SijSij
1/2
is its magnitude. The coefficientCis determined using the dynamic model (Germanoet al.1991) with the Lagrangian averaging technique proposed by Meneveauet al.(1996), and extended to non-Cartesian geometries by Jordan (1999) and Armenio & Piomelli (2000).
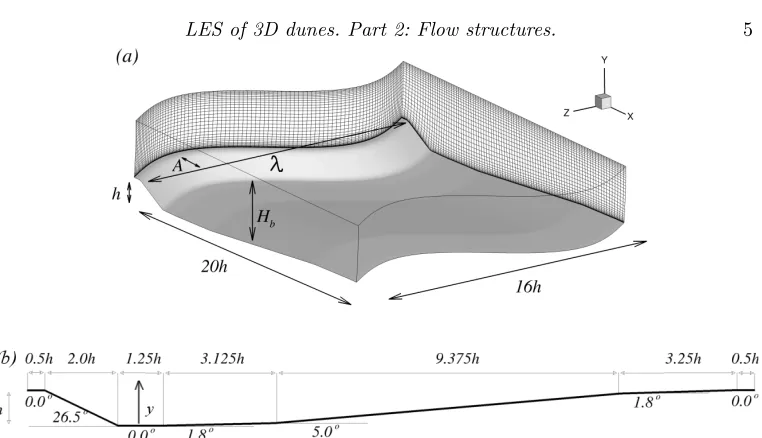
Figure 1.(a) Sketch of the physical 3D dune configuration. The sine function that is super-imposed into 2D dune configuration isAsin(2⇡z/ ), where is the wavelength (here = 16h) andAis the amplitude (hereA= 2h), and(b)bed geometry.
extensively tested for turbulent flows (Silva Lopes & Palma 2002; Silva Lopeset al.2006; Radhakrishnanet al.2006, 2008; Omidyeganeh & Piomelli 2011, 2013).
A full description of the geometry and 3D parameters of the crestline (amplitude A and wavelength ) can be found in Omidyeganeh & Piomelli (2013). The computa-tional configuration is sketched in Figure 1. Periodic boundary conditions are used in the streamwise (x) and spanwise (z) directions. The flow is driven by a pressure gradient that maintains a constant streamwise flow-rate in time. The top surface is assumed to be rigid and free of shear stress: the vertical velocity is set to zero, as are the vertical derivatives of the streamwise and spanwise velocity components. The surface deformation is reported to be small, less than 2% of the flow depth in experiments (McLeanet al. 1994; Kadota & Nezu 1999; Maddux et al.2003b,a) and simulations (Yue et al. 2006; Stoesseret al.
2008) of 2D and 3D dunes, and it was shown that the free surface response to the 3D dune bed is 2D (Maddux et al. 2003b; Omidyeganeh & Piomelli 2013). Therefore, the free-slip condition is expected to have small e↵ects on the statistics and on the evolution of significant structures. The Reynolds number is 18,900 based on theHb'3.5handUb
defined above.
An orthogonal mesh in thexy plane is generated using a hyperbolic grid-generation technique. This mesh is then repeated in the spanwise direction with non-uniform spacing, superimposed with a sine function shift, Asin(2⇡z/ ), in the streamwise direction. We modified the Poisson solver to address the curvature of grid lines in the spanwise direction as discussed in Omidyeganeh & Piomelli (2013).
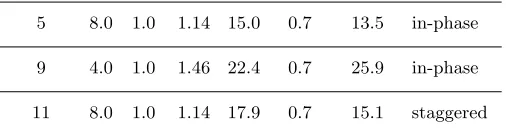
Case No. /h A/h NDS s+
avg n+avg zavg+ Alignment
5 8.0 1.0 1.14 15.0 0.7 13.5 in-phase
9 4.0 1.0 1.46 22.4 0.7 25.9 in-phase
[image:7.612.162.415.169.237.2]11 8.0 1.0 1.14 17.9 0.7 15.1 staggered
Table 1.Properties of the test cases. For the definition of the variables and Arefer to the caption of Figure 1. NDS is defined as a non-dimensional span number, NDS=Lc/Ly(Venditti et al.2005), where Lc is the crestline length and Ly is the linear distance between the crest
endpoints. Wall units are defined based on the local wall-shear velocity,u⌧, and the kinematic
viscosity,⌫.
Figure 2. Contours of mean streamwise vorticity, ⌦xh/Ub, for (a) Case 5 and (b) Case 11
on crossplanes at x/h = 2.0, 7.0, 12.0, 17.0, 22.0, 27.0, and 32.0. Arrows show the mean secondary flows. “L” represents the lobe and “S” represents the saddle.
new simulation; its mean-flow characteristics are similar to Case 10 in Omidyeganeh & Piomelli (2013), which had, however, a smaller wavelength.
[image:7.612.98.480.306.558.2]Piomelli (2013). Note that the computational domain for Case 11 has two dunes in series in the streamwise direction with 180o phase shift in the cosine function of the crestline.
The equations were integrated for 500h/Ubtime units to remove transient e↵ects. Then,
statistics were accumulated over 1200h/Ub time units, equivalent of 60
flow-through-times. To increase the sample size, averaging was also performed over the symmetric points in the spanwise direction. To verify the adequacy of the sample, we compared statistics obtained using only half of the sample with those obtained using the complete sample, and found that the mean velocities di↵ered by less than 1%, and the root-mean-square (rms) intensities by less than 5%.
3. Results
It is useful to recall here that the mean secondary flow induced by the crestline cur-vature significantly alters the characteristics of the separated shear-layer at the crest (Omidyeganeh & Piomelli 2013); low-momentum fluid, near the bed, moves towards the lobe plane over the stoss side of the dune (Figure 2); the alignment of the crestlines does not a↵ect this feature. However, the bulk flow is a↵ected by both the crestline curvature and its alignment: if the crestline are in-phase, high-momentum fluid converges towards the saddle plane and sweeps towards the bed; in the staggered alignment, high-momentum fluid converges to a line between the saddle and the lobe planes (Figure 2(b)). The wave-length of the crestline also a↵ects the secondary flow characteristics; Case 11, which has half the wavelength of Case 10, has weaker streamwise vortices around the saddle plane of the downstream dune; Case 9 with the smallest wavelength has no streamwise vortices in the bulk flow (Figures 8 and 18 in Omidyeganeh & Piomelli (2013)).
Figure 3 shows instantaneous coherent structures in Case 5, visualized by isosurfaces ofp0 andQ, the second invariant of the velocity-gradient tensor (Chong et al.1990),
Q= 1 2
@ui
@xj
@uj
@xi
(3.1)
and coloured by distance from the bed. Q isosurfaces are shown hereafter to illustrate population of structures in the separated-shear layer and the internal boundary layer. Some features of large-scale vortical structures (shown by p0 isosurfaces) are similar to those in the flow over 2D dunes (Omidyeganeh & Piomelli 2011). The separated shear-layer rolls up and generates a spanwise-oriented structure, a roller (Region 1 in Figure 3), which may undergo a three-dimensional instability, interact with surrounding vortices and deform to a horseshoe-like structure like the one in Region 2. After the reattachment of the flow, on the stoss side, structures generally lose their energy and coherence; population of structures over the stoss side significantly drops in the figure. This is also shown by small-scale wall turbulence structures, highlighted byQisosurfaces in Figure 3 (Region 3). We rarely observe strong coherent structures close to the surface; however, there is a weak signature of such a vortex in Region 4. In the next sections we will discuss these flow features in depth, and quantify their characteristics.
Figure 3.Instantaneous flow structures for the in-phase crestline alignment, Case 5. Isosurfaces of pressure fluctuationsp0/⇢U2
b = 0.061 are coloured by the distance from the bed with rainbow
colormap and isosurfaces of the second invariant of the velocity tensor, Qh2/U2
b = 5.29, are
coloured by the distance from the bed with grayscle colormap.
larger than the flow depth (Allen 1968; Gabel 1993); for this reason in the following we will concentrate on Cases 5 and 11, and mention Case 9 only when necessary.
3.1. Near-wall turbulence
Streamwise velocity fluctuations,u0, in a plane located 0.05habove the bed (the distance to the bed in wall unites isn+
'15), are shown in Figure 5. After flow separation at the crestline, over the lee side, low values of u0 are observed because of the separation and the bed inclination (u0 is nearly normal to the wall here); in the recirculation zone, the contours ofu0 are mostly oriented in the spanwise direction, due to the separated eddies in the shear layer leaving their footprints on the wall turbulence. Flow reattachment occurs on the stoss side around the solid line, which represents the mean reattachment line. Further downstream the internal boundary layer develops, and longitudinal high-and low-speed streaks are observed; the flow acceleration resulting from the favourable pressure gradient over the stoss side elongates the streaks.
High- and low-speed streaks are not uniformly distributed over the wall; clumps of several high-speed streaks can be observed, alternating with clumps of low-speed ones. In 2D dunes this preferential concentration was due to the presence of G¨ortler-like vortices generated on the stoss side, which is concave (Omidyeganeh & Piomelli 2011). A similar mechanism originates it in this case. Figure 6 shows the secondary-flow streamlines and vertical velocity fluctuations; the secondary velocity was averaged over a short time, approximately 20h/Ub, to visualize better the large vortices, which tend to meander. Note
Figure 4.Instantaneous flow structures for the in-phase crestline alignment, Case 9. Isosurfaces of pressure fluctuationsp0/⇢Ub2= 0.061 are coloured by the distance from the bed with rainbow
colormap and isosurfaces of the second invariant of the velocity tensor, Qh2/Ub2 = 5.29, are
coloured by the distance from the bed with grayscle colormap.
two-point correlations of velocity, not shown). In Figure 5 we also show the regions of upwash due to the presence of streamwise vortices, generated by the spanwise pressure gradient at the wall and discussed in Omidyeganeh & Piomelli (2013). We note very little correlation between the upwash regions and the concentrations of low-speed streaks, and only a slight one between the downwash (located immediately next to the upwash region) and the high-speed streaks. This indicates that the preferential concentration of streaks is not due to the large secondary motions, but to the G¨ortler vortices
To quantify the dimensions and features of the structures near the bed, we examined the auto-correlation coefficients of the streamwise velocity fluctuations, u0, at several points on the plane shown in Figure 5(a). The correlation is defined as
Ruu(x, z; x, z) =hu
0(x, z)u0(x+ x, z+ z)i
hu0(x, z)u0(x, z)i , (3.2) where the averaging is performed in time and over symmetric points.
Figure 5.Instantaneous streamwise-velocity fluctuations,u0, on a plane 0.05habove the bed;
(a)Case 5;(b)Case 11(c)Case 9. Solid lines are contours ofhui= 0.0 representing the mean separation and reattachment lines. The ovals highlight regions in which the streamwise vorteices cause upwash.
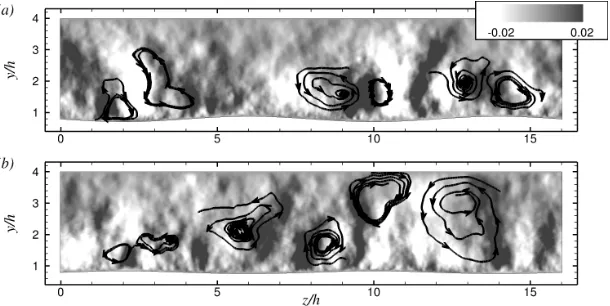
Figure 6.Secondary-flow streamlines in theyz plane atx= 15h, superposed on the contours of short time-averaged wall-normal velocity fluctuations for (a) Case 5 and (b) Case 11. The lobe planes are atz/h= 2.0 and 10.0, while the saddle planes are located atz/h= 6 and 14.
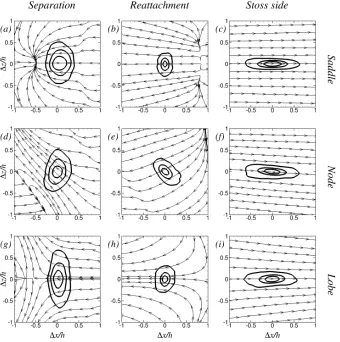
[image:11.612.136.441.433.586.2]Figure 7.Contours of spatial auto-correlation coefficient of streamwise velocity fluctuations in the plane 0.05habove the bed. Case 5. Contour levels are 0.3, 0.5, and 0.7; the position of the center of the correlation is shown in Figure 5(a). Streamlines show the flow direction tangential to the plane.(a,d,g)at (x xs)/h'1.75,(b)at (x xs)/h= 5.0,(e,h)at (x xs)/h'4.5,
and(c,f,i)at (x xs)/h'10.0.
of the mean flow streamlines; in the node plane (Figure 7(f )) they are inclined (the tip is tilted towards the lobe plane) following the mean-flow streamlines.
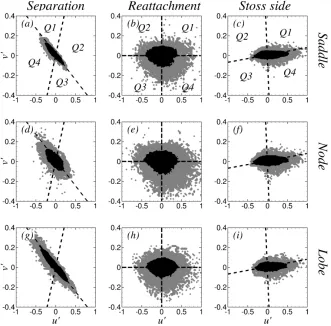
Figure 8 shows contours of the joint probability density functions ofu0 andv0 for Case 5. The dashed lines represent the inclination of the bed, and the direction normal to it (the dashed lines do not appear normal to each other because the u0 andv0 scales are di↵erent) and separate transport towards the wall (below and to the left of the line) from that away from it. Thus, events with v0 > 0 may actually represent wall-ward fluctuations. The quadrant partition relative to the bed is indicated in Figure 8(a) for the lee-side (where the flow is directed upwards and to the left, causing the quadrant ordering to be opposite to the usual one) and stoss-side locations. Over the lee side, bed-parallel events are dominant (Figures 8(a,d,g)), with a predominance of wall-ward transport (the events below and to the left of the dashed line in the figure). This, taken together with the correlation data in Figures 7(a,d,g), indicates that the rollers (Region 1 in Figure 3) generated at the crest leave their footprints on the lee side of the dune.
bed-Figure 8.Joint probability density contours ofu0 andv0at the points indicated in Figure 5(a). represents the alignment of the bed. Contour levels represent density of 0.01 and 0.11; the points are the same as those in Figure 7.
parallel fluctuations observed in this region (Figure 8(g)). Over the lee side of the saddle plane (Figure 8(c)) turbulence events are well organized but weak. In all cases Q4 events are dominant, as is the case near the wall in boundary layers. Despite the fact that the flow is separated over the lee side, the vigorous recirculation that results in upward flow over the lee side of the dune resembles in many ways a standard, attached wall-bounded flow.
In the reattachment region (Figures 8(b,e,h)), the bedward Q3 and Q4 events are dominant, reflecting the flow impingement. Stronger sweeps occur over the node plane. Although the mean wall-shear stress is small at the reattachment region, the turbulence may a↵ect the sediment transport significantly: Q1 events may be responsible for ini-tiating sediment transport (McLean et al. 1994), and Q4 events (sweeps) for bedload sediment transport (Nelson et al. 1993). Q4 events are particularly significant in this region. Note that the data provided by LES could be beneficial for the development of sediment transport models that take into account the turbulence structure in addition to the mean wall-shear stress (Nelsonet al. 1993; McLeanet al.1994).
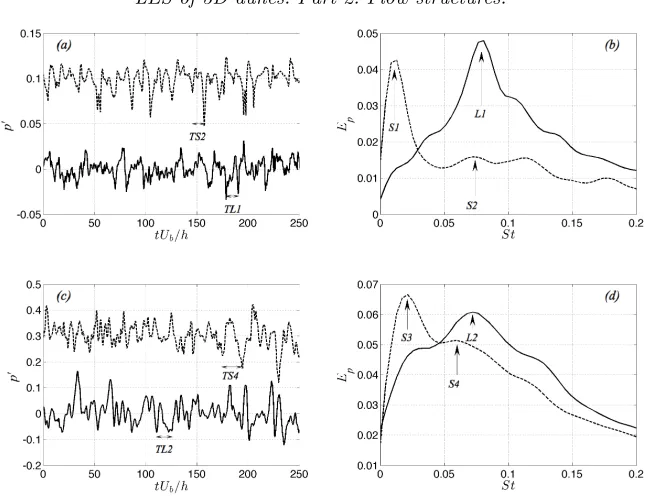
[image:13.612.115.446.136.462.2]Figure 9. (a,c) Time history and (b,d) spectra of local pressure fluctuations near the reat-tachment point for (a,b) in-phase crestline alignment (Case 5) and (c,d) staggered crestline alignment (Case 11). Lobe and saddle planes.
characteristics of the near-bed events are consistent for all the cases studied; the near-wall turbulence appears to be primarily a↵ected by the crestline shape, and rather insensitive to the alignment.
The frequency spectra of the pressure fluctuations in the lobe and the saddle planes of Cases 5 and 11 are illustrated in Figure 9. The Strouhal number is defined asSt=f h/Ub
(Ub is the bulk velocity at the streamwise location where the channel height is equal to
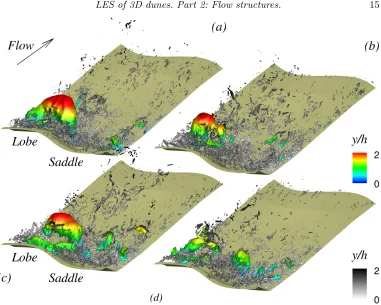
Figure 10.Instantaneous flow structures for the in-phase crestline alignment at four instants of the time-series shown in Figure 9(a). Only half of the channel is shown.(a,b)Vortices shed over the lobe,(a) tUb/h= 178.2,(b) tUb/h= 190.4.(c,d) Events over the saddle a↵ected by
vortices shed over the lobe,(c)tUb/h= 145.6, and(d) tUb/h= 156.9. Isosurfaces of pressure
fluctuationsp0/⇢U2
b = 0.076 are coloured by the distance from the bed with rainbow colormap
and isosurfaces of the second invariant of the velocity tensor, Qh2/U2
b = 7.6, are coloured by
the distance from the bed with grayscle colormap.
We also note that in the lobe region the flapping frequency is absent (Figures 9(b,d)). This may be due to the near-bed behaviour of the flow there: low-momentum fluid con-verges on the lobe plane from the sides and inhibits reattachment on the bed; this phe-nomenon results into a focal saddle point of separation on the bed over the lobe plane and discussed in Omidyeganeh & Piomelli (2013). The e↵ective isolation of the near bed region from the separated shear layer thus may be the reason why the flapping frequency is not observed at the wall here.
The shedding frequencies in the current simulations are close to those reported in the literature. In the backward-facing step, for instance, the dominant frequency was between St ' 0.06 (Le et al. 1997) and 0.066 < St < 0.08 (Eaton & Johnston 1982). Aider & Danet (2006) found the flapping frequency as well as the shedding frequency at St = 0.064 and 0.102, respectively. In the simulations over the two-dimensional dunes, similar shedding frequencies have been observed (St= 0.078 by Grigoriadiset al.(2009), andSt = 0.065 by Omidyeganeh & Piomelli (2011)). The shedding frequency is also in the range of the measurements by Venditti & Bauer (2005) as well as the range proposed by Jackson (1976),St= 0.04 0.11.
Figure 11.Instantaneous flow structures for the staggered crestline alignment at four instants of the time-series shown in Figure 9(a). Only half of the channel is shown. (a) tUb/h= 110.4, (b)tUb/h= 125.6,(c) tUb/h= 174.7, and(d) tUb/h= 194.6. Isosurfaces of pressure
fluctua-tionsp0/⇢U2
b = 0.076 are coloured by the distance from the bed with rainbow colormap and
isosurfaces of the second invariant of the velocity tensor, Qh2/U2
b = 7.6, are coloured by the
distance from the bed with grayscle colormap.
channel width is shown in the figures. Four instants from the time-series in Figures 9(a,c) are chosen to discuss the features of energetic events observed in the pressure spectra in Figures 9(b,d). In both alignments, rollers are generated at the crest of the lobe plane; they extend from one node to the next; their width is, therefore, comparable to the channel depth. Rollers with comparable scale and strength (negative pressure fluctuation) rarely appear in the shear layer near the saddle. This may be due to the approaching flow at the crest of the saddle plane which has much smaller deceleration (Figure 12 in Omidyeganeh & Piomelli (2013)) than in the lobe plane; low-speed fluid over the lobe with higher deceleration enhances the generation of large-scale rollers. Note that isosurfaces of Q show small-scale rollers over the saddle in Figures 10 and 11.
Figure 12.Contours of spanwise vorticity fluctuations,!zh/Ub, over(a,b)the lobe and(c,d)
the saddle planes of(a,c)the in-phase and(b,d)the staggered crestline alignments.
over the lobe results in a lower shedding frequency of structures (S2 andS4 in Figures 9(b,d)).
3.2. Separated shear-layer turbulence
In the previous section, we examined the characteristics of wall turbulence and connected the events in the reattachment region to the large-scale separated vortices at the crest. As discussed in the context of Figures 10 and 11, rollers are generated at the crest due to the Kelvin-Helmholtz instability of the separated shear-layer; near the lobe they are more coherent, as shown by thep0isosurfaces; these structures are advected downstream, undergo instability and rise up over the lobe. Near the saddle, the separated vortices do not appear as spatially coherent, but can still be visualized by the Qisosurfaces; they are advected downstream and towards the bed to the reattachment region. Large-scale rollers over the lobe a↵ect the separation bubble over the saddle; we observed a peak in the frequency spectrum of the pressure fluctuations over the saddle corresponding to the events over the lobe.
velocity profile, which is instrumental in generating large-scale vortical structures due to the Kelvin-Helmholtz instability; these eddies are then advected towards the bed, or rise towards the free surface, while undergoing complex interactions with surrounding structures and with the mean flow. The importance of these coherent structures in the transport of sediment has been discussed in the literature (Schmeeckleet al. 1999; Ven-ditti & Bennett 2000; Best 2005a). However the instantaneous characteristics of these eddies have not been studied yet.
The mean upwash and downwash caused by the streamwise vortices over the lobe and the saddle planes a↵ect the dynamics of coherent structures in the bulk flow significantly. The separated shear-layer in the lobe plane (Figures 12(a,b)) a↵ects the whole channel depth and the structures generated in this layer reach the free surface; in the saddle plane, on the other hand, (Figures 12(c,d)) the wake region behind the shear layer stays close to the bed and rarely a large-scale structure reaches the free-surface. The downwash of the mean streamwise vortices on the saddle plane (especially strong in the in-phase alignment), inhibits generation of large-scale rollers (refer to Figures 10 and 11) and prevents their upwards motion, advecting them towards the bed instead. The upwash generated in the lobe plane, on the other hand, advects structures toward the free surface. Since, in the staggered alignment, each saddle is followed by a lobe, eddies advected from the upstream lobe plane appear close the free surface even in the plane of the saddle (Figure 12(d)). In the in-phase alignment, on the other hand, the streamwise vortices are amplified as they extend from one dune to the next. For this reason, we rarely observe strong events at the surface in their downwash region.
The significant di↵erence between the dynamics of coherent structures in the lobe and the saddle planes can be quantified by considering the probability-density function of spanwise eddies, using the technique proposed by Kida & Miura (1998) to identify spanwise vortices. This technique extracts the low-pressure vortices with swirling motion and demarcs the core region around the central axis of vortices. With the added condition that the pressure fluctuation is also negative, these criteria help to identify the centre of the large vortical structures in the shear layer. Figure 13 shows that most of the structures appear in the separated shear-layer, and have negative vorticity (clockwise rotation). In the lobe plane (Figures 13(a,b)) the most probable path of structures in the separated shear-layer is toward the free surface, while in the saddle plane (Figures 13(c,d)) the eddies remain close to the bed and do not reach the free surface. This is consistent with the observations based on instantaneous flow fields above, and justified by the e↵ect of the large streamwise vortices. A significant di↵erence between in-phase and staggered alignments is that when the crestlines are aligned, once the large eddies reach the surface, they persist for long times. In the staggered arrangement, on the other hand, they are more quickly dissipated as the upwash region due to the streamwise vortices is replaced by a downwash one. Compared with the 2D dune case, the crestline curvature primarily directs high-energy vortical structures generated at the crest of the lobe planes toward the free surface; alignment of the crestline, on the other hand, a↵ects the distribution of the structures in the flow and at the surface.
3.3. Boil events
Figure 13.Contours of the probability density function of counter-clockwise oriented spanwise eddies minus the probability density function of clockwise oriented spanwise eddies, over(a,b)
the lobe and (c,d) the saddle planes of (a,c) the in-phase and (b,d) the staggered crestline alignments.
downstream and toward the free surface. The horseshoe vortex loses energy, as shown by the fact that the pressure fluctuation decreases in magnitude (Figure 14). The Q isosurfaces show a distribution of smaller structures near the horseshoe vortex.
Figure 14. Instantaneous flow visualization around the lobe plane (0.0 z/h 4.0) for Case 5 (in-phase crestline alignment) at 8 instants in time between(a) tUb/h= 156 and(h)
164. Isosurfaces of pressure fluctuations p0/⇢U2
b = 0.076 are coloured by the distance from
the bed with rainbow colormap and isosurfaces of the second invariant of the velocity tensor,
Qh2/U2
b = 7.6, are coloured by the distance from the bed with grayscle colormap.
the upwelling of the surface known as a ”boil” (Matthes 1947; Jackson 1976; M¨uller & Gyr 1986; Nezu & Nakagawa 1993; Babakai↵& Hickin 1996; Kadota & Nezu 1999; Best
et al.2001; Best 2005a,b).
Figure 17 shows the probability of boil events occurring at the surface, selected by requiring that the planar divergence
rs·u0=
@u0 @x +
@w0
@z (3.3)
be greater than 2.0Ub/hwhile the pressure fluctuations are positive. The first noticeable
feature is the fact that the probability of horseshoe occurrence is much higher for 3D dunes than in the 2D case. This is due to a more frequent generation of boil-producing eddies in the separated shear-layer; the upwash in the lobe plane transports them towards the free surface. For the in-phase crestline alignment, the probability of strong boils occurring in the lobe plane is much higher than in the saddle plane, and is more uniform than in the 2D case. This may be due to the fact that, in the 2D case, the mean velocity in the region 5.0(x xs)/h10.0 is directed downwards, whereas in the lobe region
Figure 15.Instantaneous flow visualization around the lobe plane (0.0z/h4.0) and over the stoss side (7.9(x xs)/h20.0) for Case 5 (in-phase crestline alignment) at 8 instants in
time between(a)tUb/h= 164 and(h)172. Isosurfaces of pressure fluctuationsp0/⇢Ub2= 0.038
for(a-d)andp0/⇢U2
b = 0.03 for(e-h)are coloured by the distance from the bed with rainbow
colormap and isosurfaces of the second invariant of the velocity tensor, Qh2/U2
b = 3.78, are
coloured by the distance from the bed with grayscle colormap.
Figure 16.Instantaneous flow visualization attUb/h= 172.1. Isosurfaces of pressure
fluctua-tions p0/⇢Ub2 = 0.03 are coloured by the distance from the bed with rainbow colormap and
isosurfaces of the second invariant of the velocity tensor, Qh2/Ub2 = 3.8, are coloured by the
[image:21.612.99.478.449.634.2]Figure 17.Probability of strong boils over a time h/Ub at the free surface. Lines: in-phase;
lines and symbols: staggered;•2D (Omidyeganeh & Piomelli 2011). Lobe and saddle planes.
since upstream e↵ects are significant. Over the stoss side, on the other hand, the local behaviour becomes dominant, and the probabilities over lobe and saddle approach the behaviour observed in the in-phase case.
4. Conclusions
We performed a study of dunes with sinusoidal crestline shapes. In a previous paper we discussed the mean flow characteristics of such geometries. Here, we concentrate on the e↵ect of geometric three-dimensionality on the turbulent structures. In particular, we examine the near-wall structures, the eddies generated in the separated shear-layer, and the large horseshoe-shaped vortices responsible for the generation of boils (large upwellings at the surface).
The main feature of the mean flow that a↵ects the turbulent structure in 3D dunes, and is responsible for many of the di↵erences between those and 2D dunes, is the presence of large, streamwise vortices. These vortices are generated by the spanwise gradient of the wall pressure, which is directed from the saddle to the lobe, and causes the secondary motion. For crestline wavelengths larger than the channel depth, the secondary motions take the form of a pair of longitudinal counter-rotating vortices, that straddle the lobe plane, causing upwash of slow fluid in the lobe plane, and downwash of high-speed fluid over the saddle plane. The crestline alignments does not change the generation mechanism of the mean secondary motions, but when the crests are aligned the position of the vortices is stabilized, while if they are staggered, in addition to the vortices that straddle the lobe, the remains of the vortex pair generated at the previous dune are still present, although weaker, and straddle the saddle.
Most of the coherent-structure dynamics observed here are very similar to those in 2D geometries. The main e↵ect of crestline three-dimensionality appears as a preferen-tial generation and distribution of the vortical structures, and a di↵erent development depending on whether the eddies are in the downwash field of the longitudinal vortices, or in the upwash region. Thus, the main role of the crestline alignment is to either am-plify or dampen the development of the eddies through the advection field of the mean longitudinal vortices.
rollers in the node plane forward on the saddle side. Around the reattachment region, a highly intermittent interaction of separated vortices at the crest with the bed is observed; sweeps are dominant and are stronger over the node plane. An internal boundary layer develops on the stoss side; low- and high-speed streaks appear near the bed and, due to the flow acceleration, become elongated in the streamwise direction. As in the 2D case we observe preferential concentration of low- and high-speed streaks, which appears to be due to the generation of G¨ortler-like streamwise vortices (and not to the mean secondary motions).
The curvature of the crestline significantly a↵ects the characteristics of the separated vortices and their evolution through the secondary motions; the rollers are stronger over the lobe plane, and have sizes comparable to the channel height. Shedding of the rollers over the lobe occurs at higher frequency than over the saddle plane; the staggered align-ment of the crestlines decrease this frequency. The flapping of the separated shear layer results in a peak of the wall-pressure spectrum at a frequency much lower than the shed-ding frequency, which also depends on the state of the boundary layer approaching the crest: the vigorous turbulence originating in the lobe area results in higher-frequency flapping. In the staggered case, this results in a higher frequency in the saddle plane, since the approaching flow comes from the lobe. Since the mean flow does not reattach on the bed over the lobe plane, the wall is e↵ectively sheltered from the shear layer there, and the flapping behaviour of the separated shear-layer is not observed in the pressure spectra around the reattachment point.
Because of the upwash of the longitudinal vortices, in the lobe plane the separated shear-layer disturbs the whole channel depth; turbulent eddies advected downstream rise towards the surface. In the saddle plane, on the other hand, the coherent structures remain close to the bed as they are advected downstream. The staggered alignment of the crestlines only changes the distribution of the structures in the bulk flow; downstream of a lobe, structures reach the free surface and are dissipated as they approach the saddle plane of the downstream dune. Hence, in the staggered alignment we observe less persistent surface events than in the in-phase one.
The large-scale rollers generated near the lobes undergo 3D instability while being advected downstream and rise up toward the free surface; they become horseshoe-like vortices similar to those observed over 2D dunes. The flow acceleration over the stoss side elongates them, and the mean-velocity gradient tilts them to an inclined orientation with respect to the horizontal direction. When the tip of such a vortex loop reaches the free surface, the ejection of the flow between the horseshoe legs and behind its head causes boil events. The curvature of the crestline increases the appearance of boil events at the surface of the lobe plane, compared with 2D dunes, and decreases the appearance of these events at the surface of the saddle plane. The staggered alignment changes the distribution of their occurrence over the crest of the dune, which follows the characteristic of the upstream dune. Over the saddle plane, boil events over the crest are highly probable as they come from the upstream lobe plane; on the stoss side of the saddle plane, on the other hand, boils advected from the upstream dune are dissipated and new ones are rarely produced.
Acknowledgments
Computing Virtual Laboratory (HPCVL), Queen’s University site, for the computational support. MO acknowledges the partial support of NSERC under the Alexander Graham Bell Canada NSERC Scholarship Program. UP also acknowledges the support of the Canada Research Chairs Program.
REFERENCES
Aider, J-L. & Danet, A.2006 Large-eddy simulation study of upstream boundary conditions influence upon a backward-facing step flow.Comptes Rendus M´ecanique334, 447–453.
Allen, J.R.L.1968Current ripples: their relation to patterns of water and sediment motion. North-Holland Pub. Co.
Armenio, V. & Piomelli, U.2000 A Lagrangian Mixed Subgrid-Scale Model in Generalized Coordinates.Flow, Turb. Combust.65, 51–81.
Ashley, G. M.1990 Classification of large-scale subaqueous bedforms: a new look at an old problem.J. Sedim. Petrol.60(1), 160–172.
Babakaiff, S. C. & Hickin, E. J.1996 Coherent flow structures in Squamish River Estuary, British Columbia, Canada. In Coherent Flow Structures in Open Channels (ed. P. Ash-worth, S.J. Bennett, J.L. Best & S.J. McLelland), pp. 321–342. Wiley.
Bennett, S. J. & Best, J. L. 1995 Mean flow and turbulence structure over fixed, two-dimensional dunes: implications for sediment transport and bedform stability. Sedimentol-ogy 42, 491–514.
Best, J.1992 On the entrainment of sediment and initiation of bed defects: insights from recent developments within turbulent boundary layer research.Sedimentology39, 797–811.
Best, J. L.2005a The fluid dynamics of river dunes: A review and some future research direc-tions.J. Geophys. Res.119(F04S02), 1–21.
Best, J. L.2005bKinematics, topology and significance of dune-related macroturbulence: some observations from the laboratory and field. InFluvial Sedimentology VII (ed. M. D. Blum, S. B. Marriott & S. Leclair), , vol. 35, pp. 41–60. Spec. Publs. Int. Ass. Sedimentol.
Best, J. L. & Kostaschuk, R. A.2002 An experimental study of turbulent flow over a low-angle dune.J. Geophys. Res.107(C9), 3135–3153.
Best, J. L., Kostaschuk, R. A. & Villard, P. V.2001 Quantitative visualization of flow fields associated with alluvial sand dunes: results from the laboratory and field using ul-trasonic and acoustic Doppler anemometry.J. Visualization 4(4), 373–381.
Bradshaw, P.1987 Turbulent secondary flows.Annu. Rev. Fluid Mech.19(1), 53–74.
Chong, M. S., Perry, A. E. & Cantwell, B. J. 1990 A general classification of three-dimensional flow fields.Phys. Fluids2, 765–777.
Dejoan, A. & Leschziner, M. A.2004 Large eddy simulation of periodically perturbed sep-arated flow over a backward-facing step.Int. J. Heat Fluid Flow 25, 581–592.
Driver, D. M., Seegmiller, H. L. & Marvin, J. G. 1987 Time-dependent behavior of a reattaching shear layer.AIAA J.25, 914–919.
Eaton, J. K. & Johnston, J. P.1982 Low frequency unsteadiness of a reattaching turbulent shear layer.Turb. Shear Flows 3, 162–170.
Gabel, S. L.1993 Geometry and kinematics of dunes during steady and unsteady flows in the Calamus River, Nebraska, USA.Sedimentology40, 237–269.
Germano, M., Piomelli, U., Moin, P. & Cabot, W. H.1991 A dynamic subgrid-scale eddy viscosity model.Phys. Fluids A3, 1760–1765.
Gibson, A. H.1909 On the depression of the filament of maximum velocity in a stream flowing through an open channel.Proc. Royal Soc. of LondonSeries A, 82, 149–159.
Grigoriadis, D. G. E., Balaras, E. & Dimas, A. A.2009 Large-eddy simulations of unidi-rectional water flow over dunes.J. Geophys. Res.114.
Jackson, R. G.1976 Sedimentological and fluid-dynamic implications of the turbulent bursting phenomenon in geophysical flows.J. Fluid Mech.77, 531–560.
Jordan, S. A.1999 A large-eddy simulation methodology in generalized curvilinear coordinates.
J. Comput. Phys.148(2), 322–340.
Kaftori, D., Hetsroni, G. & Banerjee, S.1995bParticle behaviour in the turbulent bound-ary layer II. Velocity and distribution profiles.Phys. Fluids 7, 1107–11021.
Karcz, I.1966 Secondary currents and the configuration of a natural stream bed.J. Geophys. Res.71, 3109–3116.
Kida, S. & Miura, H.1998 Swirl condition in low-pressure vortices.J. Phys. Soc. Japan67(7), 2166–2169.
Kim, J. & Moin, P. 1985 Application of a fractional step method to incompressible Navier-Stokes equations.J. Comput. Phys.59, 308–323.
Kinoshita, R.1967 An analysis of the movement of flood waters by aerial photography; con-cerning characteristics of turbulence and surface flow.Photographic Surveying 6, 1–17, (in Japanese).
Kostaschuk, R. A.2000 A field study of turbulence and sediment dynamics over subaqueous dunes with flow separation.Sedimentology 47(3), 519–531.
Kostaschuk, R. A. & Church, M. A. 1993 Macroturbulence generated by dunes: Fraser River, Canada.Sedimentary Geology 85(1-4), 25–37.
Lapointe, M. F.1996 Frequency spectra and intermittency of the turbulent suspension process in a sand-bed river.Sedimentology 43, 439–449.
Le, H., Moin, P. & Kim, J.1997 Direct numerical simulation of turbulent flow over a backward-facing step.J. Fluid Mech.330, 349–374.
Leonard, A. 1974 Energy cascade in large-eddy simulations of turbulent fluid flows. Adv. Geophys.18A, 237–248.
Maddux, T. B., McLean, S. R. & Nelson, J. M.2003aTurbulent flow over three-dimensional dunes: 2. Fluid and bed stresses.J. Geophys. Res.108(F1).
Maddux, T. B., Nelson, J. M. & McLean, S. R.2003bTurbulent flow over three-dimensional dunes: 1. Free surface and flow response.J. Geophys. Res.108(F1).
Matthes, G. H. 1947 Macroturbulence in natural stream flow. Trans. American Ceophys. Union 28(2), 255–265.
McLean, S. R., Nelson, J. M. & Wolfe, S. R. 1994 Turbulence structure over two-dimensional bedforms: Implications for sediment transport. J. Geophys. Res.99, 12729– 12747.
Meneveau, C., Lund, T. S. & Cabot, W. H.1996 A Lagrangian dynamic subgrid-scale model of turbulence.J. Fluid Mech.319, 353–385.
M¨uller, A. & Gyr, A. 1986 On the vortex formation in the mixing layer behind dunes.J. Hydr. Res.24, 359–375.
Nelson, J.M., McLean, S.R. & Wolfe, S.R. 1993 Mean flow and turbulence fields over two-dimensional bed forms.Water Resour. Res.29(12), 3935–3953.
Nezu, I. & Nakagawa, H.1993Turbulence in Open-Channel Flows. Balkema.
Nino, Y. & Garcia, M. H.1996 Experiments on particle-turbulence interactions in the near-wall region of an open channel flow: implications for sediment transport. J. Fluid Mech. 326, 285–319.
Omidyeganeh, M. & Piomelli, U.2011 Large-eddy simulation of two-dimensional dunes in a steady, unidirectional flow.J. Turbul.12(42), 1–31.
Omidyeganeh, M. & Piomelli, U.2013 Large-eddy simulation of three-dimensional dunes in a steady, unidirectional flow. Part 1: Turbulence statistics.J. Fluid Mech.721, 454–483.
Ong, L. & Wallace, J. M.1998 Joint probability density analysis of the structure and dy-namics of the vorticity field of a turbulent boundary layer.J. Fluid Mech.367, 291–328.
Parsons, D. R., Best, J. L., Orfeo, O., Hardy, R. J., Kostaschuk, R. & Lane, S. N.2005 Morphology and flow fields of three-dimensional dunes, Rio Paran´a, Argentina: Results from simultaneous multibeam echo sounding and acoustic Doppler current profiling.J. Geophys. Res.110(F04S03).
Radhakrishnan, S., Piomelli, U. & Keating, A.2008 Wall-modeled large-eddy simulations of flows with curvature and mild separation.ASME J. Fluids Eng.130(101203).
Rhie, C. M. & Chow, W. L.1983 Numerical study of the turbulent flow past an airfoil with trailing edge separation.AIAA J.21, 1525–1532.
van Rijn, L. C.1984 Sediment transport, part III: Bed forms and alluvial roughness.J. Hydr. Engng110(12), 1733–1754.
Roden, J. E.1998 The sedimentology and dynamics of mega-dunes, Jamuna River, Bangladesh. PhD thesis, Univ. Leeds, Leeds, U.K.
Schindler, R. J. & Robert, A.2005 Flow and turbulence structure across the ripple–dune transition: an experiment under mobile bed conditions.Sedimentology52, 627–649.
Schmeeckle, M. W., Shimizu, Y., Hoshi, K, Baba, H. & Ikezaki, S.1999 Turbulent struc-tures and suspended sediment over two-dimensional dunes. InRiver, Coastal and Estuarine Morphodynamics, Proc. Intnl. Assn. Hydr. Res. Symp., pp. 261–270. Springer, NY.
Shugar, D., Kostaschuk, R. A., Best, J. L., Parsons, D. R., Lane, S. N., Orfeo, O. & Hardy, R. J.2010 On the relationship between flow and suspended sediment transport over the crest of a sand dune, Rio Paran´a, Argentina.Sed.57, 252–272.
Silva Lopes, A. & Palma, J. M. L. M. 2002 Simulations of isotropic turbulence using a non-orthogonal grid system.J. Comput. Phys.175(2), 713–738.
Silva Lopes, A., Piomelli, U. & Palma, J. M. L. M.2006 Large-eddy simulation of the flow in an S-duct.J. Turbul.7(11), 1–24.
Stoesser, T., Braun, C., Garc´ıa-Villalba, M. & Rodi, W.2008 Turbulence structures in flow over two-dimensional dunes.J. Hydr. Engng 134(1), 42–55.
Sutherland, A. J.1967 Proposed mechanism for sediment entrainment by turbulent flows.J. Geophys. Res.72, 191–198.
Vanoni, V. A. 1946 Transportation of suspended sediment by water. Trans. of ASCE 111, 67–133.
Venditti, J. G.2007 Turbulent flow and drag over fixed two- and three-dimensional dunes.J. Geophys. Res.112(F04008).
Venditti, J. G. & Bauer, B. O.2005 Turbulent flow over a dune: Green River, Colorado.
Earth Surf. Proc. Landf 30, 289–304.
Venditti, J. G. & Bennett, S. J.2000 Spectral analysis of turbulent flow and suspended sediment transport over dunes.J. Geophys. Res.105, 22035–22047.
Venditti, J. G., Church, M. & Bennet, S. J.2005 On the transition between 2D and 3D dunes.Sedimentology52, 1343–1359.
Yalin, M. S.1964 Geometrical properties of sand waves. J. Hydr. Div. Am. Soc. Civ. Engng 90(HY5), 105–119.