City, University of London Institutional Repository
Citation
:
Mergos, P.E. & Beyer, K. (2015). Displacement-based seismic design of
symmetric single-storey wood-frame buildings with the aid of N2 method. Frontiers in Built
Environment, 1, .10. doi: 10.3389/fbuil.2015.00010
This is the published version of the paper.
This version of the publication may differ from the final published
version.
Permanent repository link: http://openaccess.city.ac.uk/12623/
Link to published version
:
http://dx.doi.org/10.3389/fbuil.2015.00010
Copyright and reuse:
City Research Online aims to make research
outputs of City, University of London available to a wider audience.
Copyright and Moral Rights remain with the author(s) and/or copyright
holders. URLs from City Research Online may be freely distributed and
linked to.
doi: 10.3389/fbuil.2015.00010
Edited by:
Solomon Tesfamariam, The University of British Columbia, Canada
Reviewed by:
P. Rajeev, Swinburne University of Technology, Australia Hossein Mostafaei, FM Global, USA
*Correspondence:
Panagiotis Mergos, Research Centre for Civil Engineering Structures, Department of Civil Engineering, City University London, Northampton Square, London EC1V 0HB, UK panagiotis.mergos.1@city.ac.uk
Specialty section:
This article was submitted to Earthquake Engineering, a section of the journal Frontiers in Built Environment
Received:29 April 2015
Accepted:02 July 2015
Published:16 July 2015
Citation:
Mergos P and Beyer K (2015) Displacement-based seismic design of symmetric single-storey wood-frame buildings with the aid of N2 method. Front. Built Environ. 1:10. doi: 10.3389/fbuil.2015.00010
Displacement-based seismic
design of symmetric single-storey
wood-frame buildings with the aid
of N2 method
Panagiotis Mergos1* and Katrin Beyer2
1Research Centre for Civil Engineering Structures, Department of Civil Engineering, City University London, London, UK, 2Earthquake Engineering and Structural Dynamics Laboratory, Department of Civil Engineering, École Polytechnique Fédérale de Lausanne, Lausanne, Switzerland
This paper presents a new methodology for the displacement-based seismic design of symmetric single-storey wood-frame buildings. Previous displacement-based design efforts were based on the direct displacement-based design approach, which uses a substitute linear system with an appropriate stiffness and viscous damping combination. Despite the fact that this method has shown to produce promising results for wood structures, it does not fit into the framework of the Eurocode 8 (EC8) provisions. The methodology presented herein is based on the N2 method, which is incorporated in EC8 and combines the non-linear pushover analysis with the response spectrum method. The N2 method has been mostly applied to reinforced concrete and steel structures. In order to properly implement the N2 method for the case of wood-frame buildings, new behavior factor–displacement ductility relationships are proposed. These relationships were derived from inelastic time history analyses of 35 SDOF systems subjected to 80 different ground motion records. Furthermore, the validity of the N2 method is examined for the case of a timber shear wall tested on a shake table and satisfactory predictions are obtained. Last, the proposed design methodology is applied to the displacement-based seismic design of a realistic symmetric single-storey wood-frame building in order to meet the performance objectives of EC8. It is concluded that the simplicity and computational efficiency of the adopted methodology make it a valuable tool for the seismic design of this category of wood-frame buildings, while the need for extending the method to more complex wood-frame buildings is also highlighted.
Keywords: performance, seismic, design, wood-frame, structures, N2
Introduction
and/or deformations. In force-based design, displacements and deformations are only checked at the end of the design procedure in order to establish that they are below some predefined limits.
For wood-frame buildings, correct application of force-based design is further undermined by several drawbacks, such as (i) the requirement of the definition of an initial (“elastic”) stiffness and period (timber shear walls behave non-linearly even in the very early stages of their lateral response), (ii) a lack of appropriate behavior factorq–displacement ductilityµ∆relationships in the
literature and therefore in design codes. It is recalled herein that
qis the ratio of the peak forceFel that would have developed
if the system behaved linearly elastically to the yield strengthFy
of the actual system. The displacement ductilityµ∆ is the ratio
of the maximum displacement response to the yield displacement
dy. Moreover, capacity design approaches have not yet been fully
developed for the case of wood-frame buildings.
To overcome the short-comings of a force-based design approach, several displacement-based design approaches have been developed (Sullivan et al., 2003). The fundamental concept of displacement-based design is to design a structure in order to achieve, rather be bounded by, a performance level for a given seismic action. One of the best-known procedures that falls within this category is the direct displacement-based design (DDBD) method, which was initially developed byPriestley (1993) and
Priestley and Kowalsky (2000). DDBD methodologies assume a substitute linear system (Shibata and Sozen, 1976) with an appropriate stiffness and viscous damping combination that best reproduces the response of the inelastic system at the performance level under investigation.
Several researchers have applied the DDBD approach to wood-frame buildings. Filiatrault and Folz (2002)developed a performance-based seismic design methodology for wood-frame buildings, which is based on the DDBD. Pang and Rosowsky (2009)developed a new DDBD procedure for performance-based seismic design of mid-rise wood-frame buildings. Pang et al. (2010)simplified the methodology byPang and Rosowsky (2009)
and applied their approach to a six-storey wood-frame building, which was tested at full scale as part of the NEESWood project (van de Lindt and Liu, 2006). Furthermore,Wang et al. (2010)
developed a set of factors for use in the methodology byPang et al. (2010)in order to meet pre-specified performance levels with certain probabilities of non-exceedance.
Although DDBD methods have shown to produce promising results for wood structures, they do not fit into the framework of the Eurocode 8 (EC8) provisions, which do not adopt the lin-ear substitute structure approach for assessing seismic response. Instead, they use a non-linear static assessment method the so-called N2 method (Fajfar and Gaspersic, 1996;Fajfar, 1999, 2000). This method is a capacity spectrum method, which combines the non-linear static (pushover) analysis and the response spectrum approach. The method has been widely applied to reinforced concrete, steel, and unreinforced masonry structures. For timber buildings, however, only few applications have been carried out.
Fragiacomo et al. (2011)used the N2 method to assess the seismic response of a multi-storey crosslam massive wooden building. They indicate that the lack of appropriate behavior factorq–displacement ductilityµ∆relationships for systems with
significant pinching and stiffness degradation is the main draw-back for the application of the method to timber structures.
The main objective of this paper is the application of the N2 method to the direct performance-based seismic design of sym-metric single-storey wood-frame buildings. To meet this goal, a new design methodology is developed and applied to a realistic wood-frame building case study.
Furthermore, to apply the N2 method to wood-frame build-ings in a consistent manner, new behavior factorq–displacement ductilityµ∆relationships of SDOF systems representative of the
hysteretic response of wood-frame buildings are developed. Then, the validity of the N2 method with the newq–µ∆relationships is verified against experimental results of wood-frame buildings.
Description of the N2 Method for SDOF
Systems
In this section, the basic steps of the N2 method for SDOF systems, which can be assumed representative of symmetric in plan single-storey wood-frame buildings, are outlined. Furthermore, the lim-itations of this method when applied to wood-frame buildings are highlighted and discussed. The N2 method can also be applied to MDOF systems by transforming the MDOF system into a SDOF system that represents the first mode behavior.
The N2 method for SDOF systems comprises the following basic steps.
Step 1
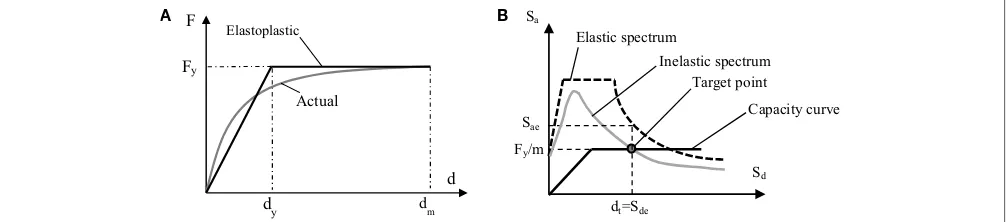
The data required for the application of the method are obtained. For computing the structure’s capacity, the structural configuration of the SDOF system with mass m needs to be determined (Figure 1A). Seismic demand is represented by a pseudo-acceleration response spectrum (Figure 1B).
Step 2
The elastic acceleration–displacement response spectrum (ADRS) is determined by the following relationship, which is valid for a constant viscous damping ratio (e.g., 5%), andSdeandSae
repre-sent elastic displacement and acceleration spectra, respectively.
Sde= T 2
4·π2Sae· (1)
m
d
F
Sae
T
TD TC
ξ=5%
T
B
[image:3.595.306.551.518.668.2]B A
The inelastic acceleration Sa and inelastic displacement Sd
spectra for a constant displacement ductility level µ∆ are then
determined by the following relationships, whereqis the behavior factor due to ductility (i.e., hysteretic response).
Sa=Sae
q · (2)
Sd=
Sde
q ·µ∆· (3)
For the derivation of the inelastic spectra, it is necessary to determine the relationship betweenqandµ∆. In the next section,
newq–µ∆ relationships are developed to account for the special
hysteretic characteristics of wood-frame buildings.
Step 3
A pushover analysis is conducted and the relationship between top displacementdversus base shearFis established.
Step 4
Having established the actual force F versus displacement d
relationship of the SDOF system, an approximate elastoplastic envelope (Figure 2) is obtained, by using an appropriate bilin-earisation method (FEMA-273, 1997;Fajfar, 2000), with yielding point (dy,Fy).
The elastic periodTof the equivalent SDOF system is calcu-lated as
T=2·π
√
m·dy
Fy ·
(4)
The elastoplastic capacity curve is finally transformed into acceleration versus displacement format by the following relationship
Sa= F
m· (5)
Step 5
The performance (target) point with displacement dt is
deter-mined graphically by the intersection of the demand (inelastic spectrum) and capacity curve when both are plotted in the dis-placement–acceleration format (Figure 2). Alternatively,dt can
be calculated by simple closed-form expressions as explained in Annex B of EC8-Part 1.
Step 6
At this last step, local demands developed at the level of target displacement are compared (if required) with the corresponding acceptable limits (capacities) for the performance level under examination.
From the description of the basic steps of the N2 method for SDOF systems, the following flaws related to the application of this method to symmetric single-storey wood-frame buildings can be identified:
• The method uses inelastic response spectra that have not been developed for structural systems representative of wood-frame buildings, which are characterized by hysteretic behavior with significant stiffness and strength deterioration and important pinching effect.
• The method uses displacement ductilityµ∆, which is a function
of the displacement of the structure at yielding. Yield displace-ment is used also for the determination of the elastic stiffness and elastic period. However, wood-frame buildings exhibit a non-linear behavior right when subjected to horizontal loads. Hence, the definition of the yield displacement is ambiguous and may not be representative of the actual non-linear response.
Relationship Between Behavior Factor
q
and Ductility Demand
µ
∆for Wood-Frame
Buildings
As explained in the previous section, the relationship betweenq -factor andµ∆ is a key feature of the N2 method. It is recalled that EC8 adopts the inelastic response spectra derived byVidic et al. (1994) for the determination of seismic demand. These spectra were derived using hysteretic relationships representative of the flexural response of reinforced concrete and steel members: the elastoplastic model and theQ-modelVidic et al. (1994); for both models a positive post-yield slope of 10% was assumed. These models may therefore not be representative and accurate for timber structures, whose hysteretic behavior is characterized by significant stiffness and strength deterioration and important pinching effect.
To investigate herein the validity of the relationship between
q-factor andµ∆, a number of inelastic time history analyses are
conducted for SDOF systems representative of the timber shear walls’ hysteretic response for several ground motion records from regions of low to moderate and high seismicity. The same set of
F
d Fy
Elastoplastic
Actual
dy dm
Sd
Sa
Elastic spectrum
Inelastic spectrum
dt=Sde
Fy/m
Sae
Target point
Capacity curve
[image:4.595.47.551.579.690.2]B A
A B
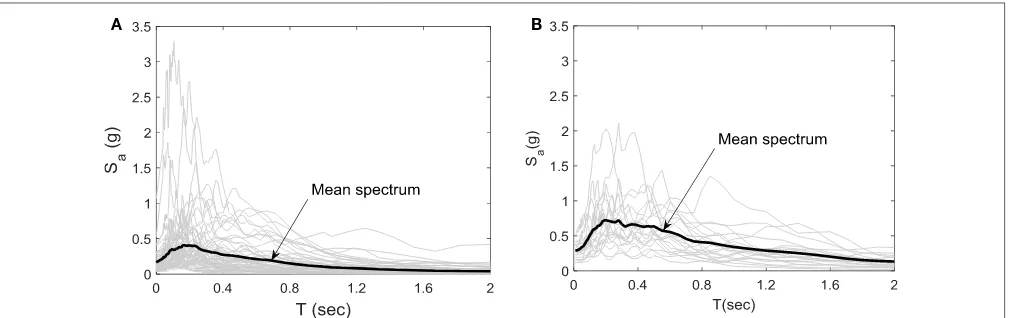
FIGURE 3|Unscaled acceleration response spectra of ground motion records representative of (A) low to moderate seismicity records; (B) high-seismicity records.
ground motions has been used in a study on loading protocols (Mergos and Beyer, 2014).
More particularly, 60 records were taken to be representative of a low to moderate seismicity region like the city of Sion in Switzerland. The city of Sion is situated in the Rhone Valley and has a design PGA of 0.16 g for 10% in 50 years (10/50) hazard level. For this site, the de-aggregation of hazard results is readily avail-able (Giardini et al., 2004). All ground motions have a moment magnitude within the range of 4.3≤Mw≤6.6 and an epicentral distance within the range 5 km≤R≤33 km. The unscaled accel-eration response spectra of the ground motion records selected for low to moderate seismicity regions are shown inFigure 3A.
In addition to the 60 ground motion records representative of low to moderate seismicity regions, a set of 20 ground motion records used by Krawinkler et al. (2001) as representative of high-seismicity regions is also considered herein. All ground motions of this set have a moment magnitude within the range of 6.7≤Mw≤7.3 and an epicentral distance within the range 14 km≤R≤26 km. The unscaled acceleration response spectra of the ground motion records used for high-seismicity regions are shown inFigure 3B.
The selected ground motion records are scaled one by one in order to match the spectral acceleration of the horizontal elastic spectrum (Krawinkler et al., 2001) of EC8-Part 1 for the 10/50 seismic hazard level at the fundamental period of the structure. The target EC8 elastic spectrum is derived for soil class C. The PGA for the 10/50 seismic hazard level and the site of Sion is taken equal to 0.16 g, while for the high-seismicity earthquakes it is taken equal to 0.40 g.
In order for a SDOF system to be representative of a structural system, an appropriate force-displacement hysteretic model has to be selected. For the timber shear walls, the Wayne–Stewart hysteretic model is adopted herein with the hysteretic parameter values proposed byStewart (1987)for plywood sheathed timber walls (Figure 4). It is worth noticing that similar hysteretic param-eters have been proposed byFiliatrault et al. (2003)for different types of timber walls [i.e., oriented strandboard (OSB), stucco, and gypsum]. The obtained results are therefore applicable to a wide range of timber wall buildings.
Δ F
Fy
Ko
Ku
(β-1)∙Δm
Ku=γ∙Κο
Δm
Fi
r∙Ko
Fi=δ∙Fy
Fu
Kp
Kp=Κο∙(Δy/Δm)α
Fu=ε∙Fy
[image:5.595.307.550.258.381.2]p∙Ko
FIGURE 4|Wayne–Stewart hysteretic model. Assumed hysteretic parameters for wood-frame buildings:α=0.38,β=1.09,γ=1.45,δ=0.25, ε=1.5, andp=0.
The following values of elastic periods of the SDOF systems are assumed in this study:T=0.2, 0.3, 0.45, 0.6, 0.8, 1.0, and 1.5 s. Moreover, the following values of behavior factorsqare examined in accordance with EC8 provisions:q=1, 2, 3, 4, and 5. The yield strengthFyof each SDOF systems is calculated from the ordinate
of the design EC8 spectrum for the 10/50 seismic hazard level for the periodTand theq-factor under investigation. The viscous damping ratioζis assumed equal to 5%. The post-yield stiffness ratior(ratio of post-yield to elastic stiffness) of the SDOF systems is assumed equal to 10%. The same value has been adopted by
Vidic et al. (1994)for the derivation of theq–µ∆relationships of
EC8. Furthermore, it is close to the values proposed byFiliatrault et al. (2003)for different types of timber shear walls (i.e., OSB, Stucco, and Gypsum).
In total, 35 different SDOF systems are examined and 35×80=2800 time history analyses are conducted. For each SDOF system, the median values of the maximum displacement ductility demandsµmax from the 60 low to moderate seismicity
records and the 20 high-seismicity records are calculated. The main difference between high seismicity and low to moderate seismicity records relates to the number of cycles the structure is exposed to (Mergos and Beyer, 2014).
0 5 10 15 0
5 10 15
µ
EC8
µ
max
0 5 10 15
0 5 10 15
µ
pred
µ
max
0 10 20 30
0 10 20 30
µ
EC8
µ
max
0 10 20 30
0 10 20 30
µ
pred
µ
max
0 10 20 30
0 10 20 30
µ
EC8
µ
max
0 10 20 30
0 10 20 30
µ
pred
µ
max
A B
Low-moderate seismicity
High seismicity
All records
Low-moderate seismicity
High seismicity
[image:6.595.50.549.56.462.2]All records
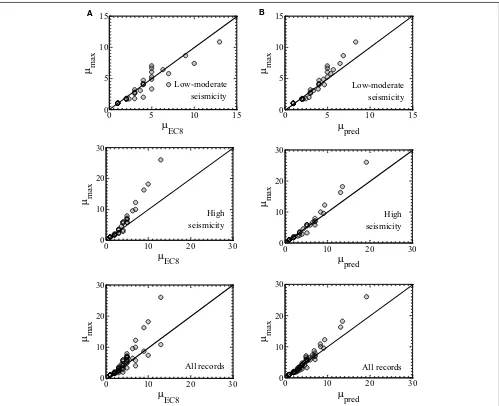
FIGURE 5|Correlation between calculatedµmaxand analytical predictions (A) by EC8 formula; (B) by proposed formulae.
formula adopted in EC8 for correlating displacement ductility and
q-factor. The correlations betweenµEC8andµmaxare summarized
inTable 1. It shows that EC8 formula tends to overpredictµmax
for the low to moderate seismicity regions and to underpredict maximum demands for the high-seismicity regions. When con-sidering both seismicity levels as a single data set, the coefficient of determinationR2is 0.69, the meanµmax/µEC8ratio is 1.06, the
median 1.00, and the coefficient of variation 0.29.
To improve the predictions ofµmax, a new formula is proposed
herein, which builds on the existing formula of EC8, but it is more general by the introduction of two empirical parameters, such as αandβ. The general form of this equation is the following:
T≥TC→µ∆=1+ (q−1)α→q=1+ α
√
µ∆−1
T<TC→µ∆=1+ (q−1)α·
(
TC
T
)β
→q=1+ a √
(µ∆−1)· (
T TC
)β
[image:6.595.304.549.523.613.2]· (6)
TABLE 1|Statistics of the calculated maximum ductility demandsµmax versus analytical predictionsµEC8of EC8.
Seismicity Mean of
µmax/µEC8
Median of
µmax/µEC8
Coefficient of variation of
µmax/µEC8
Coefficient of determinationR2
Low to moderate
0.93 0.97 0.21 0.81
High 1.19 1.14 0.28 0.64
All 1.06 1.00 0.29 0.69
Equation 6 becomes EC8 formula forα=β=1. Furthermore, Eq. 6 gives forq=1 always µmax=1. Furthermore, for T=TC
both relationships (forT≥TCandT<TC) yield the same
predic-tions. Hence, it is always a continuous equation as a function ofT. Parameters, such asαandβ, are evaluated in order to yield the best correlation of the analytical predictionsµpredwith the calculated
TABLE 2|Parameter values and statistics of calculated maximum ductility demandsµmaxversus analytical predictionsµpredof the proposed equation.
Seismicity α β Mean of
µmax/µpred
Median of
µmax/µpred
Coefficient of variation ofµmax/µpred
Coefficient of variation ofR2
Low to moderate 1.00 0.55 1.00 1.00 0.17 0.89
High 1.30 1.00 1.00 1.00 0.17 0.90
All 1.10 1.00 1.00 1.00 0.25 0.69
0 0.02 0.04 0.06 0.08
0 5 10 15 20 25
Displacement (m)
)
Nk
(
ec
ro
F
Actual Bilinear
0 0.05 0.1 0.15 0.2
0 0.2 0.4 0.6 0.8 1 1.2 1.4
Displacement (m)
)g
(
noi
ta
rel
ec
c
A
Capacity Elastic Spectrum Inelastic Spectrum
Perfomance point
A B
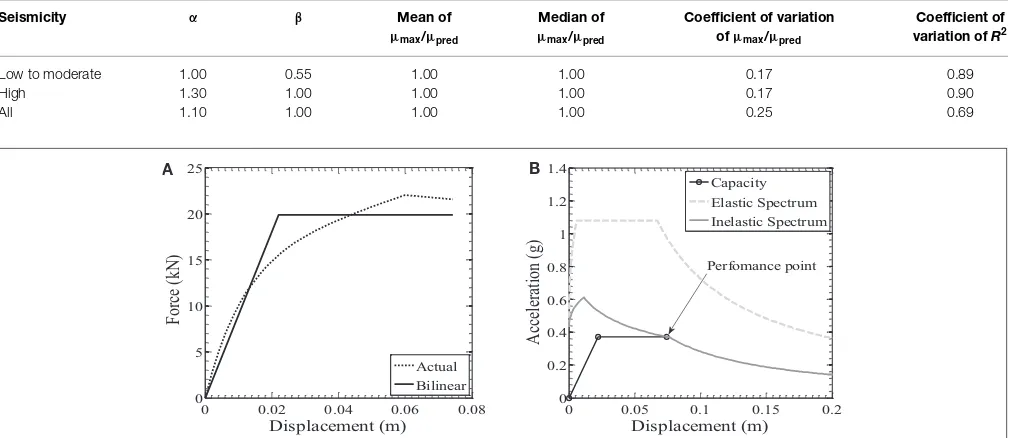
FIGURE 6|Application of the N2 method to the seismic assessment of the timber shear wall test specimen tested byDurham (1998): (A) monotonic force–displacement response of the wall; (B) determination of the performance point.
In the very short-period range (0≤T≤TB), and in order to
assure smooth inelastic spectra for all structural periods, it is proposed that parameterβis replaced byβsgiven by:
βs=1−(1−β)·
T
TB· (7)
Table 2summarizes the proposed parameters values as well as the correlations betweenµpredandµmax. In addition,Figure 5B
illustrates the correlations between the predictions of the pro-posed formula andµmaxfor the case of low to moderate seismicity,
the case of high seismicity and for both levels of seismicity. For all records,Figure 5Bshows the predictions of the combination of equations proposed for the two different seismicity levels and not the prediction of the equation developed when considering records from both seismicity levels as a single data set.
The proposed formulae yields always better results than the EC8 formula. The mean and median ratiosµmax/µpredare equal
to unity. The formulae dealing with either the low to moder-ate seismicity level or the high-seismicity level provide better coefficients of variation (0.17 instead of 0.25) and coefficients of determination (0.89 and 0.90 instead of 0.69) than the formula involving ground motion records for both seismicity levels. This clearly advocates the adoption of different formulas for correlating µmaxandqfor low to moderate and high-seismicity regions in the
case of wood-frame buildings.
Validation of the N2 Method Against
Experimental Results for Wood-Frame
Buildings
To the best of the authors’ knowledge, the N2 method has not yet been validated against experimental results of wood-frame
buildings. To investigate the validity of the method, the N2 method is applied to the assessment of the seismic behavior of a timber shear wall tested on a seismic table byDurham (1998). The dimensions of the wall were 2.4 m×2.4 m. Studs were placed at every 400 mm. Sheathing panels were 9.5 mm thick oriented strand boards with 1.5 GPa elastic shear modulus. Three panels were used to sheath the panel. Sheathing to framing connectors were 50 mm long-spiral nails.
The applied vertical load on the wall was 50 kN and the speci-men was subjected to the E–W component of the 1992 California Earthquake as recorded at Joshua Tree station. The ground motion was scaled to have a peak ground acceleration of 0.36 g. The displacement time history at the top of the specimen was recorded and the maximum displacement was found to be approximately 60 mm.
Using the computer software CASHEW,Folz and Filiatrault (2000, 2001)found that the monotonic forceF–displacementd
response of the timber wall can be approximated by the “actual” envelope curve that is shown inFigure 6A. The part of the curve up to 20% loss of maximum strength is only examined herein.
For the representation of seismic demand, the elastic accelera-tion response spectrum of EC8-Part 1 (Type 1) is adopted with PGA=0.36 g and soil type B (soil factor 1.2). This soil type is chosen because the average shear wave velocityVs,30 of the site
where the accelerogram was recorded is approximately 380 m/s.
Figure 6presents the application of the N2 method to the seis-mic assessment of the timber wall.Figure 6Ashows the actual and equivalent bilinear curves up to the calculated performance point. The bilinear curve is derived by assuming that the elastic branch passes through the point of the actual curve with an ordinate equal to 0.6Fyand that the areas beneath the actual and bilinear curve
are the same. The same procedure is adopted inFEMA-273 (1997)
[image:7.595.46.553.71.290.2]It is important to mention here that the methodology adopted for the derivation of the bilinear envelope curve may affect signif-icantly the accuracy of the results. Hence, it is generally recom-mended that the methodology for deriving the idealized bilinear curves is calibrated against experimental results of timber shear walls. Alternatively, different approaches can be applied and the most conservative results should be adopted.
Figure 6B illustrates the determination of the performance point of the structure as the intersection of the inelastic response spectrum and the capacity curve in the ADRS format. For the determination of the inelastic spectrum, Eq. 6 was applied. The predictions of the N2 method are the following: yield dis-placement dy=22 mm, elastic period T=0.49 s, displacement
ductility demandµ∆=3.40, and maximum developed displace-ment 74 mm. The estimated maximum displacedisplace-ment is 23% higher than the actual one developed during the experimen-tal procedure (60 mm). Furthermore, it is on the side of safety since the predicted displacement is larger than the one mea-sured in the experiment. This occurs because the behavior fac-tor is slightly underestimated for the actual ductility demand. Lowerqvalues drive to higher required design strengths. It is worth pointing out that application of EC8 q–µ∆ relationships
leads to 66 mm maximum displacement prediction, which is only 10% higher than the actual displacement demand. How-ever, overall, the newq–µ∆ relationships provide better
estima-tions of maximum displacements and ductilities as shown in
Figure 5.
Displacement-Based Design
with the N2 Method
Method Description
In this section, a displacement-based seismic design methodology for wood-frame buildings is proposed with the aid of the N2 method. The procedure is displacement driven since it starts with a target displacement that the structure is allowed to develop for a given level of seismicity and calculates the required strength of the wood-frame building. In particular, the design aims at deter-mining the required nailing patterns of the wood-frame building timber walls. The procedure assumes that other structural com-ponents of timber walls like the hold-down or tie-down systems are properly designed. Furthermore, the methodology is only valid for symmetric single-storey wood-frame buildings that can be sufficiently represented by SDOF systems.
The analytical steps of the proposed methodology are the following.
Step 1
For the force capacity and start the sentence directly with: the structural configuration of timber walls apart from the nailing pattern (i.e., dimensions of walls, thickness of sheathing panels) is determined. The seismic demand is represented by an elastic pseudo-acceleration response spectrum (Figure 1). The target displacementdt is established
by the performance level of the building (EC8-Part 3, FEMA-273).
Step 2
The main aim of this step is to determine the yield displacementdy
of the equivalent bilinear forceF–displacementdresponse of the SDOF system. Conveniently, determination ofdycan be done by
using simplifying expressions as the case for other structural types (i.e., reinforced concrete buildings). However, to the best of the authors’ knowledge, these relationships do not yet exist for timber shear walls and consequently for wood-frame buildings.
Wang et al. (2010)conducted pushover analyses, using the com-puter software CASHEW (Folz and Filiatrault, 2000) of timber shear walls with the same structural configuration, but different nailing spacings. After normalizing the backbone curves of the wallsFi–diby the maximum forceFui, they observed that a single
normalized (average) backbone curveFi/Fuiversus displacement
dican be assumed for all nailing spacings with adequate accuracy
(see next section).
Making use of this observation, it is suggested herein that for each timber shear wall structural configuration, a pushover analysis is conducted by assuming a nailing spacing. The obtained
Fi–diis then normalized with respect to maximum strengthFui.
More accurately, pushover analyses for different nailing spac-ings are conducted and normalized and then an average nor-malizedFi/Fui–diis obtained. This normalized backbone curve
is assumed as representative of all nailing spacings. Hence, it is assumed that nailing spacing affects only the maximum shear wall strengthFui.
For the case that the walls are deformed in pure racking mode (without uplift) and consequently they undergo the same lateral top displacement the force capacity of the wood-frame building can be taken as the sum of the timber shear walls force capacities for the same displacement level. Hence, if the building comprises walls with the same structural configuration, the normalized force
F/Fu–ddisplacement relationship of the building is the same as the
normalized backbone curves of the single walls. If the building is composed of different shear walls then the normalized forceF/Fu–
ddisplacement of the building should be obtained by dividing the total forceF–ddisplacement relationship of the building by the force capacity of the buildingFu.
After establishing, the normalized forceF/Fu–ddisplacement
relationship of the building an equivalent normalized elastoplastic bilinear curve is established with yield point (Fy/Fu, dy). It is
important to note that no iterations are required for the deter-mination of the equivalent normalized bilinear curve. This is the case because the displacement of the final point of the equiva-lent bilinear curve (Fy/Fu,dm) (Figure 2) is constant and equal
todt.
Step 3
Here, the elastic and inelastic ADRS are computed. First, the elas-tic ADRS is defined and then by calculating target displacement ductilityµ∆=dt/dyand using Eqs 2, 3, and 6 the inelastic ADRS
is established.
Step 4
From the target displacementdtand the inelastic spectrum, the
required strengthFyt/mis obtained (Figure 7). Hence, required
Step 5
A nailing spacing is selected yielding strength capacityFufor the
building higher thanFut.
Case Study Introduction
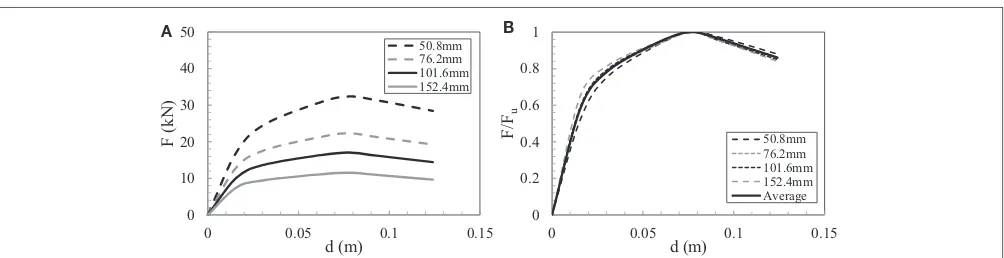
Wang et al. (2010)examined the monotonicFi–direlationship of
timber shear walls with the following structural characteristics: 1.2 m width B and 3.1 m height H, sheathing panels attached to the framing members vertically with 11.1 mm thick OSB attached with dn=3.3 mm diameter (8 dn length) nails.
Inte-rior nail spacing is 305 mm. Four different cases of constant edge (perimeter) nail spacing were examined: 51, 76, 102, or 152 mm. The obtainedFi–direlationships are shown inFigure 8A.
As mentioned in the previous section, Wang et al. (2010)
observed that when normalizing with respect to Fui a
sin-gle (average) backbone curve can be applied for all the dif-ferent values of edge nail spacing (Figure 8B). Furthermore, it was found that the ultimate strength Fui is equal to 32.4,
22.3, 17.1, and 11.5 kN for 51, 76, 102, and 152 mm edge nail spacing, respectively. The displacementdui (corresponding
approximately to 20% loss of maximum strength) is 0.124 m (4% drift).
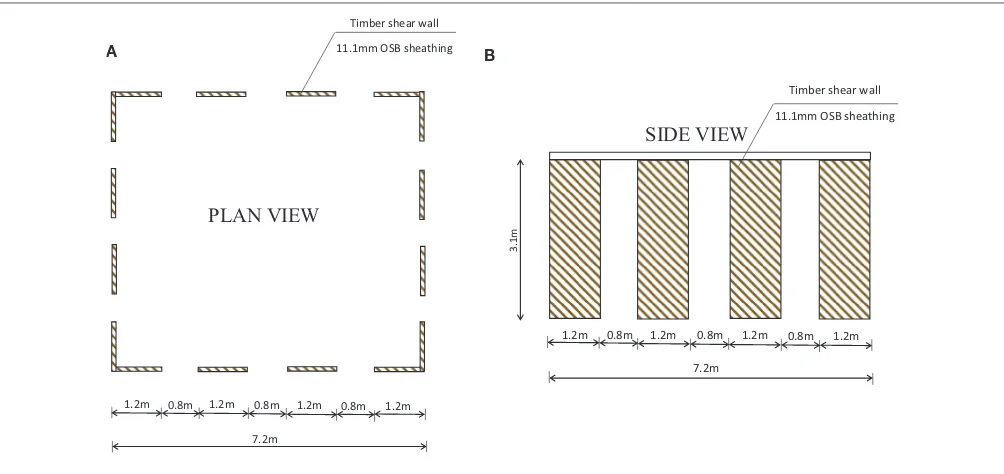
As a design example in this section, it is assumed that a sym-metric in plan single-storey wood-frame building (Figure 9) is composed by eight of these shear walls in each direction. It is also assumed that the walls are deformed in pure racking mode
Sd Sa
Elastic spectrum
Inelastic spectrum
dt Fyt/m
Sae
[image:9.595.45.292.383.504.2]Target point
FIGURE 7|Determination of required strengthFyt/mfor a given target displacementdtwith the N2 method.
0 10 20 30 40 50
0 0.05 0.1 0.15
)
N
k(
F
d (m)
50.8mm 76.2mm 101.6mm 152.4mm
0 0.2 0.4 0.6 0.8 1
0 0.05 0.1 0.15
F
/Fu
d (m)
50.8mm 76.2mm 101.6mm 152.4mm Average
A B
FIGURE 8|Backbone curves of timber shear wall with different nailing patterns (Wang et al., 2010) (A) forceF–displacementd(B) normalized force
F/Fu–displacementd.
(without uplift) and consequently they undergo the same lateral top displacement and their force capacities can be added.
The seismic mass of the building is m=90 ton and the design PGA for the 10/50 seismic hazard level is equal to 0.16 g. The building is constructed on soil type C according to the catego-rization of EC8. The building will be designed to comply with the performance objectives ofTable 3. The design aims at determining the appropriate edge nailing spacing for the construction of the walls.
Design Objectives
The adopted performance levels are similar to the ones used in EC8-Part 3 (CEN, 2005) for other types of structures (i.e., reinforced concrete, steel) apart from the damage limitation (DL) limit state, which is taken herein to coincide with the provisions of EC8-Part 1 for buildings having ductile non-structural elements. For these non-structural elements, the interstorey drift is limited to 0.75% (Table 3). The target displacement for the near collapse (NC) limit stateduis taken equal to the displacement
correspond-ing to 20% loss of maximum strength of a scorrespond-ingle timber shear wall
dui=0.124 m (4% drift). The target displacement at the SD limit
state is taken equal to 0.75·du=0.093 m (3% drift).
The seismic hazard levels for the significant damage (SD) and near collapse (NC) limit states are taken in accordance with the recommendations of EC8-Part 1. The DL limit state is checked indirectly by the multiplication of the target normalized drift
dSD for the SD limit state by the reduction factor ν=0.5 for
importance classes I and II, which accounts for the lower return period of the seismic action associated with this performance level following the approach of EC8-Part 1.
As mentioned previously, the design drifts are approximately
dNC=4% for the NC limit state anddSD=0.75·4=3% for the SD
limit state. However, in order for the DL design objective to be achieved, the following should hold:
dSD·v≤0.75%·H→dSD/H≤0.75%/0.5=1.5% (8)
Consequently, the design should be performed for the following drift limits:dNC=4% (0.124 m displacement) for the 2/50 (2%
is probability of exceedance in 50 years) seismic hazard level, and dSD=1.5% (0.046m displacement) for the 10/50 (10% is
[image:9.595.48.550.552.681.2]1.2m 0.8m 1.2m 0.8m 1.2m 0.8m 1.2m
7.2m
Timber shear wall
11.1mm OSB sheathing
Timber shear wall
11.1mm OSB sheathing
1.2m 0.8m 1.2m 0.8m 1.2m 0.8m 1.2m
m
1.
3
7.2m
A B
PLAN VIEW
[image:10.595.46.548.57.294.2]SIDE VIEW
[image:10.595.45.552.333.580.2]FIGURE 9|Single-storey wood-frame building case study: (A) plan view; (B) side view.
TABLE 3|Performance objectives for seismic design of case-study wood-frame building.
Seismic design performance level
Damage limitation (DL) Significant damage (SD) Near collapse (NC)
Seismic hazard level
– 10% probability of exceedance
in 50 years
2% probability of exceedance in 50 years
Limit state dSD·v≤0.0075·H dSD≤0.75·du dNC≤du
0 0.02 0.04 0.06
0 0.2 0.4 0.6 0.8 1
Displacement (m)
F/
F
u
Actual Bilinear
0 0.05 0.1 0.15
0 0.2 0.4 0.6 0.8 1
Displacement (m)
F/
F
u
Actual Bilinear
A B
FIGURE 10|Bilinearization of normalizedF/Fu–drelationships for the (A) SD limit state; (B) NC limit state.
In order to define the design PGA value for the NC limit state (2/50 seismic hazard level), the following equation, proposed in EC8-Part 1, is used:
ag,NC=ag,SD·
(
PNC
PSD
)−1/3
=0.16g·
( 2 10
)−1/3
=0.16g·1.71=0.27g (9)
whereag,NC is the design PGA for the NC limit state, ag,SD is
the design PGA for the SD limit state,PSD=10% is probability
of exceedance in 50 years for the SD limit state, andPNC=2% is
probability of exceedance in 50 years for the NC limit state.
Bilinearization of Normalized Force–Displacement Relationship
force–displacement envelopes (Figure 10). It is pointed out that since the building is composed by identical timber shear walls the normalizedF/Fu–dbehavior of the building matches theFi/Fu–di
of the single walls.
The 0.6Fyrule for the bilinearization of theF/Fu–dcurve is
used as described in the validation of N2 method section. The target displacements are set equal to the design displacements for each performance level. Hence, an iterative procedure is not required for the bilinearizations.
Figure 10presents the equivalent bilinear elastoplastic curves obtained for the two different limit states. Furthermore,Table 4
presents the characteristic values of the equivalent bilinear curves as well as the respective displacement ductility demandsµ∆.
Inelastic Displacement Spectra
The next step of the design procedure involves the derivation of the elastic and then the inelastic displacement spectra in ADRS format for the displacement ductility demands of the equivalent bilinear curves (Figure 11). For the derivation of the inelastic ADRS spectra, the newq–µ∆ equations proposed in this study
(Eqs 6 and 7) have been applied.
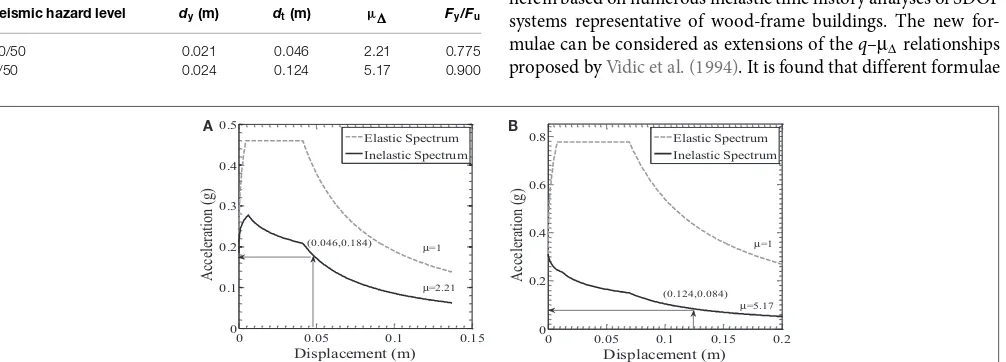
Calculation of Required Strength
From the inelastic ADRS spectra and the target displacements, the requiredFyt/mstrengths can readily be obtained as shown
inFigure 11. In this figure, it can be seen that the Fyt/m for
the 10/50 seismic hazard level is 0.184 g and for the 2/50 seismic hazard level is 0.084 g. Hence, the 10/50 seismic hazard level (for DL limit state) governs the seismic design of this wood-frame building.
The design base shear for the wood-frame building is calcu-lated as
[image:11.595.50.553.496.677.2]Fb,tot=m·Sa=90·9.81·0.184=162kN (10)
TABLE 4|Characteristic values of equivalent bilinearF/Fu–dcurves and displacement ductility demands for the two design seismic hazard levels.
Seismic hazard level dy(m) dt(m) µ∆ Fy/Fu
10/50 0.021 0.046 2.21 0.775
2/50 0.024 0.124 5.17 0.900
0 0.05 0.1 0.15
0 0.1 0.2 0.3 0.4 0.5
Displacement (m)
)g
(
noi
ta
rel
ec
c
A
Elastic Spectrum Inelastic Spectrum
µ=1
µ=2.21 (0.046,0.184)
0 0.05 0.1 0.15 0.2
0 0.2 0.4 0.6 0.8
Displacement (m)
)g
(
noi
ta
rel
ec
c
A
Elastic Spectrum Inelastic Spectrum
(0.124,0.084)
µ=5.17
µ=1
A B
FIGURE 11|Determination of requiredFyt/mstrengths for the (A) 10/50 seismic hazard level and (B) 2/50 seismic hazard level.
This base shear will be carried by the eight shear walls. IfFuti
is the required maximum strength capacity of each of these walls then it becomes
Fb,tot=8·0.775·Futi→Futi= Fb,tot
8·0.775 = 162.45
8·0.775 =26.2kN (11) In the previous equation, the factor 0.775 is taken from the equivalent bilinear curve for the critical 10/50 seismic hazard level (seeTable 4).
Selection of Nailing Pattern
To complete the seismic design, the edge nail spacing that yields ultimate strength Fui for each timber shear wall higher than
26.2 kN should be selected. According to the analyses ofWang et al. (2010), the required ultimate strengthFutilies between the
strengths provided by 50.8 mm edge nail spacing and 76.2 mm edge nail spacing. Hence, 50.8 mm edge nail spacing should be assigned for undertaking the design base shear with safety.
Discussion
Traditional seismic design of wood-frame buildings is force based. However, force-based seismic design does not directly control structural and non-structural damage, which are deformation and/or displacement related. Hence, displacement-based design is a more rational design approach.
Earlier displacement-based design efforts focused on the DDBD approach. Despite the fact that this method has shown to produce promising results for wood structures, it does not fit into the framework of the Eurocode 8 (EC8) provisions, which use as non-linear static assessment method the N2 method.
This study investigates the application of the N2 method to the seismic design of wood-frame buildings. The N2 method requires proper behavior factorqversus displacement ductilityµ∆
relation-ships for the derivation of the inelastic spectra, which do not exist for hysteretic systems representative of wood-frame buildings.
To tackle this limitation, newq–µ∆relationships are proposed
herein based on numerous inelastic time history analyses of SDOF systems representative of wood-frame buildings. The new for-mulae can be considered as extensions of theq–µ∆relationships
should be applied for regions of low to moderate seismicity and for regions of high seismicity since the hysteretic response of wood-frame systems depends strongly on the number of cycles the structure is exposed to (Mergos and Beyer, 2014).
Another limitation of the N2 method relative to its application to wood-frame buildings is the fact that it requires the definition of displacement ductility and subsequently of the yield displacement. The definition of yield displacement is ambiguous for wood-frame buildings that behave strongly non-linearly from the early stages of their lateral response. Hence, validation of the N2 method is required before its application to the seismic design of new buildings.
Since the N2 method has not yet been verified against experi-mental results of wood-frame buildings, a verification case study is examined herein for a single timber shear wall tested on a shake table. It is found that the method overestimates maximum displacement demand by 23%.
A new displacement-based seismic design methodology for symmetric, single-storey wood-frame buildings with the aid of the N2 method is also developed in this paper. The procedure is displacement driven since it starts with a target displacement the structure is allowed to develop for a given level of seismicity
and calculates the required nailing spacing of timber shear walls. The procedure assumes that other structural components of tim-ber walls like the hold-down or tie-down systems are properly designed and remain elastic.
The proposed design approach is applied to the design of a real-istic wood-frame building. The design methodology is computa-tionally efficient since it does not require an iterative procedure. Furthermore, it can be directly incorporated in the framework of performance-based design. However, in its present form, it is limited to SDOF systems. Hence, the extension of the method to multi-storey and/or asymmetric in plan wood-frame buildings that behave as MDOF systems is required.
Acknowledgments
The authors thank the reviewers for their comments that helped to improve the manuscript. Financial support for this research was provided by the Swiss National Science Foundation within project NRP-66 (Resource Wood, Project Nr. 406640-136900). The opinions, findings, and conclusions expressed in this paper are those of the authors and do not necessarily reflect those of the sponsoring organization.
References
CEN. (2004).Eurocode 8: Design of Structures for Earthquake Resistance, Part
1: General Rules, Seismic Actions and Rules for Buildings. Brussels: European Standard EN 1998-1.
CEN. (2005).Eurocode 8: Design of Structures for Earthquake Resistance, Part
3: Assessment and Retrofitting of Buildings. Brussels: European Standard EN 1998-3.
Durham, J. P. (1998).Seismic Response of Wood Shearwalls with Oversized Oriented
Strand Board Panels. MSc Thesis, University of British Columbia, Vancou-ver, BC.
Fajfar, P. (1999). Capacity spectrum method based on inelastic demand spectra. Earthq. Eng. Struct. Dyn.28, 979–993. doi:10.1002/(SICI)1096-9845(199909)28: 9<979::AID-EQE850>3.0.CO;2-1
Fajfar, P. (2000). A nonlinear analysis method for performance-based seismic
design.Earthq. Spectra16, 573–592. doi:10.1193/1.1586128
Fajfar, P., and Gaspersic, P. (1996). The N2 method for the seismic damage
anal-ysis of RC buildings.Earthq. Eng. Struct. Dyn.25, 31–46. doi:10.1002/(SICI)
1096-9845(199601)25:1<31::AID-EQE534>3.0.CO;2-V
Fardis, M. (2009).Seismic Design, Assessment and Retrofitting of Concrete Buildings.
Dordrecht, NY: Springer.
FEMA-273. (1997).NEHRP Guidelines for the Seismic Rehabilitation of Buildings.
Washington, DC: Federal Emergency Management Agency.
Filiatrault, A., and Folz, B. (2002). Performance-based seismic design of
wood-framed buildings.ASCE J. Struct. Eng.128, 39–47. doi:10.1155/2014/240952
Filiatrault, A., Isoda, H., and Folz, B. (2003). Hysteretic damping of
wood framed buildings.Eng. Struct.25, 461–471. doi:10.1016/S0141-0296(02)
00187-6
Folz, B., and Filiatrault, A. (2000).CASHEW – Version 1.0: A Computer Program for
Cyclic Analysis of Wood Shear Walls. Rep. No. SSRP-2000/10, Structural Systems Research Project. San Diego, CA: Dept. of Structural Engineering, Univ. of California.
Folz, B., and Filiatrault, A. (2001). Cyclic analysis of wood shear walls.ASCE J.
Struct. Eng.127, 433–441. doi:10.1061/(ASCE)0733-9445(2001)127:4(433) Fragiacomo, M., Dujic, B., and Sustersic, I. (2011). Elastic and ductile design of
multi-storey crosslam massive wooden buildings under seismic actions.Eng.
Struct.33, 3043–3053. doi:10.1016/j.engstruct.2011.05.020
Giardini, D., Wiemer, S., Fäh, D., and Deichmann, N. (2004).Seismic Hazard
Assessment of Switzerland. Zurich: Swiss Seismological Service.
Krawinkler, H., Parisi, F., Ibarra, L., Ayoub, A., and Medina, R. (2001).
Develop-ment of a Testing Protocol for Woodframe Structures. Richmond, CA: CUREE Publication No. W-02.
Mergos, P. E., and Beyer, K. (2014). Loading protocols for European regions of
low to moderate seismicity.Bull. Earthq. Eng.12, 2507–2530. doi:10.1007/
s10518-014-9603-3
Pang, W., and Rosowsky, D. V. (2009). Direct displacement procedure for
performance-based seismic design of mid-rise wood-framed structures.Earthq.
Spectra25, 583–605. doi:10.1193/1.3158932
Pang, W., Rosowsky, D. V., Pei, S., and Van de Lindt, J. W. (2010). Simplified direct displacement design of six-storey wood-framed building and pretest seismic
performance assessment.ASCE J. Struct. Eng.136, 813–825. doi:10.1061/(ASCE)
ST.1943-541X.0000181
Priestley, M. J. N. (1993). Myths and fallacies in earthquake engineering – conflicts
between design and reality.Bull. NZSEE26, 329–341.
Priestley, M. J. N., Calvi, G. M., and Kowalsky, M. J. (2007).Direct
Displacement-Based Seismic Design of Structures. Pavia: IUSS Press.
Priestley, M. J. N., and Kowalsky, M. J. (2000). Direct-displacement-based seismic
design of concrete buildings.Bull. NZSEE33, 421–444.
Shibata, A., and Sozen, M. (1976). Substitute structure method for seismic design
in reinforced concrete.ASCE J. Struct. Eng.102, 1–18.
Stewart, W. G. (1987).The Seismic Design of Plywood Sheathed Shear Walls. Ph.D.
Thesis, University of Canterbury. Christchurch, New Zealand.
Sullivan, T., Calvi, G. M., Priestley, M. J. N., and Kowalsky, M. J. (2003). The limitations and performances of different displacement-based design methods. J. Earthq. Eng.7, 201–241. doi:10.1142/S1363246903001012
van de Lindt, J. W., and Liu, H. (2006). “Correlation of observed damage and FEMA 356 drift limits: results from one-story wood-frame house shake table tests,” in Proc., 2006 Structures Congress(Reston, VA: ASCE).
Vidic, T., Fajfar, P., and Fischinger, M. (1994). Consistent inelastic design spectra:
strength and displacement.Earthq. Eng. Struct. Dyn.23, 502–521. doi:10.1002/
eqe.4290230504
Wang, Y., Rosowsky, D. V., and Weichiang, P. (2010). Performance-based proce-dure for direct displacement-based design of engineered wood-frame buildings. ASCE J. Struct. Eng.136, 978–988. doi:10.1061/(ASCE)ST.1943-541X.0000188
Conflict of Interest Statement:The authors declare that the research was con-ducted in the absence of any commercial or financial relationships that could be construed as a potential conflict of interest.