Optical pattern formation with a two-level nonlinearity
A. Camara, R. Kaiser, and G. Labeyrie*
Institut Non Lin´eaire de Nice, UMR 7335 CNRS, 1361 route des Lucioles, 06560 Valbonne, France
W. J. Firth, G.-L. Oppo, G. R. M. Robb, A. S. Arnold, and T. Ackemann
SUPA and Department of Physics, University of Strathclyde, Glasgow G4 0NG, Scotland, United Kingdom (Received 15 April 2015; published 13 July 2015)
We present an experimental and theoretical investigation of spontaneous pattern formation in the transverse section of a single retroreflected laser beam passing through a cloud of cold rubidium atoms. In contrast to previously investigated systems, the nonlinearity at work here is that of a two-level atom, which realizes the paradigmatic situation considered in many theoretical studies of optical pattern formation. In particular, we are able to observe the disappearance of the patterns at high intensity due to the intrinsic saturable character of two-level atomic transitions.
DOI:10.1103/PhysRevA.92.013820 PACS number(s): 42.65.Sf,05.65.+b,32.90.+a
I. INTRODUCTION
Spontaneous pattern formation from a homogeneous state is a widespread phenomenon in nonlinear systems out of equilibrium [1,2]. Originating from fields such as chem-istry [3,4] and hydrodynamics [1,5,6], the study of pattern formation has known a rapid development in optics starting from the 1980s [7,8]. Paradigmatic examples such as a Kerr medium [9,10] or a collection of two-level atoms at rest [11] were considered in early theoretical studies. Various nonlinear systems, either active, such as lasers or photorefractive oscillators [8,12,13], or passive, such as liquid crystals [14,15], were used to realize the first experiments. In some range of experimental conditions, these nonlinear materials mimic ideal systems such as the Kerr medium, but one usually lacks a complete theoretical description of the light-matter interaction. Hot atomic vapors were also exten-sively employed to study various optical instabilities [16–20]. There, a theoretical description of the light-atom interaction is available, but the specific experimental conditions (Doppler broadening, hyperfine structure, ballistic or diffusive motion of the atoms) considerably complicate the interpretation. Finally, cold atomic samples have recently been employed in optical pattern formation [21–23].
We have identified, in our single feedback mirror experi-ments, three distinct mechanisms that lead to the spontaneous formation of patterns. The first one, the optomechanical mechanism, is specific to cold atoms and relies on the spatial bunching of the atoms under the action of dipole forces. This mechanism is very efficient at ultracold temperature and leads to spectacular self-organization phenomena [24]. The presence of a Zeeman structure in the atomic ground state (spin degree of freedom) allows for optical pumping, i.e., a redistribution between populations or creation of coherences between Zeeman substates, in particular within the ground state. This mechanism is responsible for the polarization instabilities studied in hot atomic vapors [17,19,20,25,26]. Finally, under specific experimental conditions, the atoms behave as two-level systems and the optical nonlinearity is
*Author to whom correspondence should be addressed.
only due to the saturation of the electric dipole transition, i.e., population transfer between ground and excited states. This is the situation studied in this paper, which realizes the paradigmatic theoretical description of a homogeneously broadened two-level atomic transition [11]. A previous experi-mental investigation of patterns due to a saturable nonlinearity was achieved in a hot sodium vapor [16] and did not report the observation of the vanishing of the effect at large saturations. We present in this paper a detailed experimental investigation of this two-level instability and obtain a qual-itative and quantqual-itative agreement with a theoretical model based only on the microscopic description of the atom-light interaction.
II. EXPERIMENTAL SETUP
The experimental setup, sketched in Fig. 1(a), exploits the single-mirror feedback scheme [10] (see [23] for de-tails). A Gaussian laser beam (referred to as “the pump” in the following) of waist w=1.47 mm and wavelength
λ=780.2 nm is sent through a cold (T =200μK) cloud of Rb87 atoms, released from a large magneto-optical trap (MOT). The cloud has a typical size of 9 mm FWHM along the pump propagation axis and contains 1011atoms. The resulting optical density (OD), for a weak beam on resonance with the F =2→F=3 transition, is around 210. The linearly polarized pump beam is retroreflected by a mirror located at a distanced after the cloud [the vertical arrows in Fig.1(a) indicate the polarization of the beams]. We use an imaging telescope [not represented in Fig.1(a)] located between the MOT and the mirror to create a “virtual mirror,” which provides an access to negative values ofd[27]. The overall reflectivity of the feedback system is around 95% (cloud absorption not included).
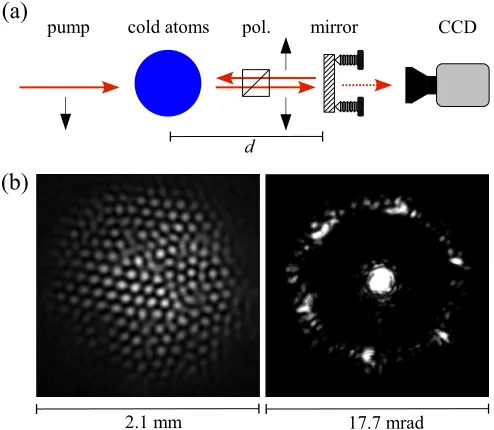
FIG. 1. (Color online) Observation of patterns. (a) Experimental scheme. (b) Typical single-shot light distributions observed in the transverse instability regime, in the near (left) and far (right) field. The pump parameters areI=0.47 W/cm2andδ= +6.5.
occurs in the polarization channel parallel to the incident pump polarization, and prevents the occurrence of a polarization instability linked to Zeeman degrees of freedom. This is confirmed by the fact that almost no light is detected in the polarization channel orthogonal to the pump polarization. Throughout this work, we are thus left with the simplest, two-level nonlinearity corresponding to the following expres-sion for the refractive index of our cloud of cold atoms:
n=1− 3λ 3
4π2
δ/
1+(2δ/ )2
ρ
1+s, (1)
where δ=ωl−ω0 is the detuning between the laser and atomic frequencies,=2π×6.06 MHz is the natural width, and ρ denotes the spatial atomic density. The nonlinearity arises from the presence in this expression of the saturation parameters=II
sat
1
1+4(δ/ )2, whereIsat=1.67 mW/cm2is the saturation intensity. For s1, the gas exhibits a Kerr-like behaviornn0+n2I, wheren0is the linear refractive index andn2is the nonlinear one. Importantly, fors1, the nonlin-earity vanishes and the instability is expected to disappear. In the Kerr regime, the nonlinearity is “self-focusing” (n2>0) for δ >0 and “self-defocusing” forδ <0. Note that Eq. (1) only describes the real part of the complex refractive index, which is responsible for the instability. However, (nonlinear) absorption is also present and included in our theoretical analysis.
[image:2.608.311.558.70.332.2]Figure 1(b) shows images of the transverse intensity distribution of the transmitted pump beam, in the near field (left) and the far field (right). We observe for these parameters contrasted patterns with a clear hexagonal symmetry. However, here the near-field patterns are always divided into several domains with different orientations of the hexagons, and we never observe the long-range order typically associated with the optomechanical nonlinearity [23]. Using parameters different from the optimal set increases the number of such
FIG. 2. Saturation of the instability. We show the evolution of the patterns as the pump intensity is increased : (a) I=0.24, (b)I=0.47, (c)I=1.41, and (d)I=4.24 W/cm2. The detuning isδ= +6.5.
domains, rendering the hexagonal symmetry less obvious (see Fig.2).
III. SATURATION OF THE INSTABILITY
A key feature of the observed instability is the disap-pearance of the patterns for large pump intensity (typically
>2 W/cm2). This behavior is illustrated in Fig.2. Just above threshold [Fig. 2(a)], the patterns appear in a restricted area around beam center. When the pump power is increased, the patterns gain in contrast and spatial extent [Fig.2(b)]. A further increase of the intensity leads to a progressive blurring of the patterns inside an area around beam center, shown in Figs.2(c) and2(d). Note that heating effects due to the increase of pump intensity are negligible because of the short duration of the pump pulse. This pattern blurring is qualitatively different from what is observed, e.g., for the polarization instabilities in hot vapors where no saturation is observed [28]. In our situation, this saturation is intrinsic to the two-level description of the atom-light interaction, as can be seen in Eq. (1) where
n→1 ass→ ∞.
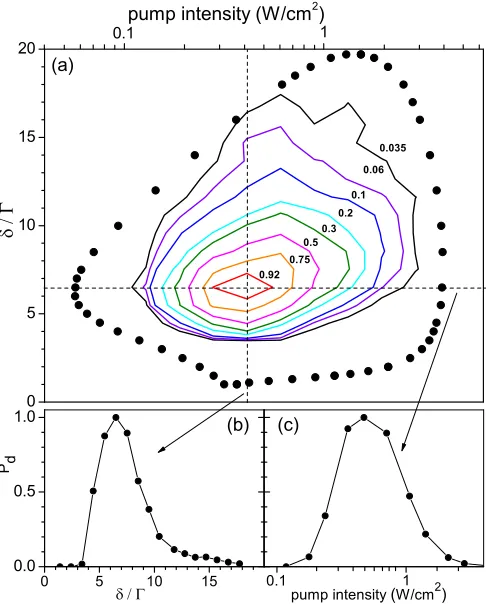
We have investigated the range of parameters where the instability can be observed. The result of this study is summarized in Fig.3(a), where we plot the “diffracted power”
Pd as a function of pump detuning (δ >0) and intensity.Pd is
[image:2.608.49.296.71.286.2]FIG. 3. (Color online) (a) Two-level instability domain (δ >0). We measurePd (see text) as a function ofδandI, and plot the data
as isolines. Note the logarithmic horizontal scale. The dots indicate the theoretical threshold for the instability (see text). (b), (c) Cuts through the 2D chart of (a) as indicated by the dashed lines.
summed, and we extract from the resulting averaged FT image the power in the pattern mode. This quantity is normalized to the power inside the undiffracted beam (central peak in the FT image). We then perform the same operation on images of the pump beam, obtained without atoms. This yields the background power in the pattern mode due to the residual rugosity in the pump’s intensity profile, which is subtracted from the data obtained in the presence of atoms. In addition, in Fig.3,Pd values are scaled such that the maximal value
(obtained forδ=6.5andI =0.47 W/cm2) is 1.
On the blue side of the transition, we observe the patterns between roughlyδ =3.5and 17[Fig.3(b)]. For smaller values ofδ, the patterns vanish quite abruptly. In this
small-δ regime, the cloud is optically thick with two important consequences: first, the strong absorption considerably reduces the magnitude of the feedback, and second, there is a large amount of scattered light with a quite homogeneous spatial distribution, which is expected to blur the transverse field modulation that is responsible for the instability. For large detunings, the patterns also disappear, but much more gradually because of the decrease∝1/δof the refractive index. We observe a well-defined lower-intensity threshold for the instability, around 0.16 W/cm2forδ=6.5[Fig.3(c)]. This threshold is substantially higher than observed for longer pump pulses, where the optomechanical mechanisms sets in [23]. Also, we found that a minimum OD of around 100 is required
to observe the two-level patterns, while this threshold can be considerably lower for optomechanical patterns [23]. The saturation of the nonlinearity results in a gradual vanishing of the instability for large pump intensity (I >2 W/cm2 for
δ =6.5, which corresponds tos≈7).
We compare in Fig. 3(a)our experimental data with the theoretical instability threshold (dots) as obtained using a two-level, thin-medium model. This model is based on the approach of [29], extended to the case of the feedback mirror configuration and with the inclusion of absorption. We also included in our model the longitudinal intensity modulation due the interference of the incident and retroreflected pumps, but without the approximation used in [29]. As can be seen, the qualitative and quantitative agreement is rather satisfactory. We speculate that the discrepancy at smallδmay come from the scattered light (not included in the model), as discussed above.
On the red side of the transition (δ <0), we only observe poorly contrasted structures without clear symmetry. The characteristic spatial scale of these structures is roughly twice that on the blue side. Their domain of observation in (δ,I) space approximately mirrors that of the patterns on the blue side. A full theoretical explanation for this red-blue asymmetry is still lacking. We believe that its origin lies in nonlinear propagation effects taking place inside the cloud. This may not come as a surprise since such effects have been observed in the past in such large cold atom clouds [30]. In that work, we investigated the self-trapping of a Gaussian beam of small waist (20μm) forδ >0, which resulted in a roughly constant transverse size of the beam as it propagated inside the cloud. It is thus reasonable to speculate that if an array of bright spots such as seen in the transverse intensity distribution of Fig.1(b) forms inside the medium, it will be stabilized by self-focusing forδ >0. On the contrary, forδ <0, self-defocusing will tend to blur these structures. For these effects to play a role, one requires the Rayleigh length corresponding to the transverse size of the bright intensity spots to be smaller than the length of the medium. This condition imposes a size for the spots of a few tens of microns, which is what we typically observe.
IV. TALBOT EFFECT AND PATTERN SIZE
The Talbot effect and the associated periodic passage be-tween phase and intensity modulation [31] is at the heart of the transverse instability discussed in this paper. Since we operate well detuned from resonance, a transverse intensity pattern mainly induces a transverse phase modulation. Propagation to the mirror and back can convert this into transverse intensity modulation of the backward field, hence phase modulating the forward field, and so on. For a mirror distance d, the transverse pattern wavelength for which this is optimum obeys2=λd/(N+1/4) in the case of a thin medium and of a self-focusing nonlinearity [10,27]. In this expression,N
is an integer of the same sign as d. Furthermore, the Talbot effect implies that instability thresholds are periodic in mirror distancedwith period2/λ.
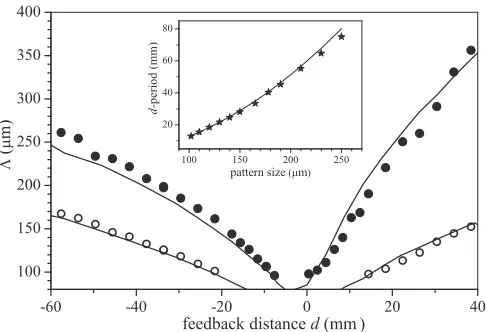
[image:3.608.51.294.71.373.2]FIG. 4. Talbot effect and pattern size (δ >0). We measure(see text) as the feedback mirror distancedis varied (dots: lowestqmode; circles: higherqmode). The line is the prediction of a thick-medium model. Inset: The measureddperiod as a function of the pattern size (stars), together with the Talbot effect prediction (line).
The dots correspond to the lowest-qmode, whereq=2π/. The circles correspond to the next higher-q mode, which is observed only for large|d|. The bold lines are predictions of a thick-medium model, similar to that of Fig.3(a)but including the propagation inside the cloud and neglecting absorption. The Talbot periodicity appears through the fact that the same
q, and hence , is observed for periodically spaced values of d, with the d period being2/λ. This is verified in the inset, where the experimentally observedd period is plotted against(dots) and compared to the expression above (line).
The overall agreement between experiment and theory is very satisfactory, for all instability branches, confirming the validity of the Talbot picture in our situation.
V. CONCLUSION
We demonstrated in this paper the existence of a pattern-forming optical instability in a cloud of cold atoms, based only on the two-level electronic nonlinearity. In this paradigmatic situation, we were able to observe the disappearance of the instability at high optical power, due to the saturation of the nonlinearity. This work demonstrates the interest of cold atomic samples for the field of nonlinear optics and pattern formation, motivated by the fact that several nonlinear mech-anisms coexist and can be selected and studied independently. Understanding and controlling these various mechanisms con-stitutes an important step in the future prospect of extending these experiments to degenerate quantum gases, where the simultaneous self-organization of light and matter can lead to a rich class of physical phenomena [32].
ACKNOWLEDGMENTS
The Strathclyde group is grateful for support by the Leverhulme Trust and EPSRC; the collaboration between the two groups is supported by the Royal Society (London). The Sophia Antipolis group is supported by CNRS, Universit´e de Nice Sophia Antipolis, and R´egion Provence-Alpes-Cˆote d’Azur. We acknowledge fruitful discussions with Dan Gau-thier. W.J.F. also acknowledges the sharing of unpublished work by M. Saffman.
[1] M. C. Cross and P. C. Hohenberg, Rev. Mod. Phys.65, 851 (1993).
[2] M. Meinhardt,Rep. Prog. Phys.55,797(1992).
[3] A. M. Turing,Philos. Trans. R. Soc. London B237,37(1952). [4] Q. Ouyang and H. L. Swinney, Nature (London) 352, 610
(1991).
[5] Lord Rayleigh,Proc. R. Soc. London A93,148(1917). [6] H. B´enard, Ann. Chim. Phys. Ser. 723, 62 (1901).
[7] L. A. Lugiato, M. Brambilla, and A. Gatti,Adv. Atom. Mol. Opt. Phys.40,229(1999).
[8] F. T. Arecchi, S. Boccaletti, and P. L. Ramazza,Phys. Rep.318, 1(1999).
[9] A. Yariv and D. M. Pepper,Opt. Lett.1,16(1977). [10] W. J. Firth,J. Mod. Opt.37,151(1990).
[11] G. Grynberg,Opt. Commun.66,321(1988).
[12] F. T. Arecchi, G. Giacomelli, P. L. Ramazza, and S. Residori, Phys. Rev. Lett.65,2531(1990).
[13] Chr. Tamm,Phys. Rev. A38, R5960(1988).
[14] R. Macdonald and H. J. Eicher,Opt. Commun.89,289(1992); M. Tamburrini, M. Bonavita, S. Wabnitz, and E. Santamato, Opt. Lett.18,855(1993); E. Pampaloni, S. Residori, and F. T. Arecchi,Europhys. Lett.24,647(1993).
[15] R. Neubecker, G.-L. Oppo, B. Thuering, and T. Tschudi,Phys. Rev. A52,791(1995).
[16] G. Grynberg, E. Le Bihan, P. Verkerk, P. Simoneau, J. R. R. Leite, D. Bloch, S. Le Boiteux, and M. Ducloy,Opt. Commun. 67,363(1988).
[17] G. Grynberg, A. Maˆıtre, and A. Petrossian,Phys. Rev. Lett.72, 2379(1994).
[18] T. Ackemann and W. Lange,Phys. Rev. A50,R4468(1994). [19] T. Ackemann and W. Lange,Appl. Phys. B72,21(2001). [20] A. M. C. Dawes, L. Illing, S. M. Clark, and D. J. Gauthier,
Science308,672(2005).
[21] J. A. Greenberg, B. L. Schmittberger, and D. Gauthier,Opt. Express19,22535(2011).
[22] J. A. Greenberg and D. J. Gauthier,Phys. Rev. A86,013823 (2012); ,Europhys. Lett.98,24001(2012).
[23] G. Labeyrie, E. Tesio, P. M. Gomes, G.-L. Oppo, W. J. Firth, G. R. M. Robb, A. S. Arnold, R. Kaiser, and T. Ackemann,Nat. Photon.8,321(2014).
[24] K. Baumann, C. Guerlin, F. Brennecke, and T. Esslinger,Nature (London)464,1301(2010).
[25] D. J. Gauthier, M. S. Malcuit, and R. W. Boyd,Phys. Rev. Lett. 61,1827(1988).
[26] A. Aumann, E. B¨uthe, Yu. A. Logvin, T. Ackemann, and W. Lange,Phys. Rev. A56,R1709(1997).
[28] W. Lange, A. Aumann, T. Ackemann, and E. B¨uthe,Quantum Semiclass. Opt.10,R23(1998).
[29] G. A. Muradyan, Y. Wang, W. Williams, and M. Saffman, Nonlinear Guided Waves and Their Applications Technical Digest (CD)(Optical Society of America, 2005), paper ThB29.
[30] G. Labeyrie and U. Bortolozzo,Opt. Lett.36,2158(2011). [31] G. D’Alessandro and W. J. Firth, Phys. Rev. Lett.66, 2597
(1991).