June 2016 1
1 Outlook and appraisal
Brian Ashcroft, Economics Editor, Fraser of Allander Institute
Overview
Output and jobs growth in the Scottish economy has weakened since we last reported in March 2016. After GDP data revisions it is now clear that with growth of only 0.1% in the second quarter last year and then a fall of -0.1% in the third quarter, the Scottish economy came perilously close to a recession in 2015 and despite the slight upturn to 0.2%; growth in the fourth quarter may fail to avoid a recession in the coming months. In the fourth quarter, Scotland had to rely solely on the service sector for growth as the contribution of construction faded away to zero with the stimulus from infrastructure spending disappearing. Slight negative growth in the production sector meant that the recession in the sector continued with negative growth having occurred in three successive quarters. Within production, manufacturing technically emerged from recession with fourth quarter growth of 0.3% after experiencing falling output in the previous two quarters. But despite that, manufacturing growth in Scotland can only be described as weak. Moreover, even though services registered growth of 0.3% in the final quarter of last year, UK services grew three times faster and performance in all principal private subsectors in Scotland is appreciably weaker than their UK counterparts. Financial services are especially weak and the weakness of business services growth has been exacerbated by the effects of the fall in the price of oil.
The latest labour market data revealed a significant deterioration in performance as the job shedding associated with the consequences of the oil price fall and deteriorating export performance began to bite. In the quarter to March 2016 the numbers in work fell by 53,000 (-2.0%) to 2,578,000. The last time there was a fall in jobs of this scale was back in early 2010. Unemployment rose by 8,000 (+4.8%) to 169,000 with the rate rising to 6.2%, compared to 5.1% in the UK, a gap that is now the largest since mid-2004. Over the year, Scottish jobs fell by -45,000, a fall of -1.7%. Unemployment in Scotland rose by 2,000 over the year, or by 1%. The numbers inactive rose in Scotland in the quarter by 49,000 or by 3.1%, while over the year, inactive numbers rose by 59,000 (3.7%) in Scotland. As a result of this downturn in the labour market, by the end of the first three months of this year the gap between Scotland’s and the UK’s employment performance had widened considerably with Scottish jobs as reported in the LFS household surveys 0.9% above their pre-recession peak, compared to UK jobs which were 6.3% above peak.
June 2016 2 corresponding quarter of 2014. This fall will clearly have helped sustain household spending either by households saving less or borrowing more. However, a close look at the data reveals that the ratio fell from 9.1% to 6.8% between 2014q4 and 2015q1, then fell a little further to 6.3% in the second quarter and essentially remained there for the rest of the year. By the end of the year the effect of the fall in the saving ratio was fading away as households possibly started to rein back their borrowing and spending. In addition, wage growth remains weak while the housing market seems to be weakening, which is also likely to have a detrimental effect on household spending. It might also be the case that uncertainty about the outcome of the BREXIT referendum on 23rd June might be encouraging companies to postpone investment plans until the issue about Britain’s economic relationship with the EU is clarified. In this context it is worth noting that net trade has made a negative contribution to Scotland’s GDP growth in 4 of the last 5 quarters, while Scottish exports (including trade with rest of UK) in current market prices have actually been falling since 2014 and Scottish manufacturing exports to the rest of the world fell in real terms in the second half of last year.
So, we must conclude that household demand and fixed investment will continue to drive growth in Scotland but with the stimulus from household spending and fixed investment weakening while net trade continues to have a negative effect as the rate of growth in Scotland’s main export markets is predicted to fall. In addition, the continuation of the UK Government’s austerity programme means that there is little hope of a compensating boost to growth from this component of demand.
Against this background we have revised down our GDP (output) forecast for this year from 1.9% in March 2016 to 1.4%. This downward revision is driven by slow investment growth, the continuing effects of the fall in the price of oil on household incomes and spending, a general slowing in household spending as the rate of household borrowing diminishes and a worsening demand for Scottish exports as global growth and growth in Scotland’s key export markets slows. We are forecasting growth of 1.9% in 2017 a downward revision to our March forecast of 2.2%, due to an anticipated weakening of both domestic and export demand for goods and services produced in Scotland compared to our March forecast. We are now forecasting 2018 and our prediction is that there will be growth of 2.0% as the economy returns to trend.
We have revised down our forecasts of employee jobs because of the deteriorating conditions in the Scottish labour market. The number of total employee jobs is still forecast to increase in each year with the number of jobs at the end of 2016 forecast to be 2,445,650, an increase of 1.2% during 2016. Our new central forecast is that the Scottish economy will add 28,650 jobs in 2016, down by around 8,000 from our March forecast, with a net of 39,450 jobs added in 2017, down by more than 7,000 from our March forecast. Jobs growth in 2018 is forecast to be 47,379. On unemployment, the deterioration in many labour market indicators over the last four months, and the revision downwards of growth performance of Scotland in 2016 cause us to revise up our forecasts for unemployment in both levels and rates. Our latest forecasts for the unemployment rate in Scotland for the end of 2016 is now 6.9%, with our forecast for this to fall to 6.7% and then 6.2% by the end of 2017 and 2018, respectively.
June 2016 3
Economic Strategy published by the Scottish Government in March of last year is the latest of many
growth strategies produced by Scottish governments since devolution. All of these strategies provide a strategic framework grounded in mainstream economic development theory, which essentially see economic growth as the consequence of productivity growth stimulated through the promotion of specific ‘supply-side’ change: improvements in innovation and R&D, enterprise, investment, competition, and skills. But all of these strategies, including the current one, were stronger on the ‘what’ of growth promotion with much less emphasis on the ‘how’. In other words, there needs to be more thought and debate on the operationalisation and implementation of the promotion of innovation, enterprise, investment and skills formation in Scotland. It is not new strategies the Scottish economy needs but clear insights and policy action on the implementation of Scotland’s Economic Strategy. In view of this, we welcome the recent creation of the new Economy Secretary post in the Scottish Government and particularly welcome the new Cabinet Secretary Keith Brown’s early initiative in instituting a review of Scotland’s enterprise and skills agencies. If this review is undertaken in a positive way to help enhance the operational impact of the agencies, it could mark the beginning of a process where strategy
implementation moves centre stage in economic policy in Scotland.
The Fraser of Allander Institute also welcomes the appointment of the new Cabinet Secretary for Finance, Derek Mackay MSP. The Scottish Parliament’s new fiscal powers give the Scottish budget a greater fiscal and economic importance. To reflect this, the Fraser of Allander Institute is initiating a new, annual event - “Scotland’s Budget” - to provide informed and independent economic and fiscal analysis of the opportunities and consequences of Scotland’s new fiscal freedoms. To coincide with the event - be held in Edinburgh in September 2016 - the Fraser will publish a special ‘Scottish Budget’ edition of the Economic Commentary that will provide: an outlook for Scottish economy; an overview of the UK public finances and the implications for Scotland; an outline of Scotland’s new fiscal framework; the outlook for the Scottish Budget; and, the choices facing the Cabinet Secretary and the likely impacts of alternative policy responses.
Recent GDP performance
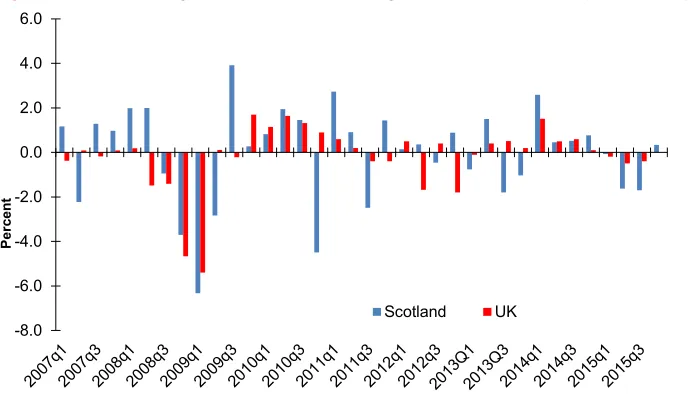
The latest Scottish GDP data are for the fourth quarter of last year (2015q4). The chained volume measure of GDP rose by 0.2% in Scotland in the quarter, while UK GDP rose by 0.6%. Over the year – four quarters on four quarters – Scottish growth was weaker than UK growth at 1.9% compared to 2.3%. However, the marked weakening of Scottish growth from the second quarter of last year means that the growth between the fourth quarter of 2015 and the fourth quarter of 2014 of 0.9% is, in present circumstances, a better indication of annual Scottish growth compared to the UK where growth was 2.1%. It is also worth noting that Scottish GDP growth in the third quarter of last year was revised downwards in the latest release to a fall of -0.1% compared to a rise of +0.1% on the earlier data. It is now clear with growth of only 0.1% in the second quarter the Scottish economy came perilously close to a recession in the second and third quarters of last year and despite the upturn in the figures for the fourth quarter may yet not escape a recession in the coming months. The Scottish and UK quarterly growth rates back to 2007q1 are presented in Figure 1.
June 2016 4 Scottish and UK GDP growth in recent quarters has meant that the UK recovery from the Great Recession has strengthened farther relative to Scotland as is shown in Figure 2a.
[image:4.595.87.401.218.418.2]By the fourth quarter, Scottish GDP was 3.1% above the pre-recession peak while UK GDP was 6.8% above its peak. Growth from the trough of the recession to the fourth quarter last year amounts to 8.5% in Scotland and 13.9% in the UK.
Figure 1:Scottish and UK Quarterly GDP Growth, 2007q1 - 2015q4
Source: Scottish Government GROSS DOMESTIC PRODUCT 4th QUARTER 2015, and (FAI) calculations
Figure 2a:GDP, Scotland and UK: in recession and recovery to 2015q4 (relative to pre-recession peak)
Source: Scottish Government GROSS DOMESTIC PRODUCT 4th QUARTER 2015, and FAI calculations -2.5
-2.0 -1.5 -1.0 -0.5 0.0 0.5 1.0 1.5
P
er
ce
nt
Scotland UK
90.00 92.00 94.00 96.00 98.00 100.00 102.00 104.00 106.00 108.00
Scotland GVA UK GVA
-6.2% -5.0%
[image:4.595.87.427.496.693.2]June 2016 5 As noted in previous Commentaries, Scottish Government statisticians are now producing GDP per head data, which in many ways is a better measure of the prosperity of people in Scotland. In addition, recent years have seen high inward migration into the UK and Scotland, so in assessing the performance of the economy of over time we really need to control for changing population. Data for recession and recovery in GDP per head in Scotland and the UK are presented in Figure 2b.
Figure 2b:GDP per head, Scotland and UK: in recession and recovery to 2015q4
Source: Scottish Government GROSS DOMESTIC PRODUCT 4th QUARTER 2015, and FAI calculations
Figure 3:GDP (ex oil & gas), Scotland and UK: in recession and recovery to 2015q4
Source: Scottish Government GROSS DOMESTIC PRODUCT 4th QUARTER 2015, and FAI calculations 88
90 92 94 96 98 100 102
Q1 Q2 Q3 Q4 Q1 Q2 Q3 Q4 Q1 Q2 Q3 Q4 Q1 Q2 Q3 Q4 Q1 Q2 Q3 Q4 Q1 Q2 Q3 Q4 Q1 Q2 Q3 Q4 Q1 Q2 Q3 Q4 Q1 Q2 Q3 Q4
2007 2008 2009 2010 2011 2012 2013 2014 2015
Scotland UK
-7.0%
-5.9%
+1.0%
-0.2%
90.00 92.00 94.00 96.00 98.00 100.00 102.00 104.00 106.00 108.00 110.00
Q1 Q3 Q1 Q3 Q1 Q3 Q1 Q3 Q1 Q3 Q1 Q3 Q1 Q3 Q1 Q3 Q1 Q3
2007 2008 2009 2010 2011 2012 2013 2014 2015
Scotland UK
-5.0%
-6.1%
+7.9%
[image:5.595.88.418.507.716.2]June 2016 6 In the fourth quarter UK GDP per head stood at +1.0% above its pre-recession peak, whereas in Scotland GDP per head was -0.2% below pre-recession peak. Clearly, the relative weakening of Scottish economic growth is now affecting GDP per head with the gap between the UK and Scotland widening (1.2% points) compared to the previous quarter (0.5% points).
Returning to the overall GDP data we now allow for the complicating factor of oil and gas production, which for offshore production is included in the UK GDP data but not in the Scottish data. Removing oil and gas production from UK GDP data gives us Figure 3.
When oil and gas production is removed, we find again that the gap in the strength of the recovery widens further in the UK’s favour. UK GDP (ex oil & gas) stands 7.9% above the pre-recession peak compared to 3.1% in Scotland. The long period of weak UKCS oil and gas production has slowed the recovery of UK GDP from recession. So, UK GDP - ex oil & gas - has had an even stronger recovery from recession than Scottish GDP. Scottish GDP has recovered by 8.5% since the trough of recession while UK GDP - ex oil & gas – has recovered by 14.8% from its trough by 2015q4, compared to 13.9% when oil and gas output is included. In the latest quarter, UK GDP ex oil and gas rose by 0.65% - a little faster than the 0.56% reported when oil & gas is included - and by 2.2% over the year, four quarters on four quarters.
Sectoral Components of GVA growth
Turning now to individual sectors of the economy, we see a continuation of the convergence in the pattern of growth between Scotland and the UK, which we highlighted in the previous Commentary. In the UK, the service sector was again by far the main driver of the overall growth rate of 0.6% by contributing growth of +0.7% points. In Scotland the service sector was also the main driver of growth contributing +0.2% points to overall growth of 0.2%. The construction sector, which was the main driver of Scottish growth in the second quarter and contributed slightly by only +0.1% in the third quarter, had a zero contribution to growth in the fourth quarter as in the UK. The production sector made a very slight negative contribution to growth in Scotland in the fourth quarter while making a small negative contribution of -0.1% in the UK. Within production, manufacturing in both Scotland and the UK made an insignificant contribution to growth. In Scotland mining & quarrying made a negative contribution to growth of -0.1% points, with the other production sub-sectors neither providing a positive or negative contribution to Scottish growth. The production sub-sectors in the UK all made a zero contribution to growth. These data continue to offer evidence of the continuing reliance of both the UK and Scottish economies on service sector growth and the failure to rebalance in favour of manufacturing which was the express desire of the UK Government.
Service sector
June 2016 7 Figure 4:Scottish and UK Services GVA Growth 2007q1 to 2015q4
Source: Scottish Government GROSS DOMESTIC PRODUCT 4th QUARTER 2015, and FAI calculations
Figure 5:Services GVA, Scotland and UK: in recession and recovery to 2015q4
Source: Scottish Government GROSS DOMESTIC PRODUCT 4th QUARTER 2015 and FAI calculations
The state of the recovery in Scottish and UK services is presented in Figure 5. After experiencing a shallower but more drawn out recession in Scotland of -3.3% compared to -4.2% in the UK, output in the sector stood at 3.5% above its pre-recession peak by the fourth quarter of last year very significantly less than the 11.9% above peak achieved in the UK.
-2.0 -1.5 -1.0 -0.5 0.0 0.5 1.0 1.5
P
er
ce
nt
Scotland UK
90.00 95.00 100.00 105.00 110.00 115.00
Scotland UK
-3.3% -4.2%
[image:7.595.87.427.404.621.2]June 2016 8 So, continuing weaker service sector growth in the fourth quarter in Scotland meant that the gap between the scale of the recoveries widened further in favour of the UK to +8.4% points. As noted in the previous Commentary, the effect of the slowdown in the oil & gas industry due to the low price of oil is affecting business services and the service sector as a whole in Scotland much more than the UK, because of the concentration of the oil-services supply chain in Scotland. However, the weakness of Scottish services is also more general and due to other reasons since UK services have now grown faster than Scottish services for the past eight quarters.
Production / Manufacturing sector
[image:8.595.89.436.406.603.2]The production sector has been the key driver of Scotland’s recovery. However, since the first quarter of 2015 it slipped into recession and during the final three months of last year output was still falling. Even so production overall has grown by 8.5% since the trough of the recession equal to the 8.6% achieved by the economy as a whole. This contrasts with the growth of 6.2% in the Scottish service sector since the trough of the recession. In the UK, the production sector remains a drag on the recovery with growth of 2.0% since the trough of the recession compared to the 13.9% growth of overall GDP and 14.8% for GDP ex oil & gas. Scottish production output fell in the fourth quarter by -0.1% while UK production contracted even more by -0.4%. Over the year - four quarters on four quarters – Scottish production GVA fell by -0.2%, while UK production output rose by 1.0%.
Figure 6:Manufacturing GVA, Scotland and UK: growth at constant basic prices 2007q1 to 2015q4
Source: Scottish Government GROSS DOMESTIC PRODUCT 4th QUARTER 2015, and FAI calculations
Within production, Mining & quarrying GVA contracted by 2.3% in the fourth quarter and contracted by -1.3% over the year (UK mining & quarrying contracted by -2.2% and grew by 6.9%, respectively). Electricity & gas supply GVA contracted by -0.8% in the fourth quarter but rose by 1.5% over the year (UK electricity & gas supply contracted by -2.2% and by -0.2%, respectively). In the fourth quarter, GVA in Scottish manufacturing rose by 0.3% but fell by -1.1% over the year, while UK manufacturing output rose by 0.1% in the quarter but falling by -0.3% over the year. Figure 6 charts the quarterly percentage changes in GVA in Scottish and UK manufacturing.
-8.0 -6.0 -4.0 -2.0 0.0 2.0 4.0 6.0
P
er
ce
n
t
June 2016 9 Figure 6 makes clear that Scottish manufacturing was subject to a brief recession during the second and third quarters of last year emerging in the fourth quarter with a small degree of positive growth. UK manufacturing was subject to a less severe recession over the first three quarters of last year with growth effectively stagnating in the fourth quarter.
[image:9.595.89.425.223.433.2]Figure 7 shows the impact of the latest data on the manufacturing sector's recovery from recession.
Figure 7:Manufacturing GVA, Scotland and UK: in recession and recovery to 2015q4
Source: Scottish Government GROSS DOMESTIC PRODUCT 4th QUARTER 2015, and FAI calculations
By the fourth quarter of last year Scottish manufacturing GVA was -7.6% below its pre-recession peak, compared to -6.5% for manufacturing in the UK. Manufacturing growth in both Scotland and the UK is now clearly weak after picking up in 2013 and 2014. As we noted in the previous Commentary, it is a matter of deep concern that the level of manufacturing output in both Scotland and the UK as a whole is lower than the level it was at in the third quarter of 2010. In Scotland, the level of manufacturing output was 2% lower in the final three months of last year than it was in the third quarter 2010.
Within manufacturing, only three of the seven principal sectors experienced growth in the third quarter: refined petroleum, chemical & pharmaceutical products (accounting for 13% of manufacturing GVA) grew by 5.3% in the quarter and by 4.1% over the year; food & drink (accounting for 27% of manufacturing GVA) grew by 1.6% in the quarter and by 4.4% over the year; and transport equipment (accounting for 7% of manufacturing GVA) grew by 1.0% in the quarter and by 2,5% over the year. However, that growth performance was offset by the four manufacturing sub-sectors that contracted in the quarter: computer, electrical and optical products (electronics) (accounting for 10% of manufacturing GVA), contracted by 4.0% in the quarter and by -0.3% over the year; metals, metal products & machinery n.e.c. (accounting for 17% of manufacturing GVA) contracted by 1.5% in the quarter and by -13.9% over the year; textiles, clothing & leather products (accounting for 4% of manufacturing GVA) contracted by 1.2% in the quarter and by -1.8% over the year; and other manufacturing industries, repair
80.00 85.00 90.00 95.00 100.00 105.00
Scotland UK
-13.2% -12.5%
-6.5%
June 2016 10 & installation (accounting for 24% of manufacturing GVA) contracted by 1.0% in the quarter and by -2.2% over the year.
Construction sector
[image:10.595.94.405.231.411.2]Turning now to construction, the latest data are presented in Figure 8.
Figure 8: Scottish & UK Construction GVA: volume growth 2007q1 - 2015q4
Source: Scottish Government GROSS DOMESTIC PRODUCT 4th QUARTER 2015, and FAI calculations
Figure 9:Construction, Scotland and UK: in recession and recovery to 2015q4
Source: Scottish Government GROSS DOMESTIC PRODUCT 4th QUARTER 2015, and FAI calculations -10
-8 -6 -4 -2 0 2 4 6 8 10
%
Scotland UK
75.00 80.00 85.00 90.00 95.00 100.00 105.00 110.00 115.00 120.00
Scotland UK
-18.9% -22.7%
+16.7%
[image:10.595.91.424.497.693.2]June 2016 11 Scottish construction GVA was almost stagnant in the final quarter of last year with growth of only 0.1%. The major boost to construction provide by public infrastructure projects in Scotland appears now to have dissipated. Over the year the sector still grew by a remarkable 19.5% but the sector has clearly now entered a new weaker phase. The UK construction sector grew by 0.3% in the fourth quarter and by 3.4% over the year. Figure 9 shows the recession and recovery performance of both the Scottish and UK construction sectors.
Figure 9 shows the public infrastructure driven surge in Scottish construction activity from the final quarter of 2013 and then flattens out after the second quarter of last year as that surge came to an end. The chart shows that by the 2015q4 Scottish construction had moved to 16.7% above its pre-recession peak compared to UK construction, which was -3.5% below its pre-recession level.
Within services, two of the three principal sub-sectors in the private sector posted positive growth in the fourth quarter: business and financial services and distribution, hotels and catering. Business and financial services grew slightly by 0.3% in the quarter and grew by 1.0% over the year, compared respectively, to growth of 0.7% and 2.7% in the UK. Figure 10 shows the growth of the sector in Scotland and UK during the recession and recovery.
[image:11.595.88.413.422.632.2]Components of private services sector growth
Figure 10: Business & Financial Services, Scotland and UK: in recession and recovery to 2015q4
Source: Scottish Government GROSS DOMESTIC PRODUCT 4th QUARTER 2015, and FAI calculations
By the fourth quarter, business and financial services output or GVA remained +7.3% above its pre-recession peak in Scotland compared to +15.1% in the UK. The sector in Scotland continues to lag its UK counterpart and the effect of the low oil price on activity in oil and gas support firms, which are classified to business services may have contributed to a widening of the gap between the performance of the sector in Scotland and the UK. The aggregate GVA data for business and financial services in
86.00 93.00 100.00 107.00 114.00 121.00
Scotland UK
-5.6% -4.8%
June 2016 12 Scotland have recently masked significant weakness in the performance of financial services. Figure 11 shows what has been happening to financial services since peak output in the second quarter of 2008.
Figure 11:Financial Services in Scotland: in recession and recovery 2007q2 to 2015q4
Source: Scottish Government GROSS DOMESTIC PRODUCT 4th QUARTER 2015, and FAI calculations
After growth of 1.4% in the fourth quarter last year GVA in the sector was -13.0% below the pre-recession peak compared to the trough of -15.5% in 2012q4. Despite the recent pick up in performance the value of output fell by -2.6% over the year and it seems unlikely that the scale of the financial services sector in Scotland will return to the levels seen before the Great Recession in the foreseeable future.
Figure 12: Transport, Storage & Communication, Scotland and UK: in recession & recovery to 2015q4
Source: Scottish Government GROSS DOMESTIC PRODUCT 4th QUARTER 2015, and FAI calculations 75.00
80.00 85.00 90.00 95.00 100.00 105.00
-13.0%
-15.5%
70.00 75.00 80.00 85.00 90.00 95.00 100.00 105.00 110.00 115.00
Scotland UK
-15.3% -8.9%
+10.5%
[image:12.595.94.432.514.725.2]June 2016 13 The second of the two principal sub-sectors in private services displaying positive growth in the fourth quarter was transport, storage & communication, which grew by 1.5% in Scotland and by 1.2% in the UK. Over the year, growth was 0.3% in Scotland and 4.3% in the UK. Figure 12 indicates that the recession was deeper and more prolonged in the Scottish sector with output falling by -15.3% compared to -8.9% in the UK. Thereafter, the Scottish sector has largely stagnated but that has not been the case in the UK. By the end of the fourth quarter GVA in the Scottish sector was -10.2% below its pre-recession peak compared to +10.5% above in the UK, a huge difference in the performance of the sector between Scotland and the UK.
[image:13.595.92.434.356.564.2]The other principal sub-sector in private services is distribution, hotels and catering (accounting for 18% of services sector output in Scotland), which covers the Scottish high street, accommodation and restaurants and captures some of the impact of tourism. The sector exhibited falling output in the fourth quarter. GVA fell slightly by -0.3% in the quarter but rose by 1.8% over the year. In the UK, the sector grew by 1.4% in the quarter and by 4.7% over the year. Figure 13 shows the performance of the sector during recession and recovery.
Figure 13:Distribution, Hotels & Catering, Scotland and UK: in recession and recovery to 2015q4
Source: Scottish Government GROSS DOMESTIC PRODUCT 4th QUARTER 2015, and FAI calculations
Figure 13 reveals that by the fourth quarter the sector in the UK was +11.1% above its peak, while the sector in Scotland continued to do much worse at only +4.1% above peak. The scale of the recession in the sector in Scotland at -5.3% was much less than the loss of output in the sector in the UK, which amounted to -9.4%. The track of the recovery in the sector picked up in the UK from 2012q4 but continued at much the same slow pace in Scotland, with the level of GVA in the sector in the UK relative to the pre-recession peak overtaking Scotland in the final three months of 2013.
Finally, output in Government & Other Services in Scotland in the fourth quarter rose by 0.3% compared to a rise of 0.4% the UK. Over the year, output in the public sector grew by 0.5% in Scotland and by 0.7% in the UK. Figure 14 shows the performance of GVA in the sector in recession and recovery.
80.00 85.00 90.00 95.00 100.00 105.00 110.00 115.00
Scotland UK
-5.3%
-9.4%
+11.1%
June 2016 14 Figure 14:Government & Other Services, Scotland and UK: in recession and recovery to 2015q4
Source: Scottish Government GROSS DOMESTIC PRODUCT 3rd QUARTER 2015, and FAI calculations
By the fourth quarter GVA in the sector in the UK was 8.1% above the pre-recession peak, which, as noted many times in previous Commentaries, is difficult to understand at a time of fiscal consolidation, whereas output in the sector in Scotland was 1.5% above its pre-recession peak.
The Labour Market
The latest labour market data for January - March 2016 (see Scottish Labour Market section below) reveals a significant deterioration in labour market performance. In the quarter to March 2016 employment fell by 53,000 (-2.0%) to 2,578,000. The last time there was a fall in jobs of this scale was back in early 2010. Unemployment rose by 8,000 (+4.8%) to 169,000 with the rate rising to 6.2%. In the UK, employment rose weakly, with 44,000 jobs created or an increase of 0.14%, while unemployment again fell but slightly by -2,000 (-0.13%) with the rate remaining unchanged at 5.1%. The gap between the Scottish and UK unemployment rate is now at its largest since mid-2004. Over the year, Scottish jobs fell by -45,000, a fall of -1.7%, while UK jobs rose 409,000, or 1.3%. Unemployment in Scotland rose by 2,000 over the year, or 1%, while in the UK unemployment continued to fall by 139,000, or -7.6%. The numbers inactive rose in Scotland in the quarter by 49,000 or 3.1%, compared to an identical rise of 49,000 in the UK or 0.3%. Over the year, inactive numbers rose by 59,000 (3.7%) in Scotland and by 109,000, or 0.6% in the UK.
Figure 15 shows the performance of employment in Scotland and the UK during recession and recovery to the first quarter of this year i.e. 2016q1.
96.00 98.00 100.00 102.00 104.00 106.00 108.00 110.00
Scotland UK +8.1%
June 2016 15 Figure 15:Total Employment: Scotland and UK: pre-recession peak to 2016q1
Source, ONS Regional Labour Statistics and FAI calculations
After the large loss of jobs in the latest quarter, Scottish jobs as reported in the LFS household surveys were 0.9% above the pre-recession peak, while UK jobs were 6.3% above peak. The shake out in jobs in Scotland is clearly related to the consequences of the fall in the price of oil. But the fall is likely only to be partly due to the effects of the falling oil price. The continued weakness of manufacturing is likely also to be important. Whatever the causes, the gap between the UK and Scotland is at its widest since early 2010 for unemployment and early 2012 for employment.
Challenges facing the Scottish economy
In the previous three Commentaries (Vol. 39, No’s 1, 2 and 3) we began to consider the challenges facing the Scottish economy. The July 2015 Commentary (Vol. 39, No. 1) focused on the short-term capacity utilisation issue. In the November 2015 Commentary(Vol. 39, No. 2) we focused on the more long-term capacity growth question. In the March 2016 Commentary (Vol, 39, No.3) we examined the revised data on Scotland’s long-term growth performance, and considered the implications for Scotland’s economic performance if the British people voted to leave the European Union in the coming referendum on 23 June 2016.
We concluded that the latest revised data suggested that Scotland’s growth performance over the long-run had been weaker than the UK with GDP per head growth evened out by falling and/or slower population growth in Scotland, with some of that weaker population growth reflecting the weaker relative strength of the Sottish economy. On productivity, the key overall driver of growth, we concluded that while Scottish labour productivity was growing, it was weaker than in the UK: -2.4% below. Moreover, we noted that academic research on Total Factor Productivity (TFP) - where one estimates the productivity of all factors: labour, capital and land – has found it to be significantly lower in Scotland than in the UK.
94.00 96.00 98.00 100.00 102.00 104.00 106.00 108.00
Scotland UK
+0.9% +6.3%
June 2016 16 In one key study, the ‘gap’ between Scotland and rest of UK was around 11% across all sectors in 2012 (and 22% below the leading UK region). We suggested that the evidence indicated that Scotland was weak in varying degrees on all of the key determinants of competitiveness: in innovation/R&D; exporting (especially for a small open economy); skills; investment, and enterprise.
On BREXIT, we concluded that there was a high probability that output and growth in the Scottish economy would be damaged if Britain left the EU. First, the likelihood would be that trading arrangements would be less favourable than in the EU. Not only would actual and potential Scottish exporters have to overcome their weaker competitive position due to lower labour and total factor productivity they would also have to face the additional hurdle of less favourable trading arrangements. Secondly, Brexit might worsen Scottish productivity growth through the negative effects on trade competition, inward investment and financial integration. So, at a time when there is increasing policy concern about Scotland’s productivity and growth performance a vote to leave the EU would place an unnecessary burden on Scottish companies and economic policy.
In the current Commentary we offer a few comments on policy issues relating to the improvement of Scotland’s long-term growth perfromance.
Policy and the Growth of the Scottish Economy
The achievement of legislative devolution in 1999 following the Scotland Act 1998 allowed Scottish Governments to develop a strategic approach to the promotion of Scotland’s economic development. The process began with the introduction of the Framework for Economic Development in June 2000. This was followed by the publication of Smart Successful Scotland, with its focus on the role of the Enterprise Networks, in February 2001. Both FEDS and SSS were “refreshed” in 2004, and 2005 with largely cosmetic changes. After the SNP Government came to power in 2007 a Government Economic
Strategy was published in November 2007. In September 2011 a new strategy was published and
finally, in March 2015 the Scottish Government published Scotland’s Economic Strategy.
June 2016 17 formation. It is not new strategies the Scottish economy needs but clear insights and policy action on the implementation of Scotland’s Economic Strategy.1
It is against this background that we welcome the creation of the new Economy Secretary post in the Scottish Government the appointment of the new Cabinet Secretary for Finance, Derek Mackay MSP following the recent election. We also welcome the new Minister Keith Brown’s early initiative in instituting a review of Scotland’s enterprise and skills agencies with a brief “… to consider how best to deliver and enhance the services and functions those bodies currently provide or need to provide in the future, to meet the needs of those engaging with the bodies, as well as to deliver on Ministerial ambitions – particularly productivity.” Providing this review is undertaken in a positive way to help enhance the operational impact of the agencies, then we hope this marks the beginning of a process where strategy implementation moves centre stage in economic policy in Scotland.
Forecasts
Background
Output and jobs growth in the Scottish economy has weakened since we last reported in March 2016. After GDP data revisions it is now clear that with growth of only 0.1% in the second quarter last year and then a fall of -0.1% in the third quarter, the Scottish economy came perilously close to a recession in 2015 and despite the slight upturn to 0.2% growth the fourth quarter may yet not escape a recession in the coming months. In the fourth quarter, Scotland had to rely solely on the service sector for growth as the contribution of construction faded away to zero with the stimulus from infrastructure spending disappearing. Slight negative growth in the production sector meant that the recession in the sector continued with negative growth having occurred in three successive quarters. Within production, manufacturing technically emerged from recession with fourth quarter growth of 0.3% after experiencing falling output in the previous two quarters. But despite that manufacturing growth in Scotland can only be described as weak.
We do not yet have outturn data for GDP in the first quarter 2016 in Scotland but extrapolating from the fourth quarter what seems to be happening is that both domestic and overseas demand for Scottish goods and services appear to be weakening, while domestic demand is still driving growth in Scotland –
see Forecasts of the Scottish Economy section below. In particular in the first two quarters of 2015
household demand and fixed investment were the sole drivers of growth. In the third quarter general government spending also made a small positive contribution to growth, although the continuation of the UK Government’s austerity programme means that there is little sustained boost to growth from this component of demand. In the fourth quarter household demand and fixed investment were again the sole drivers and were both weaker than previously. It now seems clear that both components of demand have been badly affected by the continuation of the low price of oil, with job losses affecting household incomes and spending and fixed investment affected by the decline in onshore investment in the oil service industry and related activities as well as the slowdown in infrastructure spending and
1 A point raised by the STUC’s Stephen Boyd at the Fraser of Allander Institute’s policy seminar in May 2016. I also
June 2016 18 construction activity noted above. Another factor to note is that the household saving ratio in Scotland was 6.3% in 2015q4 31% lower than it was in the corresponding quarter of 2014. This fall will clearly have helped sustain household spending either by households saving less or borrowing more. However, a close look at the data reveals that the ratio fell from 9.1% to 6.8% between 2014q4 and 2015q1, then fell a little further to 6.3% in the second quarter and essentially remained there for the rest of the year. Household spending was clearly boosted in the first quarter of last year but by the end of the year the effect of the change was fading away as households possibly started to rein back their borrowing. In addition, wage growth remains weak while the housing market seems to be weakening, which is also likely to have a detrimental effect on household spending. It might also be the case that uncertainty about the outcome of the BREXIT referendum on 23rd June might be encouraging companies to
postpone investment plans until the issue about Britain’s economic relationship with the EU is clarified. In this context it is worth noting that net trade has made a negative contribution to Scotland’s GDP growth in 4 of the last 5 quarters, while Scottish exports (including trade with rest of UK) in current market prices have actually been falling since 2014 and Scottish manufacturing exports to the rest of the world fell in real terms in the second half of last year.
The ONS Release Second Estimate of GDP: Quarter 1 (January to March) 2016 estimated UK GDP in volume terms to have grown by 0.4% in the first quarter, the same as the preliminary estimate in April but lower than the 0.6% growth achieved in the final quarter of last year. The release also provides detail on the expenditure component contribution to UK growth. The picture remains broadly similar to Scotland in the fourth quarter of last year, and broadly similar in the first quarter 2016 to the fourth quarter 2015, with the exception that the contribution of fixed investment to growth increased, which we think unlikely to be the case in Scotland in view of the effects of the oil price fall – notwithstanding the recent pick up in the price to around $50 per barrel - and turn down in infrastructure spending. So, we must conclude that in the first quarter and probably through the rest of the year, household demand and fixed investment will continue to drive growth in Scotland but with the stimulus from household spending and fixed investment weakening while net trade continues to have a negative effect as the rate of growth in Scotland’s main export markets is predicted to fall.
The Scottish Chambers’ Quarterly Economic Indicator for the 1st quarter 2016, found that performance
June 2016 19 GVA Forecasts
For our latest GVA forecasts we continue the presentational procedure adopted in previous Commentaries. We present only a central forecast but use estimated forecast errors to establish the likely range within which the true first estimate of the growth of Scottish GVA will lie.
[image:19.595.87.503.260.370.2]Table 1 presents our forecasts for Scottish GVA - GDP at basic prices - for 2015 to 2017. The forecasts are presented in more detail in the Forecasts of the Scottish Economy section of this Commentary.
Table 1:Fraser of Allander Institute Forecasts of Scottish GVA growth, 2016-2018
GVA Growth (% per annum) 2016 2017 2018
Central forecast 1.4 1.9 2.0
March 2016 forecast 1.9 2.2 n.a
UK mean independent new
forecasts (for May 2016) 1.9 2.1 2.3
Mean Absolute Error % points +/- 0.52 +/- 1.24 +/- 1.31
Source: © Fraser of Allander Institute, June 2016
Table 1 shows that we have revised down our forecast for this year from 1.9% in March 2016 to 1.4%. This downward revision is driven by slow investment growth, the continuing effects of the fall in the price of oil on household incomes and spending, a general slowing in household spending as the rate of household borrowing diminishes and a worsening demand for Scottish exports as global growth and growth in Scotland’s key export markets slows. On our central forecast, we are forecasting growth of 1.9% in 2017 a downward revision to our March forecast of 2.2%. This revision is due to an anticipated weakening of both domestic and export demand for goods and services produced in Scotland compared to our March forecast. We are now forecasting 2018 and our prediction is that there will be growth of 2.0% as the economy returns to trend.
Table 1, also compares our GVA forecasts with the median of latest independent forecasts for the UK as published by the UK Treasury in February 2016. These show that we expect Scottish growth to be weaker than in the UK over the forecast horizon 2016, 2017 and 2018. So, we are forecasting growth of 1.4% in 2016, 1.9% in 2017 and 2.0% in 2018. Given our previous forecast errors the lower and upper bounds for growth in 2016 are expected to be 0.9% and 1.9%; for 2017, 0.7% to 3.1%, and for 2018, 0.7% to 3.3%.
June 2016 20 Employment Forecasts
[image:20.595.98.498.271.421.2]Table 2 presents our forecasts for net employee jobs for the years 2015 to 2017 in terms of a central and upper and lower forecast. Note that in forecasting employee jobs we are not forecasting self-employment, which has been an important component of the recent jobs recovery (refer Scottish Labour Market section of this Commentary). Moreover, employee jobs can differ from the self-reported employment in the monthly Labour Force Survey.
Table 2: Forecast Scottish Net Jobs Growth in Three Scenarios, 2016-2018
2016 2017 2018
Upper 37,950 67,550 79,200
March 2016 forecast 50,700 79,400 n.a.
Central 28,650 39,450 47,379
March 2016 forecast 36,800 46,850 n.a.
Lower 19,400 10,200 16,400
March 2016 forecast 24,250 31,200 n.a.
Source: © Fraser of Allander Institute, June 2016
We have revised down our forecasts of employee jobs because of the deteriorating conditions in the Scottish labour market. The number of total employee jobs is still forecast to increase in each year with the number of jobs at the end of 2016 forecast to be 2,445,650, an increase of 1.2% during 2016. Our new central forecast is that the Scottish economy will add 28,650 jobs in 2016, down by around 8,000 from our March forecast, with a net of 39,450 jobs added in 2017, down by more than 7,000 from our March forecast. Jobs growth in 2018 is forecast to be 47,379.
This year, we expect 21,800 service sector jobs to be created, with 3,650 added in production, and a reduction of -350 in agriculture. Construction jobs are now forecast to rise this year by 1,050. In 2017/2018, the bulk of the jobs created are again expected to be in the service sector with an additional 32,850/38,250 jobs forecast, while 4,650/5,350 are added in production, 350/1,800 in agriculture and 1,650/2,000 in construction.
Unemployment Forecasts
June 2016 21 apparent worsening of many labour market indicators over the last four months, and the revision downwards of growth performance of Scotland in 2016 cause us to revise up our forecasts for unemployment in both levels and rates. Our latest forecasts for the unemployment rate in Scotland for the end of 2016 is now 6.9%, with our forecast for this to fall to 6.7% and then 6.2% by the end of 2017 and 2018, respectively.
[image:21.595.88.500.239.336.2]The key unemployment forecasts are summarised in Table 3 below.
Table 3:Forecasts ILO unemployment, 2016-2018
ILO unemployment 2016 2017 2018
Forecast Rate (ILO un/TEA 16+) 6.9% 6.7% 6.2%
March 2016 forecast 5.7% 4.8% n.a.
Numbers 183,850 181,050 168,050
Source: © Fraser of Allander Institute, June 2016