City, University of London Institutional Repository
Citation:
Yang, Y., Wang, Y. & Fu, F. (2014). Effect of reinforcement stiffeners on square concrete-filled steel tubular columns subjected to axial compressive load. Thin-Walled Structures, 82, doi: 10.1016/j.tws.2014.04.009This is the accepted version of the paper.
This version of the publication may differ from the final published
version.
Permanent repository link:
http://openaccess.city.ac.uk/20059/Link to published version:
http://dx.doi.org/10.1016/j.tws.2014.04.009Copyright and reuse: City Research Online aims to make research
outputs of City, University of London available to a wider audience.
Copyright and Moral Rights remain with the author(s) and/or copyright
holders. URLs from City Research Online may be freely distributed and
linked to.
City Research Online: http://openaccess.city.ac.uk/ publications@city.ac.uk
Effect of Reinforcement Stiffeners on Square Concrete-filled Steel
Tubular Columns Subjected to Axial Compressive Load
Yuanlong Yang
a, Yuyin Wang
b,*, Feng Fu
c(a Key Laboratory of Mechanics on Disaster and Environment in Western China of China Ministry
of Education, Lanzhou University, Lanzhou 730000, China;
b School of Civil Engineering, Harbin Institute of Technology, Harbin 150090, China;
cSchool of Engineering and Mathematical Sciences, City University, London, EC1V 0HB, U.K.)
Abstract. Eight stiffened square concrete-filled steel tubular (CFST) stub columns with slender
sections of encasing steel and two non-stiffened counterparts were tested subjected to axial
compressive load. Four types of reinforcement stiffeners and steel tensile strips were introduced to
postpone local buckling of steel tubes, in which the tensile strip was first used as stiffener in CFSTs.
The stiffening mechanism, failure modes of concrete and steel tubes, strength and ductility of
stiffened square CFSTs were also studied during the experimental research. A numerical modeling
program was developed and verified against the experimental data. The program incorporates the
effect of the stiffeners on postponing local buckling of the tube and the tube confinement on
concrete core. Extensive parametric analysis was also conducted to examine the influencing
parameters on mechanical properties of stiffened square CFSTs.
Keywords: concrete-filled steel tube, axial compressive load, stiffener, local buckling, confinement
1.Introduction
In structural systems using square concrete-filled steel tubular (CFST) columns, regular indoor
space is provided and joint construction is facilitated and fast tracked. However, the lateral pressure
from square steel tube is unevenly distributed in the square concrete cross-section. The lateral
pressure near the web centers is weaker than that near the corners. On the other hand, the steel tube
is prone to buckle, especially when depth-to-thickness ratio is large. These disadvantageous
mechanical behaviors of concrete and steel tube mentioned above can attribute to their inadequate
interaction. To enhance the interaction between the steel and concrete and further increase their
resistances, other scholars introduced stiffeners into square CFSTs. The patterns of stiffeners are
shown in authors’ previous paper [1].
The plate rib is the most commonly used stiffener in square CFST columns. Experimental studies
were carried out to investigate its anti-buckling behavior [2][3][4]. The plate ribs are welded on the
inner surfaces of the tube to reinforce the tube by enlarging bending rigidity of steel plate sections.
After the HyogokenNanbu earthquake, the plate rib was introduced in bridge piers and frame
columns with huge cross-sections [5]. To simplify fabricating procedure, stiffeners sometimes can
be formed by bending steel plates. Curling ribs and oblique curling ribs were studied in the
experiments [6] [7] by welding cold-formed channels or isosceles angle irons with curling edges.
Test results show that, under low compression ratio, the curling ribs and oblique curling ribs can
effectively improve static ultimate strength and enhance ductility of the structure in resisting
earthquake load. However, the embedment of these ribs in concrete, depending on frictional force
between stiffeners and concrete, cannot guarantee the interaction between the concrete and steel
tube, and is also weakened by concrete expansion. Meanwhile, the full penetration butt weld may
lead to residual stresses in steel plates. Curling ribs may also encounter fabricating problems in
bending curling edges, especially for thick plates.
To improve the embedment of stiffeners in concrete, other types of stiffeners, mainly employing
steel tensile property, were introduced into square CFST columns. Studies on performance of
square CFST members, by utilizing pairs of tie rods, also known as binding bars, at possible plastic
hinge locations, were conducted in [8, 9]. Constitutive relationship was developed for square
that of Mander model. However, the convex tie rods obstruct indoor space. To improve this
disadvantage, tension sheets was introduced with similar stiffened scheme [6]. Furthermore, oblique
tie bars, as an enhanced stiffened scheme by decreasing welding spacing in cross section, was
employed [11]. The stiffeners, such as tie rods, binding bars and oblique tie bars, can effectively
avoid concrete cracking, restrain the out-of-plane deformation of plates and therefore delay local
buckling of steel tubes.
The previous research showed that the proposed stiffeners can obviously delay local buckling of
the tube and provide enhanced strength and ductility compared to square CFST columns. However,
the existing stiffeners may have limitations in material efficiency or fabrication feasibility.
Innovative types of reinforcement stiffeners were proposed in authors’ previous experimental
research [1] in 2012. Preliminary results on behavior of reinforcement stiffeners were obtained. It is
found that, some types of reinforcement stiffeners can increase steel tensile capacity, however, the
remaining types cannot.
The study in this paper was performed to investigate the static behavior of square CFST
cross-sections with reinforcement stiffeners or tensile strips. On the basis of previous tests
conducted by the authors, the post-buckling properties and constraint effect for concrete were
studied. Both experimental and analytical researches were carried out to assess of the proposed
stiffeners. Numerical analysis was made on stiffened square CFST cross-sections to study various
parameters such as material strengths, material consumptions and stiffener arrangement type.
Compared to the previous research [1], material efficiency was achieved by promoting improved
stiffened scheme for steel tubes in this paper. The steel tensile strip was first used as stiffener in the
CFSTs. The range of steel tube ratio to the concrete was extended to get more behavioral
load-displacement curves during load descending stage. Based on the test observation, local
buckling was included in the strength of steel tubes in numerical analysis.
2. Experimental program
2.1 Test specimens
Table 1 summarizes the basic geometrical properties of the specimens. The specimens consist of
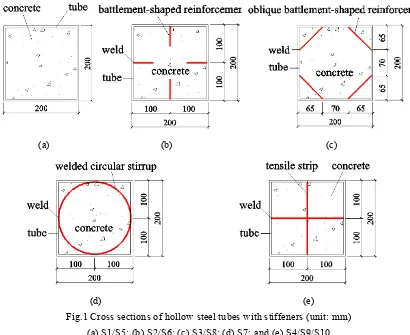
ten stubs with eight stiffened specimens and two non-stiffened counterparts. The cross sections of
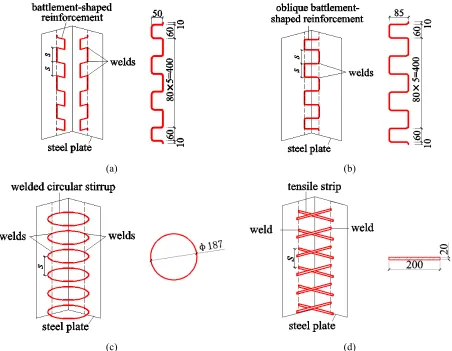
the specimens with stiffeners are showed in Fig.1. The longitudinal arrangement of stiffeners on
steel tubes is showed in Fig.2.
The depth b and length L of all the specimens are 200mm and 600mm respectively. Two nominal
steel plate thicknesses t (2.0mm and 3.5mm) were chosen for steel tubes and hot-rolled plate.
Reinforcements with nominal diameter d and tensile strips with cross-sectional dimensions dr×tr
were employed as stiffeners. Based on the nominal steel plate thickness t, the specimens are divided
into two groups: group I (t=2.0mm and corresponding depth-to-thickness ratio b/t=100) and group
II (t=3.5mmand corresponding depth-to-thickness ratio b/t=57). In Table 1, αs is the ratio of steel
tube cross-sectional area As to concrete cross-sectional area Ac; αr is the ratio of reinforcement
volume Vr to concrete volume Vc The details of the stiffeners in the same stiffened scheme are
described in groups as follows:
S1 and S5: non-stiffened specimens, shown in Fig. 1(a), designed as referential specimens.
S2 and S6: stiffened specimens with battlement-shaped reinforcements, shown in Fig.1 (b) and
Fig.2 (a). The battlement-shaped reinforcements were made through bending straight
reinforcements and welded tangentially on the inner surface of the steel tube. The stiffeners were
expected to restrain the tube at the welds and the battlement shape guarantees embedment in
inner sides of which were welded with reinforcement stiffeners. Then two L-shaped parts were
welded to form a hollow square tube. This fabrication procedure reduced adverse influence caused
by welding residual stress compared to traditional workmanships.
S3 and S8: stiffened specimens with oblique battlement-shaped reinforcements, shown in Fig.1(c)
and Fig.2 (b). The battlement-shaped reinforcement was positioned near the corners of the tube and
welded tangentially to the inner surfaces of the two adjacent steel plates. The weld divided the steel
plate cross section into three parts with widths of 65mm, 70mm, and 65mm respectively. An
oblique battlement-shaped reinforcement was welded between two adjacent plates, therefore square
steel tube should be formed before stiffener welding.
S7: stiffened specimen with welded circular stirrups, shown in Fig.1 (d) and Fig.2(c). Six circular
stirrups were welded uniformly-spaced along the length onto the inner surfaces of the steel tube.
The stirrups were expected to confine the concrete core and restrain the possible outward
deformation of the encasing steel at the location of welds. A circular stirrup was welded on four
plates, therefore square steel tube formation should be prior to stiffener welding.
S4, S9 and S10: stiffened specimens with tensile strips, shown in Fig.1 (e) and Fig.2 (d). The
tensile strips, with cross-sectional dimensions of 20mm (height) × 2.0mm (thickness) or 20mm
(height) × 3.5mm (thickness), were installed through the pre-fabricated holes with dimensions
slightly larger than those of the stiffeners. The tensile strips were then welded at two ends, with the
spacing of 100 mm along the length. The steel tensile strips were made of the same steel plates of
the tubes. This hole-drilling fabricating method can avoid heat-induced initial imperfection by
traditional gas-cutting method.
After fabrication of the stiffened tube, an end plate was welded at the bottom for subsequent
specimen after concrete casting procedure. Four steel end ribs with dimensions of
50mm×20mm×2mm were welded at each end of the tube to reinforce the tube’s end regions.
2.2 Material properties
According to the Chinese National standard, Metallic materials-tensile testing at ambient
temperature (GB/T 228-2002) [12], mechanical properties of the steel plates and stiffeners were
tested as it shown in Table 2. Commercial ready-mixed concrete of C30 grade in the Chinese
national code for design of concrete structures (GB50010-2010) [13], was casted into hollow tubes,
with mix design shown in Table 3. Prismatic standard cubes with dimensions of
100mm×100mm×100mm were casted simultaneously under the same curing conditions. Test
specimens were cured until the testing day and the cubes were tested to get the equivalent value of
concrete compressive prismatic strength fck=37.5N/mm2.
The experiment was carried out at the Structural and Seismic Test Research Center, Harbin
Institute of Technology. A 500 ton computer monitored OSD hydraulic jack was used as loading
device, with two articulated rigid loading pads at the top and bottom. During the loading procedure,
the bottom pad lifted the specimen and the top kept still (shown in Fig. 3).
The axial load was measured with a load cell on the top endplate and a 20mm-thick padding plate
was placed in between the load cell and the specimen in order to get evenly distributed axial loads.
Two accessory columns, with retractable length, were specially designed to support the top loading
pad along with the specimen, in order to stably record the load-displacement curves during load
descending stage (Fig. 3). Four LVDTs (1,2,3 and 4)were placed at bottom and two (5 and 6 in
parenthesis)were at top (Fig. 3(c)), so relative vertical displacement ur after the specimen and
devises were close-contact, is calculated with Eq. (1):
r b t
Where ub is the average data value of the bottom four sensors; ut is the average data value of the top
two sensors. The data from the load cell and LVDTs were input into the Beijing spectrum
instrument so that the axial load-displacement curves were real-time monitored.
Four dial gauges were symmetrically arranged with starting gage length 20mm in the middle of
each steel plate (in Fig.3(c)), for measuring displacement increment prior to local buckling. Vertical
and transverse strain gauges were also employed on the tubes for monitoring the strain and stress
development of non-stiffened specimens and stiffened specimens. To assure uniform compression,
preliminary tests within the elastic range were conducted by carefully adjusting the position of the
specimen, based on the data of the dial gauges and strain gauges. The dial gauges and strain gauges
were used for displacement and strain measurement, and for physical centering adjustment before
actual loading.
A load increment of less than one tenth of the estimated peak resistance was employed in the
loading scheme. Each load interval was maintained for about 2 minutes.
2.4 Test observation
2.4.1Buckling behavior of steel tubes
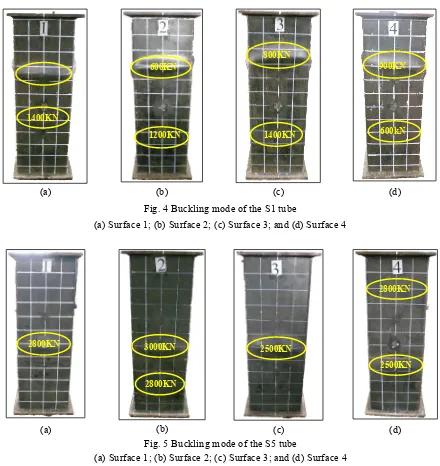
Figures 4-7 illustrate the buckling modes of steel tubes of specimens S1, S4, S5 and S9, which
are typical specimens in their groups. Specimens S1 and S5 are both non-stiffened counterparts. The
comparison is designed to investigate the influence of tube thickness t, in other words,
depth-to-thickness ratio b/t. Specimens S4 and S9, both tensile strip stiffened specimens with tube
thickness respectively equal to those of S1 and S5, are studied to investigate influence of tensile
strip stiffener on the buckling behavior. The buckling formation time is denoted with load values or
loading stages at the buckling positions of the steel tubes.
when steel tube yielding occurred, the ultimate load Pu and the classification of composite sections.
The tube buckling here is referred only to the cross-sectional buckling in the middle of the tube,
where the buckling is only influenced by cross-sectional slenderness and concrete support. This is
different to the end tube’s buckling which is caused by end concrete shrinkage resulting in the end
tube bearing the axial load prior to the concrete core. Before reaching the point of yielding load
corresponds to steel tube yielding, the interaction between concrete and steel tube can be ignored.
Therefore, the uniaxial stress-strain relation curves of concrete and steel are employed to calculate
the yielding resistance.
Test results show that the stiffeners help to increase the buckling resistance of columns. The
depth-to-thickness ratio (b/t =100) of specimen S1 is beyond the limits in Euro code 4 (EN1994-1-1:
2004) [14] in which the effects of local buckling can be neglected. Due to its flexible
cross-sectional slenderness, the specimen S1 buckled at 600kN before reaching its yielding
resistance of 1900kN. The composite section of S1 belongs to Class 4 grade according to the rule of
cross-section classification in Euro code 4. By adding stiffeners in specimens S2, S3, and S4, the
buckling was delayed and their buckling loads (respectively 1000kN, 1200kN and 1200kN) are
relatively closer to yielding load (1900kN).
Although the depth-to-thickness ratio (b/t=57) of Specimen S5 is beyond the limits in Euro code
4 in which the effects of local buckling can be neglected, specimen S5 buckled at 2500kN after its
tube reached yielding resistance 2211kN in the experiment. Compared to specimen S5, no buckling
was developed in specimens S6, S7, S8, S9, and S10, which failed by material failure beyond peak
resistance, rather than local buckling failure in elastic and plastic stage. It can be indicated that,
without thickening the tubes, the stiffeners further upgrade classification of composite sections to
deformation because of local buckling.
2.4.2Mechanical behavior of stiffeners
The buckling behaviors of specimens can be attributed to stiffening mechanisms, in which the
stiffeners delay the local buckling and almost fully restrain the out-of-plane deformation of steel
tubes at the location of welds. The results deduced from experiment on the tubes’ buckling modes
and stiffeners’ mechanisms not only confirm the conclusions of the author’s previous experiment
[1], but also investigate new stiffeners’ mechanisms and more comprehensively summarize the
common mechanisms among different stiffeners. The mechanisms of stiffeners in this experiment
are described as follows.
The steel tubes of non-stiffened specimens S1 and S5 supported loads independently and buckled
outward in very early stage, due to little interaction with concrete. The buckling wave heights of
specimens S1 and S5 were significant, with 15~20mm and 10~15mm respectively. Without lateral
restrain from concrete, the steel tubes lost their resistances rapidly during load descending stage and
steel material capacity are far from fully exploited.
The adverse buckling behavior in the non-stiffened specimens was noticeably improved by
stiffeners in the stiffened specimens. For specimens S2 and S6 (shown in Fig.1 (a),(b)), the
segments of the battlement-shaped reinforcements, vertical to steel plates, effectively restrained the
tube at welds in order to change tube’s buckling modes and increase its buckling strength. On the
other side, the battlement-shaped reinforcements were embedded in the concrete and the concrete
expansion deteriorated stiffeners’ boundary condition, which slightly decreases specimens’
behavior. The buckling wave heights of specimens S2 and S6 were in the range of 5~10mm and
0~5mm respectively.
spacing of welding constraint points in cross section provided more uniformly distributed lateral
confinement for concrete. Meanwhile, the horizontal segments of the battlement-shaped
reinforcements directly restrained the out-of-plane deformation of the tubes at welds. The buckling
wave heights of specimens S3 and S8 were respectively mainly 5~10mm and 0~5mm.
In the specimen S7, the circular stirrups offered some direct confinement for concrete and the
tube stiffened by circular stirrups at welds offered another kind of confinement. The buckling wave
heights of specimen S7 were only 5~10mm.
Specimens S4, S9, and S10, employing tensile strips, restrain out-of-plane deformation of steel
tubes at location of welds. The strips helped steel tube restrain concrete expansion and provide
confinement for concrete. The buckling wave heights of specimens S4, S9 and S10 were only
0~10mm.
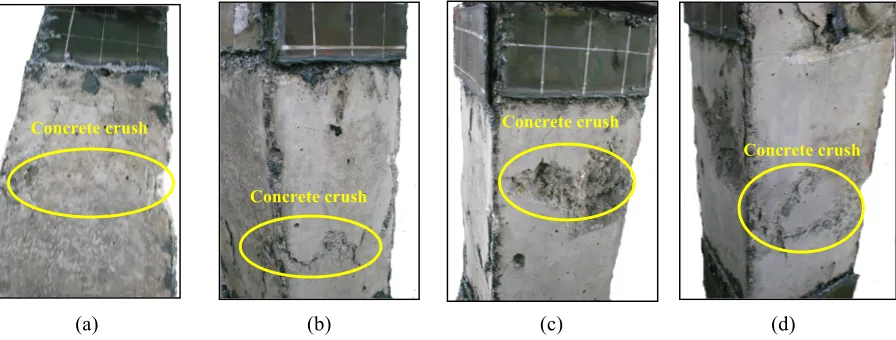
2.4.3 Concrete crushing and failure modes
Local concrete crushed mode (as surface 3 of specimen S5 shown in Fig.8 (c)) was observed in
the concrete in the non-stiffened tube. But most other concrete surfaces were detected crushed only
to a shallow depth (as surface 1, 2 and 4 shown in Fig.8 (a), (b) and (d)), which means the
compressive strength of most concrete was not fully exploited. After premature local buckling of
the steel tube due to the lack of stiffeners’ restraint, little confinement from the steel tube was
provided for the concrete core. The concrete was loaded to crush very rapidly and can be regarded
as brittle failure mode. The interaction between concrete and steel tube can also be detected by
tapping the buckling locations of the steel tube after experiment, for the tapping sound revealed that
there was separation between the concrete and steel tube.
The concrete in the stiffened tubes (such as S9 in Fig. 9) was damaged in local concrete crushed
compressive strength of concrete was exploited. The crushed area and crushed depth were more
than those of the non-stiffened specimen. The crushed concrete was located between two adjacent
stiffener welds, while concrete near welds showed little damage. The interaction between concrete
and steel tube can also be detected by tapping the buckling locations of the steel tube after test, for
the tapping sound revealed that there were almost no separation between concrete and steel tube.
The stiffeners enhance the constraint effect for concrete provided by steel tube and improve the
concrete from a brittle failure mode to a more ductile failure mode.
2.5 Comparison of experimental results
The axial load P versus axial shortening u relation curves of all the specimens were recorded in
the experiment. The axial shortening u of the specimens was obtained by modifying the
displacement transducer readings on the basis of the vertical strain gauge and dial gauges readings
to eliminate the shortening caused by loose contact of devises. The quantifications of axial
stress-strain relation curves, defined as derived behavioral indices, are summarized in Table 6.
Comparisons and analysis of mechanical properties of all specimens are conducted as follows,
combined with the results in Fig.10 and Table 5.
In Table 5, the indices Pn and Pu are nominal ultimate resistance and test ultimate resistance. Pn
can be referred to author’s previous paper [1]. The Pu from tests is the peak resistance of P-u
relation curves, which was influenced by steel tube stiffening and concrete confinement, in other
words, the positive interaction between concrete and steel tube. To eliminate the differences of
sectional dimensions and tube thicknesses among specimens, the test ultimate resistance
enhancement index (RI) is introduced and defined in Eq.(2).
/
u n
RI =P P (2)
of axial shortening corresponding to 85% ultimate resistance during descending stage u0.85 to the
yielding axial shortening uy in Eq.(3). The uy is the axial shortening corresponding to decrease of
slope coefficient of the axial load-axial shortening curve, that is, the materials evolve from elastic
stage to plastic stage.
µ=u0.85/uy (3)
To investigate the enhancement of ductility by the stiffeners over that of the non-stiffened
specimen, ductility enhancement index DI is defined as the ratio of ductility of stiffened specimen
to that of non-stiffened specimen.
Based on the data in Table 5, the test ultimate resistance enhancement index RI of all the
specimens in the test range from 1.08 to 1.19, which indicates the test ultimate resistances Pu from
test are generally larger than nominal ultimate resistances Pn. The reason can attribute to the
effective interaction between concrete and steel tubes. The majority enhancement of index RI
comes from concrete confinement provided by stiffened steel tubes.
The stiffeners improved specimens’ ductility more than ultimate resistance. Compared to
non-stiffened counterpart, the stiffeners of tensile strip, oblique battlement-shaped reinforcement
and welded circular stirrup can increase the ultimate resistances of Group II specimens only by 3%
to 4.5%, While the ductility enhancement by stiffeners can reach up to 46%~77%. That is because
the confinement for concrete depends on how much steel tube provide restriction to concrete
volume expansion. During load ascending stage (including ultimate resistance), the concrete
expansion is very small and the interaction between concrete and stiffened steel tubes can be
ignored. During load descending stage, damage in concrete makes its volume expanded quickly and
therefore the stiffened steel tubes began to restrict the concrete expansion and provide more
welded circular stirrup can directly restrain the steel plates through the steel tensile capacity and
improve specimens in ductility more significantly.
It should be specially mentioned that the tensile strip stiffener of specimen S10 was inadequate in
cross section compared to that of specimen S9, and therefore the specimen S10 provided relatively
low resistance. The battlement-shaped reinforcement cannot significantly increase resistances of
specimens S2 and S6, as its embedment in concrete hampered concrete compressive strength’s full
exploitation and its restriction of steel plates was a little deteriorated with concrete expansion.
It should be stressed that the steel tubes in this experiment have a steel to concrete proportion αs
of 4.2% ~ 7.5% (shown in Table 1), reaching the lower limit of CFST steel proportions (normal
steel proportion range is 4%~20%), which requires lower constructional costs in China. An
enhancement in performance may be expected with thicker steel tubes within normal steel
proportion range. The amount of stiffeners should coordinate with steel proportion, in order to
guarantee their economic usage.
3. Theoretical analysis
3.1 Introduction of numerical analysis model
A numerical analysis program was designed by the authors to perform the numerical analysis of
the specimen. The detailed numerical model to underpin the analysis program is introduced in this
section.
3.1.1 Axial load-displacement curves of stiffened square CFST stubs subjected axial load
Load-displacement curves of stiffened square CFST stubs were calculated in the numerical model.
The numerical model is established by applying axial displacement u on top of columns step by step.
Then the axial displacement is divided by column length to be translated into sectional strain.
calculate their stresses. In the ith loading increment of axial load-displacement curve, and the axial
resistance Pi of the columns can be specifically expressed as Eq. (4):
Pi=fcciAc+fyiAs (4)
in which fcci and fyi are stresses of constraint concrete and steel tube. The maximum value of fcci is
compressive prismatic strength of constraint concrete; the maximum value of fyi is yield strength or
local buckling strength of steel tube. Ac and As are cross-sectional areas of constraint concrete and
steel tube respectively.
Therefore the axial resistance P and axial displacement u of columns are collected for the
load-displacement relation curves. When the axial load descended to 85% of the peak load (the
value 85% is larger than most upper limits of axial compression ratio in reinforced concrete tall
buildings), the column is considered to be damaged and the iteration procedure stops.
In the numerical analysis, the concrete strength takes into account constraint effect provided by
steel tube and distribution of confined concrete. The strength of steel tube considers influence of
local buckling. Only CFST stubs are researched in this paper, therefore overall buckling of
specimen is ignored. Compaq Visual Fortran language is employed to code the numerical analysis
program of stiffened square CFST stubs on axial concentric compressive performance.
3.1.2 Material model of steel plates to simulate the buckling behavior
The main failure mode of the steel tube in CFST stubs subjected to axial load is local buckling.
Local buckling was considered in this numerical analysis, which provides more accurate simulation
results than author’s previous research [1], in which no consideration of local buckling was made.
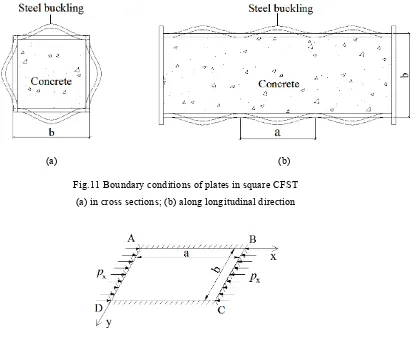
In non-stiffened CFST specimens, the concrete core can restrict tube inward deformation of the
tube which is detected in the hollow tube specimen. Therefore the steel tube can only buckle
11 shows the buckling mode of non-stiffened steel tube in CFST with dotted lines on the basis of
finite element analysis conducted by the author. In the test, the steel tube corners are restricted by
the concrete corners. Therefore in the analysis the steel plate can be approximately considered as
fixed at the corners (shown in Figure 11 (a)). Along longitudinal direction, the steel tube takes on
multi-wave buckling mode. The connection of two adjacent buckling waves contacts tangentially to
the concrete surface. The steel plate can be approximately supposed to be fixed in rotation at two
ends of every buckling wave (shown in Figure 11 (b)), with longitudinal displacement fixed at one
end and unfixed at another end. Figure 12 is the simplified model of rectangular steel plate
subjected to uni-directionally uniformly-distributed loading. The dimensions of the rectangular steel
plate are a (in x direction) and b (in y direction). The line load px on neutral surface in x direction
represents the axial load on the steel tube. All the edges of the steel plate are restrained in y
direction and rotations, with x directional freedom restrained only at edge AD or edge BC.
Although the local buckling of steel tube is inevitable in most cases, the setting of proper
stiffeners on inner surfaces of steel tube is an efficient method to postpone local buckling. The
stiffeners in this paper employ their tensile capacity by pulling out-of-plane deformation of steel
plate at location of welds. The stiffeners can effectively change steel plate from low-order buckling
mode into in high-order buckling mode, or even postpone the buckling to plastic stage. The
restriction function of stiffeners on steel plate can be approximately simulated with point restriction
at location of welds without consideration of concrete expansion.
The elastic buckling strength '
cr
f (N/mm2) of steel plates in stiffened CFSTs can expressed as
Eq. (5), considering buckling postponing function of stiffeners on steel plates. The Eq. (5) has been
compared with finite element analysis results for verifications in Figure 13. The comparison can be
Q420 and the numbers of longitudinal or horizontal point restrictions are 0, 1 and 2.
2 2 2
'
2 2 2
8
(4 4 )
3 cr a b cr a b
D a b
f f
b b a
π
α α α α
= = + + (5)
For square steel plates (a=b), the Eq. (5) can be simplified as
2 '
2
10.67 π
α α α α
= =
cr a b cr a b
D
f f
b (6)
fcr is elastic buckling strength of steel plates in non-stiffened CFSTs [15]. D is the flexural
rigidity per unit width and is given by
3 2 12(1 ) Et D v =
− (7)
t is the thickness of the steel tube (mm); E is the elastic modulus of steel plate (N/mm2); v is
Poisson’s ratio of steel plate taken as 0.287.
a
α
andα
b are influence coefficients, respectively considering longitudinal spacing Sa andhorizontal spacing Sb of adjacent stiffener welds, expressed as Eq. (8) and (9).
2 2 1 y a a a cr f S S
a a f
α = ⎛⎜ ⎞⎟ +⎜⎜⎛ −⎛⎜ ⎞⎟ ⎟⎞⎟
⎝ ⎠ ⎝ ⎝ ⎠ ⎠ (8)
2 2 1 y b b b cr f S S
b b f
α = ⎛ ⎞⎜ ⎟ +⎛⎜⎜ −⎛ ⎞⎜ ⎟ ⎞⎟⎟
⎝ ⎠ ⎝ ⎝ ⎠ ⎠ (9)
where a and b are in-plane dimensions of single buckling wave of non-stiffened steel plate. a is
longitudinal distance between wave crests of adjacent buckling waves; b is cross-sectional length of
steel plate.
The uniaxial perfect elastic-plastic model (shown in Fig.14) was adopted as the constitutive
relationship of material in steel tube and reinforcement, with Young’s modulus Es respectively
referring to Table 2. For stiffened specimens, if elastic buckling strength ' cr
f is smaller than
plates of steel cross-section, and ' cr
f is employed instead of fy in the steel constitutive relationship
and in the equation (4). If ' cr
f is equal to or larger than fy, local buckling will occur beyond the
yielding point and one or more plates of steel cross-section can be assumed a plastic stress
distribution. Then fy is used in the steel constitutive relationship. Similarly, this calculation method
is also suitable for non-stiffened specimens.
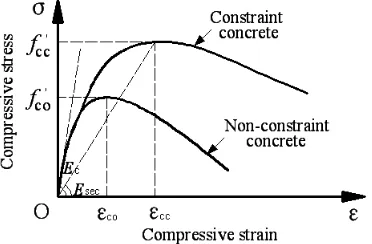
3.1.3 Concrete material model
As per previous research, the concrete in square CFST is divided into a constraint region and
non-constraint regions. The non-constraint concrete is described with uni-axial stress-strain relation
curve of plain concrete referred to GB50010-2002 or author’s previous published paper [1]. The
constraint concrete employs the modified Mander concrete model (in Fig.15) proposed by Mander,
Priestley and Park in 1988 [16].The favorable influence of transverse confinement on the axial
stress-strain relation is taken into consideration in the constraint concrete.
Related research reveals that, in non-stiffened square CFSTs (S1 and S5), cross-sectional
constraint region (shaded area in Fig. 16) distributes near the corners of composite tube and the
center of concrete, and carries out transition to the non-constraint regions (blank areas) adjacent to
the steel plate center (in Fig. 16(a)). For these stiffened specimens, the stiffeners restrain steel tube’s
local buckling at welds, thus the number and location of the welds influence the constraint region.
The boundaries between non-constraint regions and constraint region are described by second-order
parabola curves. Fig.16 (b)(c)(d) displays the constraint region (shaded area) and non-constraint
regions (blank areas) in stiffened cross section of specimens. Fig.17 shows longitudinal distribution
of concrete constraint region (shaded area) and the non-constraint regions (blank areas). Section 1-1
is the stiffened cross section in which stiffeners are welded with the steel tube; Sections 2-2 is the
can refer to author’s previous research [1].
The confinement distribution pattern may vary with parameters of specimens changing.
Simplification made in this paper is proved to be accurate in the following test verification. Further
study is still requested, especially when specimens’ parameters are beyond the scope of this paper.
On the basis of constraint concrete distribution, the compressive strength of constraint concrete
fcc and its uni-axial stress-strain relation curve can be obtained by modifying Mander concrete
model, which can be referred to author’s previous published paper [1]. The constraint region
employs uni-axial stress-strain relation curve of constraint concrete and the non-constraint region
employs uni-axial stress-strain relation curve of non-constraint concrete.
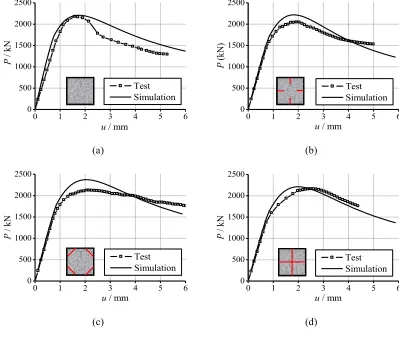
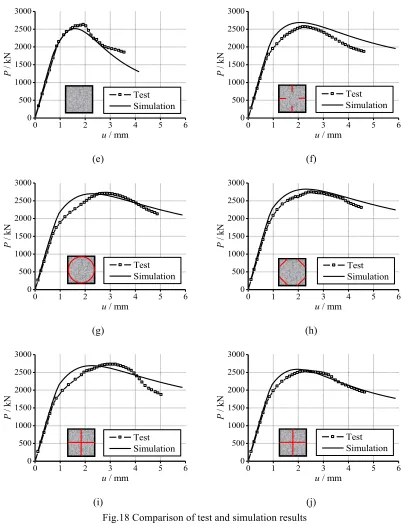
3.2 Verification of numerical program
A numerical analysis program was coded to simulate the ten specimens in axial load P versus
axial shortening u relationship curves (shown in Fig.18). A fairly good agreement is achieved in the
initial stiffness, ultimate strength and ductility between the test and simulation.
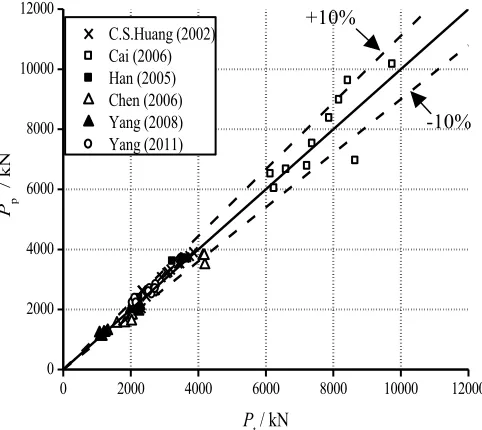
Comparison was made in terms of ultimate resistance between predicted results Pp and test
results Pt of 65 specimens from Han [5], Cai [7], Huang [9], Chen [10], Yang [17], and Yang in this
paper, displayed in Fig.19. The cross-sectional depth b ranges from 130mm to 300mm; the
thickness of steel tube t from 1.25mm to 12mm; the depth-to-thickness ratio b/t from 37.5 to 240;
the steel strength fy from 162N/mm2 to 382N/mm2; the concrete strength fck from 23.94N/mm2 to
54.8N/mm2. The mean value and standard deviation of the ratio of predicted ultimate resistance to
test result are respectively 0.999 and 0.08, which illustrates that numerical predicted results have a
good agreement with the test results.
3.3 Parametric analysis
numerical model was conducted to investigate influence of the parameters, such as
depth-to-thickness ratio b/t (ranging from 200 to 20 when t from 1mm to 10mm), concrete
compressive strength fck (ranging from 20.1MPa to 50.2MPa, accordingly from C30 grade to C80
grade),yielding strength of steel tubes fy (ranging from 235MPa to 420MPa, accordingly from
Q235 grade to Q420 grade in the Chinese national code for design of steel structures (GB
50017-2003) [18]), longitudinal spacing of stiffener welds Sa (ranging from 25mm to 200mm),
horizontal spacing of stiffener welds Sb (ranging from 25mm to 200mm), thickness of tensile strips
tr (ranging from 2mm to 8mm) and yielding strength of stiffeners fyr (ranging from 235MPa to
420MPa, accordingly from Q235 grade to Q420 grade). In each simulation case, except for the
concerned parameter, the remaining parameters are taken as constants, i.e. L=600mm, b=200mm,
t=2mm, fck=26.8MPa, fy=345MPa, dr=20mm, tr=2mm, Sa=100mm, Sb=100mm and fyr=345MPa.
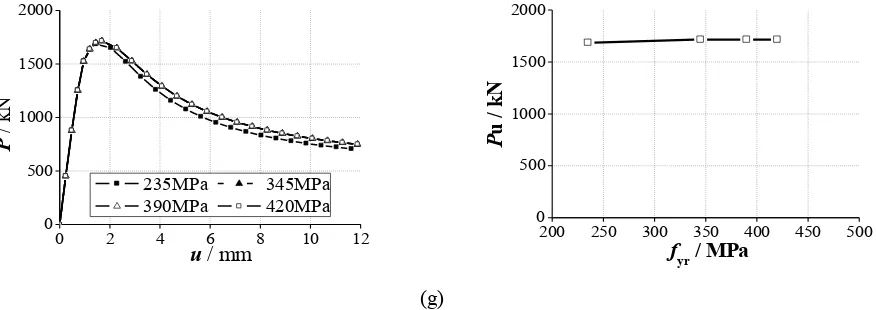
Fig.20 shows the influence of parameters mentioned above on the axial load P versus axial
shortening u curves of stiffened specimens and on the ultimate load Pu. It can be seen that the
decrease of depth-to-thickness ratio b/t brings significant increase in ultimate load and ductility
(Fig.20 (a)). The increasing trend of ultimate load Pu is more obvious when the depth-to-thickness
ratio b/t is smaller than 50, for tubes with thickness of more than 4mm, local buckling can be
avoided and they also provide more effective constraint effect for concrete. The increase in concrete
strength fck brings linear growth of ultimate load, however, the brittle concrete of high strength
makes ductility drop (Fig.20 (b)). As expected, the increase of yielding strength of steel tubes fy
brings linear growth of ultimate load and ductility (Fig.20 (c)). Closer longitudinal and horizontal
spacing of adjacent stiffener welds also promotes higher ultimate resistance, for the improved
confinement for concrete core, thus providing more economical efficiency of materials. However,
improvement of confinement can be ignored (Fig.20 (d) (e)). In regard to construction procedure,
fabrication difficulties may arise when spacing of adjacent stiffener welds is too small. Therefore
the optimum spacing Sa and Sb are suggested to be 100mm (that is the 1/2 of cross-sectional
dimension b). Thickness of tensile strips tr presents positive influence on ultimate load and ductility
(Fig.20 (f)), for the lateral stress of concrete benefits from the axial force of tensile strips. The
tensile strip with large thickness brings high ultimate resistance and ductility. Moreover, even very
thin tensile strip can effectively improve mechanical behavior of specimens. Therefore, the tensile
strip is suggested to have the same thickness with the steel tube, as long as the welding
requirements are satisfied. In addition, the yielding strength of stiffeners fyr has little influence on
ultimate load and ductility (Fig.20 (g)).
4. Conclusions
(1) The stiffeners proposed in this research help to delay or even prevent local buckling of steel
tubes. For specimens with steel depth-to-thickness ratio of 100, the buckling loads of stiffened
specimens are increased closer to their yielding loads. For specimens with steel depth-to-thickness
ratio of 57, the plastic resistance of stiffened specimens can be developed without considering the
effect of local buckling of steel tubes. The stiffeners enhance the constraint effect for concrete
provided by steel tube and improve the concrete from a brittle failure mode to a more ductile failure
mode.
(2) The tensile strip, the oblique battlement-shaped reinforcement and the welded circular stirrup
can directly restrain the steel plates. The stiffeners play little role in specimens’ ultimate resistance
but can improve ductility by 35% to 126% compared to non-stiffened specimens.
(3) A numerical modeling program was developed incorporating the effect of the stiffeners on
related experimental data and good accuracy was achieved, therefore it can be used to predict the
mechanical behavior of square stiffened CFSTs.
(4) Parametric analysis based on the numerical model shows that the decrease of
depth-to-thickness ratio, the increase of concrete compressive strength and steel tube yielding
strength, the decrease of horizontal and longitudinal spacing of stiffener welds and the increase of
tensile strip thickness all enhance the mechanical behaviors such as resistance and ductility. (问题
7)The optimum spacing Sa and Sb are suggested to be 1/2 of cross-sectional dimension (in this
paper is 100mm). The tensile strip is suggested to have the same thickness with the steel tube.
Acknowledgements
The project is supported by National Natural Science Foundation of China (51208241) and by
Fundamental Research Funds for the Central Universities (lzujbky-2013-m01).
Reference
[1] Wang YY, Yang YL, Zhang SM. Static behaviors of reinforcement-stiffened square
concrete-filled steel tubular columns. Thin-Walled Structures 2012; 58: 18-31.
[2] Ge H, Usami T. Strength of concrete-filled thin-walled steel box columns: experiment, Journal
of Structural Engineering 1992; 118: 3036-3054.
[3] Kwon YB, Song JY, Kon KS. The structural behavior of concrete-filled steel piers, Proceedings
of 16th Congress of IABSE, Lucerne (2000).
[4] Tao Z, Han LH, Wang ZB. Experimental behavior of stiffened concrete-filled thin-walled
hollow steel structural (HSS) stub columns. Journal of Constructional Steel Research 2005; 61:
962-983.
[5] Kitada T. Ultimate strength and ductility of state-of-the-art concrete-filled steel bridge piers in
[6] Chen Y. Research on static behaviors of new type concrete-filled thin-walled steel tubular
columns. Dissertation for the Doctoral Degree in Engineering, Harbin Institute of Technology; 2006.
[in Chinese]
[7] Xu C. Experimental study of hysteretic behavior for concrete-filled square thin-walled steel
tubular columns. Journal of Constructional Steel Research 2007; 63: 317–325.
[8] Hsu HL, Juang JL. Performance of thin-walled box columns strengthened with internal braces.
Thin-Walled Structures 2000; 37:241-258.
[9] Cai J, He ZQ. Axial load behavior of square CFT stub column with binding bars. Journal of
Constructional Steel Research 2006; 62: 472–483.
[10] Cai J, He ZQ. Constitutive relationship of square CFT with binding bars. Journal of
Engineering Mechanics 2006; 132: 145-150.
[11] Huang CS. Axial load behavior of stiffened concrete-filled steel columns. Journal of Structural
Engineering 2002; 128: 1222-1230.
[12] GB/T 228-2002. Metallic materials-tensile testing at ambient temperature. Beijing, China:
General Administration of Quality Supervision, Inspection and Quarantine of the People's Republic
of China; 2002. [in Chinese]
[13] GB 50010-2010. Code for design of concrete structures. Beijing, China: Ministry of Housing
and Urban-Rural Development of China, General Administration of Quality Supervision, Inspection
and Quarantine of the People's Republic of China; 2010. [in Chinese]
[14] EN1994-2: 2005. Design of composite steel and concrete structures. Britain: European
Committee for Standardization; 2005.
[15] Guo LH, Zhang SM, Kimb WJ, Ranzic G. Behavior of square hollow steel tubes and steel
[16] Mander JB, Priestley MJN, Park R. Theoretical stress-strain model for confined concrete.
Journal of Structural Engineering 1998; 114: 1804-1826.
[17] Yang ZY. Research on static behavior of square concrete-filled steel tubular stub columns with
steel bar stiffeners. Dissertation for the Master Degree in Engineering, Harbin Institute of
Technology; 2008. [in Chinese]
[18] GB 50017-2003. Code for design of steel structures. Beijing, China: Ministry of Housing and
Urban-Rural Development of China, General Administration of Quality Supervision, Inspection and
(a) (b) (c)
[image:25.595.89.499.76.411.2](d) (e)
(a) (b)
[image:26.595.73.525.72.423.2](c) (d)
Fig.2 Longitudinal arrangement of stiffeners on two adjacent steel plates (unit: mm) (a) S2/S6; (b) S3/S8; (c) S7; and (d) S4/S9/S10
(a) (b) (c)
[image:26.595.94.511.481.670.2](a) (b) (c) (d) Fig. 4 Buckling mode of the S1 tube
(a) Surface 1; (b) Surface 2; (c) Surface 3; and (d) Surface 4
[image:27.595.76.520.549.751.2](a) (b) (c) (d)
Fig. 5 Buckling mode of the S5 tube
(a) Surface 1; (b) Surface 2; (c) Surface 3; and (d) Surface 4
(a) (b) (c) (d)
1600KN
Descending stage
2000KN 1600KN
Descending stage Descending stage
1400KN 1800KN
1800KN
1800KN 2000KN
1200KN
1600KN
2800KN
2500KN 2500KN
3000KN
2800KN 2800KN
900KN
600kN 800KN
1400KN 600KN
1200KN 1200KN
Fig. 6 Buckling mode of the S4 tube
(a) Surface 1; (b) Surface 2; (c) Surface 3; and (d) Surface 4
[image:28.595.80.528.371.541.2](a) (b) (c) (d)
Fig. 7 Buckling mode of the S9 tube
(a) Surface 1; (b) Surface 2; (c) Surface 3; and (d) Surface 4
(a) (b) (c) (d)
Fig. 8 Concrete failure mode of the S5 specimen (a) Surface 1; (b) Surface 2; (c) Surface 3; and (d) Surface 4
(a) (b) (c)
Concrete crush Concrete crush
Concrete crush
Concrete crush Concrete crush
Concrete crush Concrete crush
Descending stage
Descending stage Descending
stage Descending
stage Descending
stage
[image:28.595.91.498.580.765.2]Fig. 9 Concrete failure mode of the S9 specimen (a) Surface 1; (b) Surface 3; and (c) Surface 4
0 1 2 3 4 5 6
0 500 1000 1500 2000 2500
S1 S2 S3 S4
P
/
kN
u / mm 0 1 2 3 4 5 6
0 500 1000 1500 2000 2500 3000
S5 S6
S7 S8
S9 S10
P
/
kN
u / mm
[image:29.595.112.522.356.694.2](a) (b)
Fig.10 Axial load-axial shortening relation curves of specimens
(a) Group I (nominal tube thickness is 2.0mm); (b) Group II (nominal tube thickness is 3.5mm)
(a) (b)
Fig.11 Boundary conditions of plates in square CFST (a) in cross sections; (b) along longitudinal direction
[image:29.595.210.521.360.525.2] [image:29.595.206.392.589.686.2]0 200 400 600 800 0
200 400 600 800
Resis
tance with form
ula (kN)
[image:30.595.184.395.92.266.2]Resistance with finite element method (kN)
Fig. 13 Verification of formula for elastic buckling strength '
[image:30.595.199.398.333.455.2]cr f
Fig.14 Compressive stress-strain relation for steel tube and reinforcement
[image:30.595.205.391.506.628.2](a) (b) (c) (d)
[image:31.595.93.492.418.757.2]Fig.16 Constraint region of concrete in stiffened cross section (a) S1/S5; (b) S2/S4/S6/S9/S10; (c) S3/S8; and (d) S7
Fig.17 Longitudinal distribution of confinement for concrete
0 1 2 3 4 5 6
0 500 1000 1500 2000 2500 Test Simulation P / kN
u / mm
0 1 2 3 4 5 6
0 500 1000 1500 2000 2500 Test Simulation P (kN)
u / mm
(a) (b)
0 1 2 3 4 5 6
0 500 1000 1500 2000 2500 Test Simulation P / kN
u / mm 0 1 2 3 4 5 6 0 500 1000 1500 2000 2500 Test Simulation P / kN
u / mm
0 1 2 3 4 5 6 0 500 1000 1500 2000 2500 3000 Test Simulation P / kN
u / mm 0 1 2 3 4 5 6 0 500 1000 1500 2000 2500 3000 Test Simulation P / kN
u / mm
(e) (f)
0 1 2 3 4 5 6
0 500 1000 1500 2000 2500 3000 Test Simulation P / kN
u / mm 0 1 2 3 4 5 6 0 500 1000 1500 2000 2500 3000 Test Simulation P / kN
u / mm
(g) (h)
0 1 2 3 4 5 6
0 500 1000 1500 2000 2500 3000 Test Simulation P / kN
u / mm 0 1 2 3 4 5 6 0 500 1000 1500 2000 2500 3000 Test Simulation P / kN
u / mm
[image:32.595.93.496.78.607.2](i) (j)
Fig.18 Comparison of test and simulation results
0 2000 4000 6000 8000 10000 12000 0 2000 4000 6000 8000 10000 12000
Pt / kN
[image:33.595.180.421.78.293.2]C.S.Huang (2002) Cai (2006) Han (2005) Chen (2006) Yang (2008) Yang (2011) Pp / kN
Fig. 19 Comparison between predicted ultimate resistances and experimental ultimate resistances in
other scholars’ research
0 3 6 9 12
0 1000 2000 3000 4000 5000 200 150 100 67 50 33 25 20 P / kN
u / mm 0 50 100 150 200 250
0 1000 2000 3000 4000 5000 P u / kN b/t (a)
0 2 4 6 8 10 12
0 500 1000 1500 2000 2500 3000 20.1MPa 26.8MPa 32.4MPa 38.5MPa 44.5MPa 50.2MPa P / kN
u / mm 10 20 30 40 50 60
0 500 1000 1500 2000 2500 3000 P u / k N
fck / MPa
(b) +10%
0 2 4 6 8 10 12 0 500 1000 1500 2000
235MPa 345MPa 390MPa 420MPa
P
/ kN
u / mm 200 250 300 350 400 450 500
0 500 1000 1500 2000 P u / k N
fy / MPa
(c)
0 2 4 6 8 10 12
0 500 1000 1500 2000
25mm 50mm
75mm 100mm
150mm 200mm
P
/ kN
u / mm 0 50 100 150 200 250
0 500 1000 1500 2000 P u / kN
Sa/ mm
(d)
0 2 4 6 8 10 12
0 500 1000 1500 2000
25mm 50mm
75mm 100mm
150mm 200mm
P
/ kN
u / mm 0 50 100 150 200 250
0 500 1000 1500 2000 P u / kN
Sb/ mm
(e)
0 2 4 6 8 10 12 0 500 1000 1500 2000 2500
2mm 3mm 4mm
5mm 6mm 7mm
8mm
P
/ kN
u / mm 0 2 4 6 8 10
0 500 1000 1500 2000 2500 P u / kN
tr / mm
0 2 4 6 8 10 12 0
500 1000 1500 2000
235MPa 345MPa 390MPa 420MPa
P
/ kN
u / mm
200 250 300 350 400 450 500
0 500 1000 1500 2000
P
u
/ kN
fyr / MPa
[image:35.595.115.553.77.232.2](g)
Fig.20 Parametric analysis
(a) Depth-to-thickness ratio b/t; (b) Concrete strength fck; (c) Yielding strength of steel tubes fy; (d) Longitudinal
spacing of stiffener welds Sa; (e) Horizontal spacing of stiffener welds Sb; (f) Thickness of tensile strips tr; and (g)
Table1 Parameters of specimens
Specimen Stiffener type
Tube thickness
t (mm)
Cross-sectional dimension of stiffener
d/dr×tr(mm)
Longitudinal spacing of stiffener’s welds
s (mm)
Steel ratio of tube
αs (%)
Steel ratio of
stiffener
αr(%)
S1 None 2.01 — — 4.2 0
S2 Battlement-shaped reinforcement 1.90 8.0 80 4.2 0.84
S3
Oblique
battlement-shaped reinforcement
1.90 8.0 80 4.2 1.08
S4 Tensile strip 1.90 20.0×3.49 100 4.2 0.70
S5 None 3.49 — — 7.5 0
S6 Battlement-shaped reinforcement 3.49 8.0 80 7.5 0.84
S7 Welded circular stirrup 3.49 8.0 80 7.5 0.86
S8
Oblique
battlement-shaped reinforcement
3.49 8.0 80 7.5 1.08
S9 Tensile strip 3.49 20.0×3.49 100 7.5 0.70
S10 Tensile strip 3.49 20.0×2.01 100 7.5 0.40
Table2 Material properties of the steel tubes and stiffeners
Steel pattern
Nominal thickness
t (mm)
Nominal diameter
d (mm)
Elastic modulus
Es (105N/mm2)
Yield strength
fy (N/mm2)
Ultimate strength
fu (N/mm2)
Steel tube I 2.0 — 1.90 301 400
Steel tube II 3.5 — 1.95 315 434
Reinforcement — 8.0 — 304 463
Tensile strip I 2.0 — 1.90 301 400
Tensile strip II 3.5 — 1.95 315 434
Table3 Mix proportions of concrete (kg/m3)
Portland cement Sand Gravel Water Coal ash Water reducing agent
[image:36.595.88.507.92.380.2]325 740 1030 185 75 10.4
Table 4 Resistance and classification of composite sections
Group Specimen Buckling load
Pb (kN)
Yielding load
Py (kN)
Peak load
Pu (kN)
Section classification
Group I
S1 600 1900 2185 Class 4
S2 1000 1900 2051 Class 4
S3 1200 1900 2127 Class 4
Group II
S5 2500 2211 2630 Class 3
S6 Exceeding Pu 2211 2567 Class 2
S7 Exceeding Pu 2211 2706 Class 2
S8 Exceeding Pu 2211 2746 Class 2
S9 Exceeding Pu 2211 2726 Class 2
[image:37.595.82.514.120.423.2]S10 Exceeding Pu 2211 2538 Class 2
Table 5 Test results
Group Specimen Stiffener Pn (kN) Pu (kN) RI µ DI
Group I
S1 None 1920 2185 1.13 1.97 1.00
S2 Battlement-shaped reinforcement 1894 2051 1.08 2.68 1.35
S3 Oblique battlement-shaped reinforcement 1894 2127 1.12 4.48 2.26
S4 Tensile strip 1894 2163 1.14 2.90 1.46
Group II
S5 None 2314 2630 1.14 1.76 1.00
S6 Battlement-shaped reinforcement 2314 2567 1.11 2.57 1.46
S7 Welded circular stirrup 2314 2706 1.17 2.73 1.55
S8 Oblique battlement-shaped
reinforcement 2314 2746 1.19 3.12 1.77
S9 Tensile strip 2314 2726 1.18 2.59 1.47