City, University of London Institutional Repository
Citation
:
Dove, G. and Jones, S. (2013). Evaluating creativity support in co-design
workshops. Paper presented at the CHI 2013 Workshop: Evaluation Methods for Creativity
Support Environments, 27th April - 2nd May 2013, Paris, France.
This is the unspecified version of the paper.
This version of the publication may differ from the final published
version.
Permanent repository link:
http://openaccess.city.ac.uk/3060/
Link to published version
:
Copyright and reuse:
City Research Online aims to make research
outputs of City, University of London available to a wider audience.
Copyright and Moral Rights remain with the author(s) and/or copyright
holders. URLs from City Research Online may be freely distributed and
linked to.
Evaluating Creativity Support in Co
-
Design Workshops
Graham Dove
Centre for HCI Design
City University London
graham.dove.1@city.ac.uk
Sara Jones
Centre for Creativity in
Professional Practice
City University London
s.v.jones@city.ac.uk
ABSTRACT
Participatory, co-design and creativity workshops can lead to more useful, usable and innovative systems design. However, evaluating the effectiveness of the creativity support provided by different technologies and workshop techniques is challenging. This is especially so when evaluation takes place during the workshop and maintaining a creative atmosphere is important. In this paper we briefly outline the development of one simple method of evaluation we have designed whilst studying the use of information visualizations within generative design workshops. Here we discuss how reflective postcards are used to replace questionnaires as a way to collect participants’ responses.
Author Keywords
Evaluation, Creativity Support, Participatory Design
ACM Classification Keywords
H.5.m. Information interfaces and presentation (e.g., HCI): Miscellaneous.
General Terms
Human Factors; Design;
INTRODUCTION
Participatory approaches to human-centred design, characterized by the active involvement of users and other stakeholders, can lead to more useful and usable systems [7]. Through practices such as co-creation [9] and creativity workshops [6], it has also been shown that such methods can be an effective way to discover novel requirements for complex socio-technical systems and design future experiences for their users. A key aspect of these approaches is the requirement for designers to provide the tools and facilitation skills that elicit participants’ possibly latent creativity. It is therefore crucial that as far as possible any such workshop retains an atmosphere that is relaxed, supportive, engaging and playful.
When undertaking academic research to study the effectiveness of particular technologies, techniques or activities, it is sometimes important to collect evaluation data from participants during the workshop itself. This
creates something of a conflict as stopping generative activities to ask participants to complete questionnaires serves only to highlight academic concerns. This can also draw attention to any possible concerns participants have that they themselves are being judged, which can be a cause of anxiety. Because of this we have sought evaluation methods that become part of the workshop’s creative activities. In this paper we will briefly outline the development of a simple method that, whilst not entirely novel in its intentions, is one we hope will be of interest. We have found it useful in capturing evaluation data similar to that in questionnaires but using a form factor that is more appropriate to the workshop context. Here, individual postcards containing prompts designed to capture participants’ reflections are used to assess selected aspects of the workshop up to that point. We do this in order to evaluate the support participants feel a particular technology or technique has provided them for their role in the workshop activities they have just undertaken. In the following sections we will first provide some background to our wider research, before discussing the stages that led to the development of this evaluation method. We will then describe how it has been used in practice and close with a brief discussion of its effectiveness.
BACKGROUND
In our research [4], we are investigating ways information visualization can be used in conjunction with generative tools and creativity techniques to support participatory design research. This is in response to the large amounts of data organizations now hold, following the movement of services and transactions online and as a result of the increasing ubiquity of computing systems. These data can be reused, offering an opportunity to create innovative products and services, but the contexts surrounding these data present all the difficulties associated with ‘wicked problems’. To address these challenges we seek to provide participants with a combination of tools, techniques and support that enables them to better understand data, explore current context and imagine possible futures. By information visualization we are referring to the graphical representation of data. This will often, although not exclusively, be interactive. By generative tools we are referring to methods whereby stakeholder representatives are provided with the materials and techniques, such as those needed for making collages, to help them generate new ideas that reveal requirements or inspirations for design.
In our research we need to evaluate the introduction of information visualizations into different types of generative workshop activity. In addition we need to evaluate how effective different generative activities are in helping participants and designers gain a shared understanding of data. We must also evaluate the effectiveness of different styles of information visualization and their appropriateness within our workshop activities. Each of these evaluations takes place within the context of participatory design workshops. Following Warr and O’Neill’s description of design as a social creative process [10] we frame these evaluations in three parts, addressing the creative process, the creative product and the creative person. This is described further elsewhere [4]. In the remainder of this paper we will outline our method for assessing participants’ self-reported evaluation of how effectively they feel a particular technique or technology has supported them in their role as a creative person within an ongoing workshop.
DEVELOPING THE REFLECTIVE POSTCARDS Stage 1: Separate Questionnaires
In an earlier piece of research, evaluating the support a large-scale interactive visualization of student satisfaction data provided for collaborative ideation [3] we had used three separate questionnaires to address system usability [1], creativity support [2] and insight support. The third of these was a questionnaire we developed ourselves based on previous work outlining the nature of insight as discussed in the visualization community [8] and analysis of how such insights are acquired whilst visually exploring data [11]. Whilst each of these questionnaires was successful in addressing the concerns it covered, the process of completing them all was a chore for participants. This had a negative impact on the quality of the responses to subsequent open questions we asked to probe participants’ qualitative experiences.
Stage 2: A Single Questionnaire
As a result of this, when we undertook a study comparing the effectiveness with which two different styles of information visualization provided stimuli for ideation, we decided first to separate out the usability evaluation and then to combine the creativity support and insight support questionnaires into one. Here we wanted to design a short and simple questionnaire that would quickly address participants’ responses to the most salient aspects under investigation. This would then form a small but nonetheless significant aspect of our overall evaluation plans. The result was a seven-part questionnaire that used a Lickert scale rating, ranging from 1 strongly agree to 5 strongly disagree. The first four statements in it are derived from the Creativity Support Index [2] and the final three from the insight support questionnaire we had developed based on visualization literature [8,11]. The questionnaire statements are listed below:
1. I was very engaged and absorbed using the
visualisation. I enjoyed it and would do it again.
2. I was prompted to generate ideas that were new and varied.
3. I was able to work together with others easily.
4. I felt able to explore many different options, ideas or outcomes.
5. I could easily identify relationships and patterns in the data that contributed to new ideas.
6. It was easy for me to gain an overview of the data using the visualization.
7. I was able to combine my existing knowledge with insights from exploring the visualization to generate ideas that I had not previously considered.
This questionnaire was successful in the context of a design experiment as it captured responses to our main concerns. However, here it was being presented at times when there was a clear and intentional break in the flow of creative activities, and where a change of atmosphere was both appropriate and desired.
Stage 3: Reflective Postcards
This would not be the case in a workshop in which end users and other stakeholders were participants. Here we would want to keep the focus of those participants away from our academic concerns. We would not want them to feel they were being assessed and we would not want to break the flow of generative creativity. Here we would need an alternative format. The criteria we had for an evaluation method were as follows. First, it should feel personal, encourage reflection and allow for creative responses. Second, it should be relatively short but directed at answering particular areas of concern. Third, it should fit into the activities of the workshop without changing the atmosphere or drawing participants’ attention to assessment. Fourth, it should use a mechanism that would be familiar to all participants. Finally it should be able to capture data replacing the Lickert scale responses and also the open questions we had asked in previous questionnaires. Gaver & Dunne’s use of cultural probes [5] tells us about the effectiveness of well-designed prompts and intriguing artifacts in eliciting responses from people, and this was a source of inspiration in our decision to use postcards as a medium to collect evaluation data. Postcards are individual artifacts that limit the space in which responses can be written but which are flexible enough to provide the opportunity for creativity. They have a form factor that is both familiar to people and evocative of sharing. They also suggested a playful means of collection to complete the activity, and so we made a small red postbox for participants to ‘send’ us their reflections.
USING THE REFLECTIVE POSTCARDS
which we are investigating possible new products or services that could be developed using the data generated by smart home technologies. Within this project a sophisticated model of typical energy consumption patterns has been developed. We used the data generated by this model to build interactive information visualizations that provided stimuli during a pair of workshop activities. In the first, participants worked in small groups to create collages describing different aspects of the household they imagined might be represented by the energy consumption data. In the second, these data were further explored to complete a competition entry outlining ways in which the imagined household could be smarter in their energy use.
These imaginary households and the contexts of their energy consumption behaviour would later be used as inspiration in service design activities, but we wanted to evaluate participants’ responses to using the information visualizations immediately following the activities in which they were being used. In order to achieve this each participant was given three separate postcards. Each postcard had a different reflection prompt written on it that we asked participants to respond to. We chose to use prompts that asked for reflection rather than standard open questions because we felt that this approach would encourage participants to think critically and discuss both what had been effective and also what hadn’t worked. These prompts were derived from the questions we had used in the earlier design experiment.
Reflection Prompt 1
The first prompt addresses engagement and collaboration, similarly to statements 1 and 3 in our earlier questionnaire. “Please reflect on your involvement in the previous two activities. Write a few sentences thinking in particular about how engaged you were, how absorbed or distracted, and how easily you feel you worked with other members of your team. Try to think about the extent to which the technology helped or hindered you in this regard.”
Reflection Prompt 2
The second prompt addresses idea generation, exploration of alternatives, and the ease with which participants could utilize their knowledge and experience. This is similar to statements 2, 4 and 7 in the questionnaire.
“Please reflect on how you used the data visualization to first create your household and then to devise competition answers. Write a few sentences, thinking in particular about how easily you were able to explore possible options and come up with different ideas. Did you use your prior knowledge as well as the information shown? And how easy you found it to relate that prior knowledge to the data?”
Reflection Prompt 3
The third prompt addresses participants’ ability to gain an overview and to identify relationships and patterns within data. This is similar to statements 5 and 6 in the questionnaire.
“Please reflect on your understanding of the information contained in the data visualization. Write a few sentences, thinking in particular about how easily you managed to gain an overview of what was represented. Also think about how quickly you grasped what the information meant, did you spot clear patterns and relationships or did you find it confusing? Did it prompt you to think of ideas you had not previously considered?”
EXAMPLE REPONSES TO REFLECTIVE POSTCARDS
Participants responded well to the postcards, taking the time and effort to provide considered responses addressing both positive and negative factors. We have listed example responses to each of the postcards below.
Reflective Postcard #1
“It was easy to work with the group, we were open to each others opinions. Technology was useful for us to investigate our views and to help discussion. The display of the information was interpreted differently by others but this helped with discussion.”
“I felt engaged and absorbed with the tasks and comfortable working with the other members. Some of the information in task 1 was a little overwhelming. The technology was very useful.”
Reflective Postcard #2
“The iPad data visualisation was very useful as it made it surprisingly easy to look at each piece of data and also caused the data to be better laid out. I could also use it with my own knowledge which I had to do for the first task.” “Did use prior knowledge and so did other team members. Needed to focus back on house and empathise what they were like. iPad data didn’t really contribute to ideas.”
Reflective Postcard #3
“Definitely. You had a broad overview and you could drill down to get clearer answers. This interactivity flowed very well and really demonstrated well how this family behaved.”
“It was easy to get an overview about each group of data due to how it was laid out and that made it very easy to compare the data and come to assumptions about it.”
ANALYSIS OF REFLECTIVE POSTCARDS
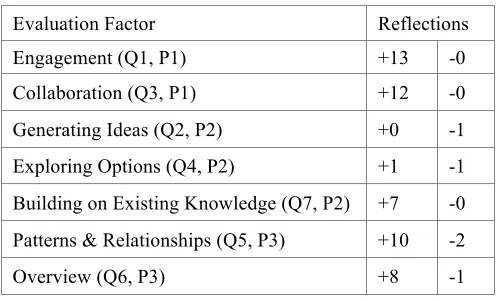
Evaluation Factor Reflections
Engagement (Q1, P1) +13 -0
Collaboration (Q3, P1) +12 -0
Generating Ideas (Q2, P2) +0 -1
Exploring Options (Q4, P2) +1 -1
Building on Existing Knowledge (Q7, P2) +7 -0
Patterns & Relationships (Q5, P3) +10 -2
[image:5.612.48.297.59.209.2]Overview (Q6, P3) +8 -1
Table 1: Analysis of Responses on Reflective Postcards
The Reflective Postcards are not designed to capture data in the depth required for a systematic qualitative analysis. However they do provide responses similar to those from open-ended questionnaire questions. This helped with Reflective Postcard #2, where responses had not referred directly to the subjects posed in the prompt. Here, participants took as much consideration as they did with the other postcards, but we found they were taking the opportunity to provide us with suggestions for improvement or more generally helpful feedback. For example one participant wrote:
“Very helpful. Couldn’t do it without. Some minor improvements (red for bad?). Took knowledge to use it. May be difficult for non-expert.”
Whilst another participant used it as an opportunity to relate the workshop to the wider trial of smart home technology that our participants are a part of:
“To an extent, not having full Greenwave socket data on major appliances. Much of it was a ‘guesstimate’.”
DISCUSSION
The responses to Reflective Postcards #1 and #3 suggest that they can be an effective replacement for questionnaires within a workshop. However the evidence from Reflective Postcard #2 suggests further refinement is needed to explore their limitations. It could be that participants did not specifically address the question of idea generation in Reflective Postcard #2 because the activities undertaken with the visualization were not obviously ones requiring divergent thinking or rapid idea generation and instead participants took the opportunity to share more general thoughts. Or it may be that this prompt, in addressing three separate concerns jointly, was too ambitious or simply not clear enough. Further study and improved piloting will help identify and militate against similar problems in future. These postcards offer us more than a simple replacement for questionnaires though. Their format is flexible and affords participants the opportunity to be creative in their responses. They are also informal and do not draw attention to notions of assessment. In their use we are investigating participants’ reflections regarding the support particular
techniques or technologies can provide them in their role as a creative person undertaking workshop activities. We need to do this in a way that maintains the atmosphere of the workshop and the postcards seem to meet the requirements to achieve this. So far, participants have responded to the postcards with a good level of enthusiasm and they seem to like their somewhat homemade styling. In order to encourage this aspect we are continuing to adapt the postcards and develop them as artifacts by adding images and providing envelopes addressed to us personally, in case participants wish to take them away, reflect further and return them to us by post. As a method of evaluation, the postcards are simple and yet effective in assessing the support provided to participants as the creative person.
ACKNOWLEDGEMENTS
We would like to thank Alison Duffy for her help.
REFERENCES
1. Brooke, J., SUS-A quick and dirty usability scale. Usability evaluation in industry 189 (1996) 194. 2. Carroll, E.A, Latulipe, C., Fung, R., Terry, M.,
Creativity Factor Evaluation: Towards a Standardized Survey Metric for Creativity Support. In Proc. C&C ‘09, ACM Press (2009), 127-136
3. Dove, G. CityVis A Visualization Tool to Support
Exploratory Creative Ideation on City University Data. MSc Dissertation (2011)
http://www.grahamdove.com/papers/cityvis.pdf 4. Dove, G., Jones, S., Dykes, J., Duffy, A., and Brown,
A., Using Data Visualization in Creativity Workshops. Submitted to C&C 13 (2013)
http://www.grahamdove.com/papers/candc2013.pdf 5. Gaver, B., Dunne, T., & Pacenti, E. Design: cultural
probes. interactions, 6(1), (1999), 21-29. ACM
6. Jones, S., Maiden N.A.M., Karlsen K., Creativity in the
Specification of Large-Scale Socio-Technical Systems in Proc. CREATE 2007 (2007) 41 – 46
7. Muller, M.,J., Kuhn, S., Participatory Design. In Communications of the ACM, 36, 6 (1993), 24-28
8. North, C., Towards Measuring Visualization Insight,
Computer Graphics and Applications, IEEE 26,3 (2006) 6-9
9. Sanders, E.B.N, Information, Inspiration and
Co-creation. In Proc. 6th International Conference of the European Academy of Design. (2005)
10. Warr, A., & O'Neill, E. Understanding Design as a Social Creative Process. In Proc. C&C ‘05 ACM Press (2005) 118-127.