JOURNALOFVIROLOGY,Sept. 1975,p.720-724 Copyright 0 1975 American Society for Microbiology
Vol. 16, No. 3 PrintedinU.S.A.
NOTES
Denaturation Map of Polyoma DNA
BERNARD
LESCURE
ANDMOSHE YANIV*
Institut Pasteur,
Departementde
Biologie Moleculaire,
75015Paris, France
Received for
publication
6May
1975A
denaturation
mapof
polyoma DNA cleaved by Eco
R,
toform
linear
molecules
wasestablished
by electron microscopy. Partial denaturation, under
the
sameconditions,
of
fragments
obtained by
Haemophilus influenzae
restric-tion
enzymesallowed
us toalign the denaturation
mapwith the already
established physical
mapof
polyoma DNA (Griffin
et
al., 1974).
Polyoma
virus
DNA
consists of
double-stranded circular molecules. Physical mapping
of
the viral DNA
is
important for
localizing
functionally
important
regions
of
the
genome
(recognition
sites of various proteins, early
and
late
genes, etc.).
A
map has
been recently
published
using specific fragments
produced
by
restriction enzymes.
Localization
of
the A-T- or
G-C-rich
regions of
the
molecules could be
independently obtained by
partial denaturation
mapping. These
two
maps
could be
superim-posed
by establishing
the denaturation
pattern
of
isolated fragments
obtained after cleavage
by
restriction
enzymes.
In
previous
studies
(1,
8), partial
denatura-tion
of
relaxed
circular
polyoma DNA
was
studied. The
absence
of a
reference
point on
circular DNA caused difficulties
in
the
interpre-tation
of the
results. Eco
R,
(Escherichia
coli
RO)
restriction
enzyme
introduces
one
double-strand break (11)
at a
unique site (4,
13)
in
polyoma DNA. The linear molecules
were
par-tially denatured by alkaline
treatment
(10) and
then
spread for electron microscopy
in
the
pres-ence
of
cytochrome
c
by
the
formamide
tech-nique
(5). Figure
1A shows
two
partially
dena-tured molecules
examined
by
electron
micros-copy. All
the molecules
of unit
length that
were
observed
showed a common structure:
one
of
the ends
was
denatured
whereas the other
end
was
native. This
property
helped
to orient
partially denatured
molecules relative
to
each
other without
ambiguity.
The size and distance
to
the end of
the denaturation
loops
were
thus
measured
on 50
molecules
(Fig.
2A).
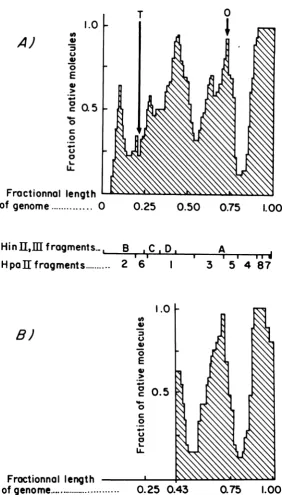
The
histo-gram of the native
regions
derived from
the
denaturation maps of
Fig.
2A is
shown
in
Fig.
3A. At pH 11,
used
for
partial denaturation,
three
major
native
regions
appeared
to
be
lo-cated
at,
respectively,
0.42,
0.71,
and
0.90 to
1.00
fractional lengths from the
left-hand
(dena-tured) end
of
the
molecules, and three minor
native regions
appeared
to
be located
at,
respec-tively,
0.09, 0.27,
and
0.63.
These regions
are
presumably rich
in
G-C base
pairs.
Four
main
regions,
which
denatured readily and
were
prob-ably rich
in
A-T
base
pairs,
were
located
at,
respectively,
0 to
0.07, 0.13 to 0.24, 0.52 to 0.58,
and
0.78 to 0.86 from
the left-hand end
of
the
molecules. Further
experiments were
necessary
to
correlate the linear denaturation
map
with
the
physical map
of
the
Hpa II
(Haemophilus
parainfluenzae) fragments of polyoma DNA
recently
established (9). To solve this problem,
we
studied the denaturation
of
fragments
pro-duced
by cleavage
with Hin
(Haemophilus
influenzae) restriction enzymes. Hin III
en-zyme
introduces
two
breaks
in
polyoma
DNA
at,
respectively,
0.015
and
0.455
genome
lengths
from
the Eco
R,
site to
produce
two
fragments
(9).
Hin
II enzyme
introduces
two
breaks
in
polyoma
DNA at,
respectively,
0.26
and
0.36
genome
lengths (2,
7; our
unpublished
observa-tions).
Thus, the simultaneous digestion
of
polyoma
DNA
by
Hin II and Hin III
gives four
fragments: a major fragment of 0.56 fractional
length
of
the molecule and three
minor
frag-ments
(0.25, 0.098, and
0.087
fractional
lengths).
The
mixture
of the
Hin
fragments
was
used
for
partial alkaline
denaturation
under
the
conditions
described
above for Eco
R,
linear
DNA.
Fig.
1B shows two
partially
denatured
major molecular fragments.
Twenty-five
mole-cules were
scanned
and measured for
denatura-tion
loops
(Fig.
2B).
The
histogram
of
the native
regions
derived
from
the individual
denatura-tion
maps of
Fig.
2B
is
presented
in
Fig.
3B.
These results
clearly
show that the
histogram
of
720
on November 10, 2019 by guest
http://jvi.asm.org/
FIG. 1.
Vizualisation of
partially denatured molecules. Electron microscopy of
twopartially
denatured EcoR,
linear polyoma DNA molecules (A) and of two Hin
IIand
IIIpartially denatured major fragmentsof
polyoma
(B). Polyoma DNA was extracted from
primary mouse kidney cells cultures infected at 40
PFU/cell
with virus
derived from recent plaque isolates. The digestion pattern of this
DNAby Hpa
IIis similar
tothat
described by
Griffin
etal.
(9).
Polyoma DNA (0.2
ug) from
Eco
R1
orHin
IIand
IIIdigestion
wasincubated in
8,ul of
asolution containing 30 mM
Na2CO,,
6 mM EDTA, and
10%of
formaldehyde, previously
adjusted to pH
11with
NaOH. After 15 min, the incubation mixture was diluted to
avolume
of 0.04
mland to a final concentration of
0.1 M
Tris-hydrochloride, pH 7.5, 10 mM EDTA, and 50% formamide, and then spread in the presence of
cytochrome
con
ahypophase of
17o formamide. Grids were picked and rotary shadowed with Pt.Pd. They were
examined
andphotographed with a Siemens Elmiskop 101 microscope at a magnification of 16,000. DNA
molecules were
measured on photographic enlargements, using a laboratory-made coordinatometer connected
to
a
PDP-8 digital computer.
721
on November 10, 2019 by guest
[image:2.499.103.389.25.571.2]722
NOTES
0
.25
.50
.75
A.
Fractiona/
length
of
gmnome
1
0
.1 .2
I.3
.4
.5
I.5
B.
Fr,xtionl/
length
of
genorne
FIG.
2.(A)
Alkaline
denaturation
mapsof
Eco R1 linear polyoma DNA. Black
areas representthe
denatured
part
of
the molecules. The unit length scale represents the average length, 1.83±
0.09Am.
(B) Alkalinedenaturation
mapsof 25 Hin II and III major fragments of polyoma DNA. The unit scale length represents theaverage
length,
1.03±
0.06gm.
m
. lmmlmr...
J. VIROL.
on November 10, 2019 by guest
http://jvi.asm.org/
[image:3.499.127.399.116.520.2]A)
1.0
in 075
u
._ 0
E
oc05
0
0 L.
Froctionnol
length
L
of
genome
...0
0.25
0.50
0.75
1.00
Hi
nl,JM
f
rogments.-
,
H
paoI
f
ragment
s...
B
,C.D.
2
6
1
A
,,
3
5 4
87
8)
Froctionnal
length
of
genome.
0.25
0.43
0.75
1.00
FIG.
3.Histogram
of
native
regions. (A)
Histogram
of
the native
regions
in the Eco
ft1
linear
partially
denatured DNA
derived
from
the maps shown in
Fig.
2A. Arrows
show the
origin
(0)
and the termination
(T)
sites
of polyoma replication.
(B)
Histogram of
thenative
regions
in the HinII
and IIIpartially
denatured
major
fragments
from the maps shown in
Fig.
2B. The
cleavage
sites
of
Hpa
II
and Hin II and III restriction enzymes
on
Eco
R1
linear
polyoma
DNA
arerepresented
between the
twohistograms.
the
major
fragment
from
Hin
II,
III
digestion
could be
easily
correlated with
the
right-hand
(native)
end of
the
EcoR,
linear
DNA
histo-gram of
denaturation
(Fig.
3A).
Therefore,
the
orientation of the
denaturation
map
can
be
unambiguously
defined
relative
to
the
map
of
Hpa
II
fragments
of
Griffin
et
al.
(9). Moreover,
these
results agree with
the order
and
base
composition of
polyoma
DNA
fragments
ob-tained
by digestion
with
Hpa
II
(9).
on November 10, 2019 by guest
http://jvi.asm.org/
[image:4.499.101.384.58.554.2]724
NOTES
It may
be significant that on polyoma as well
as on
simian
virus 40 (3, 6, 9, 12), the origin of
replication
is a
G-C-rich region
whereas
termi-nation of replication occurs in an A-T-rich
region.
This work was supported by grants from the Centre National de laRecherche Scientifique and the Jane Coffin Childs Memorial Fund for Medical Research.
We thank N. Acheson for the generous gift of polyoma DNA, B. Allet for the gift ofHaemophilus influenzae restric-tion enzyme, and F. Cuzin and M.Buckinghamfor valuable criticisms of themanuscript.Thehelpof0.Croissantand P. Oudet in electron microscopy techniques is gratefully ac-knowledged, as well as the expert technical assistance of A. Chestier and M.C. Dauguet.
LITERATURE CITED
1. Bourguignon, M.-F. 1968. Adenaturation map of poly-oma virus DNA. Biochem.Biophys. Acta 166:242-245. 2. Chen, M. C. Y., K. S.S. Chang, and N. P. Salzman. 1975.
Studies ofpolyoma virusDNA:cleavage map of the polyoma virus genome. J. Virol. 15:191-198.
3. Crawford,L.V.,A. K.Robbins,and P. M. Nicklin. 1974.
Location of theorigin and terminus of replication in polyoma virus DNA. J.Gen.Virol. 25:133-142.
4. Crawford, L. V., C. Syrett, and A. Wilde. 1973. The
replication of polyoma DNA. J. Gen. Virol. 21:515-521.
5. Davis, R. W., M. Simon, and N. Davidson. 1971.Electron microscope heteroduplex methods for mappingregions ofbase sequence homology in nucleic acids. Methods Enzymol.21D:413-428.
6. Fareed, G. C., C. F. Garon, and N. P. Salzman. 1972. Origin and direction of simian virus 40 DNA
replica-tion.J. Virol. 10:484-491.
7. Folk, W. A., B. K. Fishel, and D. M. Anderson. 1975. Polyoma genome cleaved by restriction endonuclease
kind
II.Virology 64:277-280.8. Follet, E. A., and L. V. Crawford. 1968. Electron micro-scope study of the denaturation of polyoma virus DNA. J. Mol. Biol. 34:565-573.
9. Griffin, B.E., M. Fried, and A. Cowie. 1974.Polyoma
DNA: aphysical map. Proc. Natl. Acad. Sci.U.S.A.
71:2077-2081.
10. Inman, R. B., and M.Schn6s. 1970. Partial denaturation ofthymine and 6-bromouracil containing X in alkali. J. Mol. Biol. 49:93-98.
11. Mertz, J. E., and R. Davis. 1972. Cleavage of DNAby Rl restrictionendonuclease generated cohesive ends. Proc. Natl. Acad.Sci. U.S.A. 69:3370-3374.
12. Mulder, C.,andH. Delius. 1972.Specificityof the break
produced by restricting endonuclease Rl in simian virus 40 DNA as revealed by partial denaturation mapping. Proc. Natl.Acad. Sci. U.S.A. 69:3215-3219. 13. Yaniv,M.,0.Croissant, and F. Cuzin. 1974. Location of the T4 gene 32 protein-binding site of polyoma virus DNA. Biochem.Biophys. Res. Commun.57:1074-1079.