DOI 10.1007/s40722-017-0092-8 R E S E A R C H A RT I C L E
A multi-objective optimisation approach applied to offshore
wind farm location selection
V. Mytilinou1 · A. J. Kolios1
Received: 2 February 2017 / Accepted: 6 July 2017 / Published online: 26 July 2017 © The Author(s) 2017. This article is an open access publication
Abstract This paper compares the three state-of-the-art
algorithms when applied to a real-world case of the wind energy sector. Optimum locations are suggested for a wind farm by considering only Round 3 zones around the UK. The problem comprises of some of the most important techno-economic life cycle cost-related factors, which are modelled using the physical aspects of each wind farm location (i.e., the wind speed, distance from the ports, and water depth), the wind turbine size, and the number of turbines. The model is linked to NSGA II, NSGA III, and SPEA 2 algorithms, to conduct an optimisation search. The performance of these three algorithms is demonstrated and analysed, so as to assess their effectiveness in the investment decision-making process in the wind sector, more importantly, for Round 3 zones. The results are subject to the specifics of the underlying life cycle cost model.
Keywords Round 3·Multi-objective optimisation·UK·
NSGAII·III·SPEA 2·Decision-making
1 Introduction
In the last few decades, a necessity to reduce carbon emis-sions has been raised after concerns of the global warming effect that causes rapid changes in the environment. In fact, electricity production was found to be responsible for at least 24% of the total greenhouse emitted gases, in 2013 (Lin and Chen 2013). The awareness around the environmental impact
B
A. J. Kolios1 Renewable Energy Marine Structures Centre for Doctoral
Training, Cranfield University, Cranfield, Bedfordshire MK43 0AL, UK
led to further alternative ways to generate energy for more sustainable solutions. According to the 20-20-20 target on reducing carbon emissions and the new Climate Conference in Paris (COP 21) on keeping the global warming tempera-ture below 2◦C, it is important to contribute to the renewable energy (RE) investment growth in the UK by making the investments more attractive, information-rich and less risky (BEC CREW 2015).
Wind energy is one of the fastest growing forms of RE in the UK; however, since structural material prices have significantly increased over the last years, it has a direct impact on larger scale wind projects, the overall cost of turbines, and their operational and maintenance costs (European Observation 2011; Lin and Chen 2013; Mytilinou et al. 2015). The UK technology roadmap high-lights that the offshore wind costs need to be reduced to £100 per MWh by 2020 and a greater confidence over financial motivations is required (Department of Energy and Climate Change 2011). The location of a wind farm and the type of support structure have great impacts on the installation costs. The most important costs in an offshore wind farm can be found in HM Government (2013).
The Crown Estate released Round 3 leases and provided 9 new considerably larger zones than Rounds 1 and 2; offshore wind farm zones will include up to 32 GW of power capac-ity. The new leases encourage larger scale investment plans and bigger wind turbines. The new zones include locations further away from the shore and deeper waters which could be more challenging (Department of Energy and Climate Change 2011; Renewables First 2017; The Crown Estate 2010a,b,2013).
Mar-Fig. 1 Methodology layout
tin et al. 2013). One of the most important decisions arising when starting a new investment is the selection of a suit-able offshore location and always requires extended effort. A methodology is proposed to help the decision-making process at these first stages of a wind farm investment considering the Round 3 zoned in the UK. Through this methodology, the location based on different physical aspects is selected.
The aim of this paper is to discover the optimum offshore Round 3 location based on financial costs and demon-strate the effectiveness of the underlying methods. The wind energy project costs associated with the design specifica-tions of the site in conjunction with the turbine type and number of turbines should be numerically captured. This considers physical aspects unique to each offshore location, such as wind speed, water depth, and distance from appro-priate construction ports, and will be modelled using life cycle cost (LCC) analysis. The best location should be dis-covered by considering the conflicting nature of the cost elements, so as to reduce overall cost at the early stages of a wind energy investment. Multi-objective optimisation algorithms will be coupled to the aforementioned model and used to reveal the interplay among the cost elements. To increase the effectiveness of the optimisation process and
the diversity of the results, three different algorithms will be employed.
The contribution to knowledge is as follows. First, the combination of a newly developed prototype framework that includes economic modelling and optimisation process is assessed, so as to select the optimum offshore Round 3 loca-tion of a wind farm in the UK. Second, a set of non-dominated optimal solutions is suggested using the prototype frame-work. Both are expected to assist project developers and researchers at the first stages of the design of a wind farm.
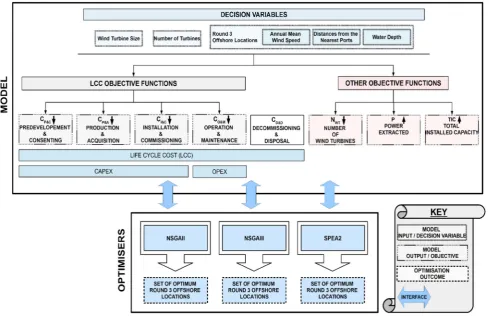
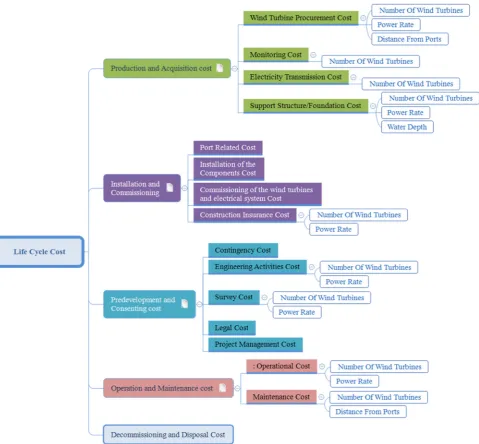
The suggested methodology is depicted in Fig.1. It com-prises of individual modules, coupled with generic interfaces, so as to enable incremental development. Here, the physi-cal aspects of each wind farm location (i.e., the wind speed, distance from the ports and water depth), the wind turbine size, and the number of turbines are considered, to manually select the optimum, economically efficient, and viable option (Shafiee et al. 2015).
[image:2.595.54.544.55.371.2]by a discussion. Future avenues will be drawn in the conclu-sions.
2 Literature review
2.1 Multi-objective optimisation
In real-world cases, multiple and conflicting objectives have to be improved simultaneously and multi-objective optimi-sation techniques have to be used, for example, minimising time versus energy efficiency (Branke et al. 2008).
During MOO, the decision space, the hyperplane that combines all the decision variables, is searched by evaluat-ing the constraints and objectives. At the end of the process, a set of solutions is obtained and they are at least as many as the considered objectives. This is frequently called the Pareto Optimal Set or Pareto Front, where it is not possible to improve any objective without compromising in any of the others (Adinolfi et al. 2015).
MOO assists decision makers in appreciating the trade-off among conflicting objectives, before selecting the optimum solution for implementation, while understanding the inter-play among the considered objectives. Some MOO studies can be found in Table1.
2.1.1 SPEA
Strength Pareto Evolutionary Algorithm (SPEA) is an evo-lutionary based algorithm and it is also an MOO algorithm. In other words, SPEA is an Evolutionary Multiple Objective algorithm or EMO. SPEA is closely related to other evo-lutionary algorithms such as the NSGA, Vector-Evaluated Genetic Algorithm (VEGA), and Pareto Archived Evolu-tion Strategy (PAES). SPEA has two versions, i.e., SPEA and SPEA 2, an extension of the former. More extensions can be found under the name SPEA+ and iSPEA. The aim of this algorithm is to locate and maintain a collec-tion of non-dominated solucollec-tions (Pareto front) by examining thoroughly the search area by following an evolutionary procedure.
SPEA discovers and maintains a set of Pareto optimal solutions. An evolutionary process is used to investigate through the search space. During the selection process, a utility function is used, where an assessment method for dominance is combined with a density estimator. An archive of the Pareto Front is kept separately from the population of potential solutions used in the evolutionary process, thus demonstrating a form of elitism (Brownlee 2011).
SPEA 2 was selected for this work due to its suitability for MOO problems (Brownlee 2011;Nalianda 2012). SPEA is appropriate for combinatorial and continuous function MOO problems. A binary representation can be used for continuous
function optimisation problems along with classical genetic operators such as one-point crossover and point mutation. In SPEA 2, the size of the archive is commonly smaller than the size of the population. It is possible to implement optimisa-tion in calculaoptimisa-tions of density (of the revealed soluoptimisa-tions) and Pareto dominance. More can be found inZitzler et al.(2001).
2.1.2 NSGA
NSGA stands for non-dominated sorting genetic algorithm and it is also an MOO algorithm and an EMO. Currently, there are three versions of the code: NSGA, NSGAII, and NSGAIII, among which the last two will be considered in this study. NSGAII has been employed on a number of optimisa-tion problems, mostly with two objectives, whereas NSGAIII is expected to be more appropriate when the number of objec-tives increases (Yuan et al. 2014), as in this research.
For comparison purposes, the performance of all three selected optimisers is depicted in Fig. 2, where they were applied to a benchmark test function with three objectives. Ideally, the trade-off should be as much dense and wide as possible, so as to uniformly cover the performance of the objective space. In Fig.2, the shape of a reference problem (which was not as complex as the developed LCC) is illus-trated. The application of these algorithms in the optimum selection of the wind farm location, as a class of problems, has never been attempted before. As part of the contribution to knowledge and to demonstrate by evidence the effective-ness of the optimisers to deliver non-dominated solutions in real-world modelling, all three optimisers were trialled. The optimisers were considered to compare the quality of the solutions, irrespectively of their internal functions. All algo-rithms can yield satisfactory results and are tested in different sectors according to the literature. Frequently, using one of them is acceptable and has delivered satisfactory results. As expected, there are advantages and disadvantages for each method, which will be investigated further below. Hence, employing all three methods will highlight the differences among them, as certain algorithms behave better in certain problems (Wolpert and Macready 1997).
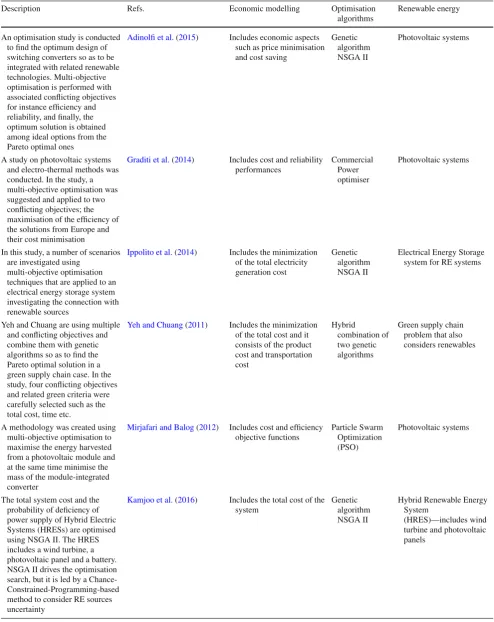
Table 1 Multi-objective optimisation in RE systems
Description Refs. Economic modelling Optimisation
algorithms
Renewable energy
An optimisation study is conducted to find the optimum design of switching converters so as to be integrated with related renewable technologies. Multi-objective optimisation is performed with associated conflicting objectives for instance efficiency and reliability, and finally, the optimum solution is obtained among ideal options from the Pareto optimal ones
Adinolfi et al.(2015) Includes economic aspects such as price minimisation and cost saving
Genetic algorithm NSGA II
Photovoltaic systems
A study on photovoltaic systems and electro-thermal methods was conducted. In the study, a multi-objective optimisation was suggested and applied to two conflicting objectives; the maximisation of the efficiency of the solutions from Europe and their cost minimisation
Graditi et al.(2014) Includes cost and reliability performances
Commercial Power optimiser
Photovoltaic systems
In this study, a number of scenarios are investigated using
multi-objective optimisation techniques that are applied to an electrical energy storage system investigating the connection with renewable sources
Ippolito et al.(2014) Includes the minimization of the total electricity generation cost
Genetic algorithm NSGA II
Electrical Energy Storage system for RE systems
Yeh and Chuang are using multiple and conflicting objectives and combine them with genetic algorithms so as to find the Pareto optimal solution in a green supply chain case. In the study, four conflicting objectives and related green criteria were carefully selected such as the total cost, time etc.
Yeh and Chuang(2011) Includes the minimization of the total cost and it consists of the product cost and transportation cost
Hybrid combination of two genetic algorithms
Green supply chain problem that also considers renewables
A methodology was created using multi-objective optimisation to maximise the energy harvested from a photovoltaic module and at the same time minimise the mass of the module-integrated converter
Mirjafari and Balog(2012) Includes cost and efficiency objective functions
Particle Swarm Optimization (PSO)
Photovoltaic systems
The total system cost and the probability of deficiency of power supply of Hybrid Electric Systems (HRESs) are optimised using NSGA II. The HRES includes a wind turbine, a photovoltaic panel and a battery. NSGA II drives the optimisation search, but it is led by a Chance-Constrained-Programming-based method to consider RE sources uncertainty
Kamjoo et al.(2016) Includes the total cost of the system
Genetic algorithm NSGA II
Hybrid Renewable Energy System
Table 1 continued
Description Refs. Economic modelling Optimisation
algorithms
Renewable energy
A power planning study using mixed integer non-linear multi-objective evolutionary optimisation was conducted. It presents a framework that determines the number of new generating units, the power generation capacity of them and other important aspects of a single-period generation expansion plan. The methodology is applicable to wind farms, geothermal and hydro units among others
Meza et al.(2009) Includes Economic evaluation and risks minimising the investment and operation costs
Evolutionary programming algorithm (MEPA) based on a
multi-objective genetic algorithm (MOGA)
Considers renewable generating units among others such wind farms, and geothermal and hydro units
Other references
Branke et al.(2008),Deb(2001),Karimi et al.(2017),Perkgoz et al.(2005), Sakawa et al.(2004,2013) andStewart(2008)
Fig. 2 NSGA II, III and SPEA (Hadka 2015) demonstrating the distribution of solutions when applied to a benchmark function with three objectives
It is suggested byChiang(2014),Deb and Jain(2014) and Jain and Deb(2014) to use 12 divisions, where the domain of each of the many objectives is separated into regions using reference points to define normalised hyperplanes, for greater effectiveness in the discovery process.
Both optimisers are considered as the state-of-the-art multi-objective algorithms, and they are selected for this study. In general, the optimisation problem can be solved through genetic algorithms, Tabu Search, Simulated Anneal-ing, and other Heuristic methods (Momoh and Reddy 2014). A few methods that can also be applied to this study are the following: multi-objective evolutionary algorithm based on decomposition (MOEA/D), covariance matrix adapta-tion evoluadapta-tion strategy (CMAES), the third evoluadapta-tion step of generalized differential evolution (GDE3), indicator-based evolutionary algorithm (IBEA), optimized multi-objective particle swarm optimiser (OMOPSO), speed-constrained multi-objective PSO (SMPSO), etc. (Hadka 2015). However, the SPEA2 algorithm has not been considered yet for that type of applications.
Evolution and genetic algorithms are used throughout the literature in many energy-related sectors. Karimi presented
an approach that links a multi-objective genetic algorithm to the design of a floating wind turbine. By varying nine design variables related to the structural characteristics of the sup-port structure, multiple concepts of supsup-port structures were modelled and linked to the optimiser. The aim is to minimise the economic costs (as a combination of the mooring system, the anchor, and the offshore floating platform) and maximise the turbine performance (standard deviation of nacelle accel-eration. The Pareto Front contained a wide number of results that reflect solutions of either the single-body platforms or tension-leg platforms or multi-body platforms. In the future steps, it was suggested to optimise the levelised cost of energy and to consider a different parameterisation scheme both of which could extend to the present research (Karimi et al. 2017).
[image:5.595.51.548.68.429.2](expressed in a benefit for investment), and orography. The optimisation algorithm is based on evolutionary algorithms and is seeded by a greedy approach, where experimental com-parisons have been demonstrated.
Five different types of optimisation algorithms were used inElkinton et al.(2008) to optimise the layout of a wind farm. As it was also mentioned inCagan et al.(2002), solutions of higher quality can be discovered using algorithms with stochastic elements. However, these operate at a much slower speed, than the deterministic counterparts. In fact, inElkinton et al.(2008), combining genetic algorithms with heuristics was more effective and faster than using only one of them. In this particular instance, it was suggested to use layout optimisation in small areas, or, at least, focus in good areas before launching a bigger optimisation case.
Another approach, presented inWan et al.(2012), was used to optimise the layout of a wind farm (micro-siting opti-misation: choosing the type and location of wind turbines) by considering continuous space and using particle swarm optimisation techniques. A special local search scheme was also introduced in the optimisation algorithm, to success-fully speed up the process, where realistic solutions were discovered that delivered more electricity. InPapatheou et al. (2015), an evolutionary optimisation algorithm is used in the area of supervisory control and data acquisition or SCADA in a Swedish offshore wind location called Lillgrund for monitoring purposes to optimise and predict the energy pro-duction from every wind turbine in a wind farm considering related data from other wind turbines. Finally, inGonzález et al.(2010), evolutionary algorithms are applied in a wind farm-related optimisation problem. The configuration of the layout of the turbines is optimised based on a cost model. The problem is very complex, since the optimum layout has been troubling many specialists for years. The suitability of the suggested evolutionary techniques is proven in the study.
2.2 Life cycle cost modelling
Life cycle cost was established by the Federal Energy Man-agement Program to evaluate economically energy, water conservation, and RE projects for federal facilities. A guide was created in a handbook inFuller and Petersen (1996), where the methodology and criteria were evaluated and presented. LCC analysis can evaluate and suggest cost reduc-tions throughout a project’s life. The outcome of the analysis can provide useful information in an investment and can direct decision making from the initial stages of a new project.
Calculating the LCC of an offshore wind project involves five stages from the predevelopment to the decommission-ing phase, and there is not a common universal reference
point for wind projects. InShafiee et al.(2015), a paramet-ric whole life cost framework for an offshore wind farm and a cost breakdown structure is presented and analysed. LCC analysis is essential for the insurers, wind farm operators, and investors to ensure a cost-efficient long and profitable investment plan to produce power.
LCC analysis gains more ground over the years because of the larger scale in wind projects. For example,Nordahl (2011) studied the advantages and disadvantages of the tran-sition to offshore wind and proposed an LCC model of an offshore wind development. However, the study mainly cen-tres in a simplified model and especially the operation and maintenance stage of the LCC analysis and it is suggested that there can be a further full-scale LCC framework in the future.
A study that states legal, financial, etc. related problems of wind turbines that are positioned both onshore and offshore is described inAngelakoglou et al.(2014) and involves an assessment using the LCC analysis methodology to select the best option, environmentally, energywise, and economically. Martínez et al.(2009) offer further insight in LCC analysis for a wind turbine throughout its whole life beginning from the manufacturing and installation to the decommissioning. This aims to quantify the impact of each stage along with important aspects such as manufacturing, transportation to site, and material waste.
The importance of the LCC analysis and an economic life cost-related model in three different offshore floating wind devices was presented in Laura and Vicente (2014). This study aims to develop a framework and minimise some of the most important costs in a floating type of turbine making the floating devices a more attractive investment. In the same direction,Myhr et al.(2014) also studies five different types of floating wind turbine concepts in one offshore location and compares them using LCC-related features. The water depth was found to have the most significant impact on the total cost.
According toShafiee et al.(2015), LCC analysis includes costs calculated from several stages of the wind project such as the predevelopment and consenting (CP&C), produc-tion and acquisiproduc-tion (CP&A), installation and commissioning
(CI&C), operation and maintenance (CO&M), and
2.3 Selecting an offshore location
To the author’s knowledge, there are no studies that com-bine the concept of LCC with optimisation techniques with a focus on the individual LCC costs, to find the optimum offshore location for wind farm projects. Moreover, there are no studies that consider objectives based on economic fig-ures and select the optimum Round 3 offshore location in the UK. In fact, for the selection of the location, there is very limited work accessible and with a small amount of focused and related criteria on this topic.
In the literature, many RE and location selection studies can be found, but the findings and the formulation of the problems provided follow a different direction. For example, using goal programming, the offshore location for a wind farm installation was selected inJones and Wall(2015). The study involves Round 3 locations in the UK, while shows its flexibility to combine decision-making methods. This work shows the energy production, costs, and multi-criteria nature of the problem also considering some important factors related to environmental, social, technical, and eco-nomic aspects. The LCC analysis and their formulation into an MOO problem were not employed in the application. According toJones and Wall(2015), multi-objective mod-elling techniques for both onshore and offshore wind farm are quite underdeveloped. The present study focuses on a methodology to fill this gap by linking MOO with LCC as objective functions and compares optimisation algorithms to select the optimum solution.
Another study on offshore locations is provided in Crad-den et al.(2016) for an RE platform using multiple criteria and geographical information systems (GIS). A range of problems that exist around offshore RE platforms have been reviewed and a combination of criteria has been selected for the Atlantic facing shores in Europe. The potential risks were studied and it was found that the extreme weather conditions show the necessity of a compromise between the designing costs and the extra energy production. Very important factors were also the lack of ports with suitable available construc-tion infrastructure that results in under-exploited sites, access problems, and weather window conditions, even during the summer months (Cradden et al. 2016). Although the study is very thorough, it is mostly focused on environmental, geo-graphical, and weather issues that are out of scope because of the economic nature of the objectives and related criteria.
3 A framework for the optimisation of deployment
sites for Round 3 wind farms in the UK
InEspinosa(2014) andShafiee et al.(2015), a whole LCC formulation is provided and this study follows the steps and phases of the analysis for the optimisation problem.
Assump-tions and useful data in the modelling of the problem can be found in references 4COffshore (2017c),Dicorato et al. (2011),Espinosa(2014),Laura and Vicente(2014),Shafiee et al.(2015),The Crown Estate(2017) andWind Energy The Facts(2017). Based on the previous work, a new model was developed so as to be coupled with the optimisation algo-rithms and drive the optimisation search.
The framework described in this section assesses the effectiveness of a suggested methodology to discover the optimum Round 3 offshore locations in the UK and improve the decision-making processes. Conceptually, the frame-work comprises of a model and an optimisation algorithm. The flow chart in Fig. 1 shows the optimisation model that includes seven objectives, four LCC-related objectives, described inShafiee et al.(2015), and three additional objec-tives. Optimising seven objective functions at the same time, which are conflicting (from the mathematical formulation below), classifies the problem as multi-objective and it is considered rather complicated because of the interplay of the objectives and the nature of the variables.
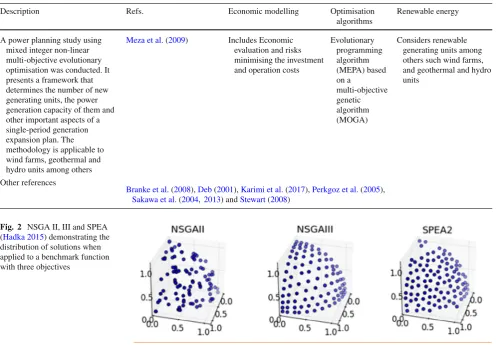
The LCC model described inShafiee et al.(2015) is used in this study and provided below in detail.
The LCC is calculated as follows:
LCC=CP&C+CP&A+CI&C+CO&M+CD&D
LCC: Life cycle cost
CP&C: Predevelopment and consenting cost
CP&A: Production and acquisition cost
CI&C: Installation and commissioning
CO&M: Operation and maintenance cost
CD&D: Decommissioning and disposal
CP&C=CprojM+Clegal+Csurveys+Ceng+Ccontingency
CprojM: Project management cost
Clegal: Legal cost Csurveys: Survey cost
Ceng: Engineering activities cost
Ccontingency: Contingency cost
CP&A=CWT+CSS+CPTS+Cmonitoring
CWT: Wind turbine procurement cost CSS: Support structure/foundation cost CPTS: Electricity transmission cost
Cmonitoring: Monitoring cost
CI&C=CI&C-port+CI&C-comp+Ccomm+CI&C-ins
Fig. 3 Life cycle cost (LCC) break down (Shafiee et al. 2015)
CI&C-comp: Installation of the components cost
Ccomm: Commissioning of the wind turbines and electrical system cost
CI&C-ins: Construction insurance cost
CO&M=CO+CM
CO: Operational cost CM: Maintenance cost
CD&D=Cdecom+CWM+CSC+CpostM
Cdecom: Decommissioning cost
CWM: Waste management cost CSC: Site clearing cost
CpostM: Post-monitoring cost
CAPEX=CP&C+CP&A+CI&C
OPEX=CO&M
CAPEX: Capital expenditures OPEX: Operating expenses
More can be found inShafiee et al.(2015).
The present study only considers the first four life cycle costs (depicted in Fig. 3) in the proposed methodology, because the aim is to understand the interplay between the CAPEX and OPEX costs to improve the decision-making process. Both these costs are considered to drive investment decisions, so as to prevent potential risks and issues when beginning a wind project by the developers.
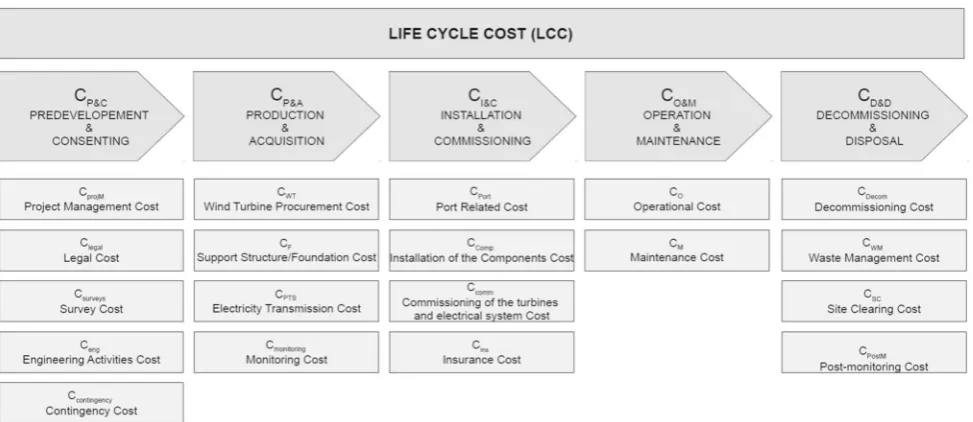
As it is depicted in Fig.1, the first four objectives are the costs from the LCC analysis. More specifically, the present model includes the predevelopment and consenting, produc-tion and acquisiproduc-tion, installaproduc-tion and commissioning, and finally operation and maintenance costs. The decommission-ing and disposal cost is not considered at this stage. All of the cost-related objectives are minimised, as shown in Fig.1. The mapping between the variables and the objectives that are estimated using the LCC analysis is depicted in Fig.4. In this representation, the number of turbines, the distance from the ports, the water depth, and the power rate, which is determined by the wind turbine size shown in the speci-fications in Table3, are the decision variables, as shown in Fig.1.
The last three objectives are the number of turbines (NWT), the power that is extracted (P) from each offshore site and the total installed capacity (TIC), which are min-imised, maxmin-imised, and maxmin-imised, respectively. The power extracted is calculated by the specific mean annual wind speed of each location along with the characteristics of each wind turbine both of which are considered inputs (listed in Table2). The TIC is calculated by the number of turbines and the rated power of each of them.
The power extracted in this optimisation model is max-imised and it is calculated for each site and each wind turbine, respectively, from
P= 1 2ACpρu
3
A: Area of the wind turbine ρ: Air density
[image:8.595.56.543.54.265.2]Fig. 4 Mapping the decision variables in LCC model
u: Mean annual wind speed of each specific site
The last objective of the model is the total installed capac-ity (TIC) of the wind farm is calculated for every solution and it is maximised:
TIC=PR×NWT
PR: Rated power
NWT: Number of turbines
For the selection of the optimum offshore wind farm loca-tion, physical aspects of each localoca-tion, i.e., wind speed, water depth, and distance from designated construction ports, are considered. A list of ports was acquired from Depart-ment of Energy and Climate Change(2009),Marine Traffic
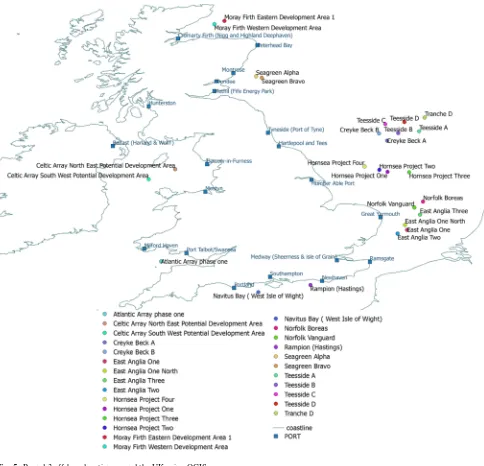
Marine traffic(2017) andUK Ports Directory(2017). The list contains designated, appropriate, and sufficient construction ports that are suitable for the installation, manufacturing, and maintenance works for wind farms. New ports are agreed to be built for the conveniences of new wind farms. This study will consider only the parts and sites depicted in Fig.5
[image:9.595.60.540.54.498.2]Fig. 5 Round 3 offshore location around the UK using QGIS
coordinated, the distances to the shore and port, annual wind speed, and average site water depth.
Table2shows among various data, the locations that each of these zones contains. Each location correlates with their specific data used in this problem.
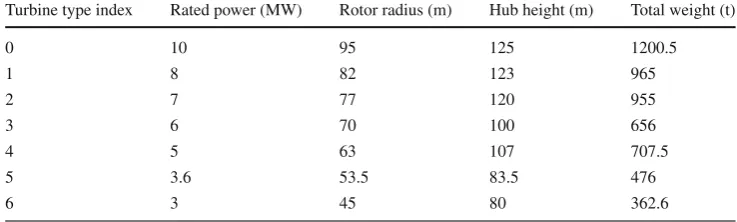
Table3lists the specifications of the turbines that are con-sidered in this study. These were extracted from reference turbines in 4COffshore (2017d).
The optimisation problem formulates as follows:
Minimise CP&C,CP&A,CI&C,CO&M,NWT, (−P), (−TIC)
Subject to 0≤site index≤25,
0≤turbine type index≤6
50≤number of turbines≤450,
where the objectives are described above.
The site index and turbine-type index are specified in Tables2and3, respectively. In the formulation, minimising the negative TIC and P is equivalent to their maximi-sation. The number of turbines was deliberately selected both as variable and as objective so as to minimise the CAPEX.
[image:11.595.55.539.54.520.2]Table 3 Turbine specifications
Turbine type index Rated power (MW) Rotor radius (m) Hub height (m) Total weight (t)
0 10 95 125 1200.5
1 8 82 123 965
2 7 77 120 955
3 6 70 100 656
4 5 63 107 707.5
5 3.6 53.5 83.5 476
6 3 45 80 362.6
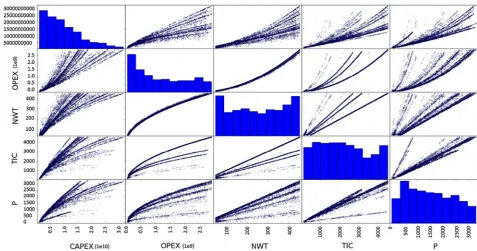
Fig. 6 Scatter plot matrix among the seven objectives, i.e.,CA&P,CP&C,CI&C,CO&M, NWT, P, and TIC using NSGAII
In this study, a comparison among the pareto front solu-tions from each optimiser is conducted, where each optimiser delivered a non-dominated trade-off with the best possible solutions for offshore wind farm locations.
4 Results
The pareto front solutions from every algorithm and their trade-offs are presented. Although the variables are discrete in nature, the revealed trade-offs appear to be continuous. Each pareto front solution consists of the wind farm location, number of turbines (NWT), type of turbine, power extracted (P) for the specific site, total installed capacity (TIC) (i.e., the total capacity of the wind farm), and the life cycle costs (i.e.,CP&A,CP&C,CI&C, andCO&M).
A scatter plot matrix was considered as the best option to visualise a seven-dimensional problem and it is depicted
from Figs.6,7,8,9,10, and11. In Figs.6,8, and10, seven objectives, i.e.,CP&A,CP&C,CI&C,CO&M, NWT, P, and TIC, are illustrated, and in Figs.7,9, and11, the CAPEX, OPEX, NWT, P, and TIC are also provided. This is part of the Pareto Front, as it was discovered by the optimisers. In the main diagonal of the figure, the histograms represent the concen-tration of points in ten buckets of equal size. All the trade-offs are continuous, which means that there is not any (discontin-uous) gap in performance.
4.1 NSGA II
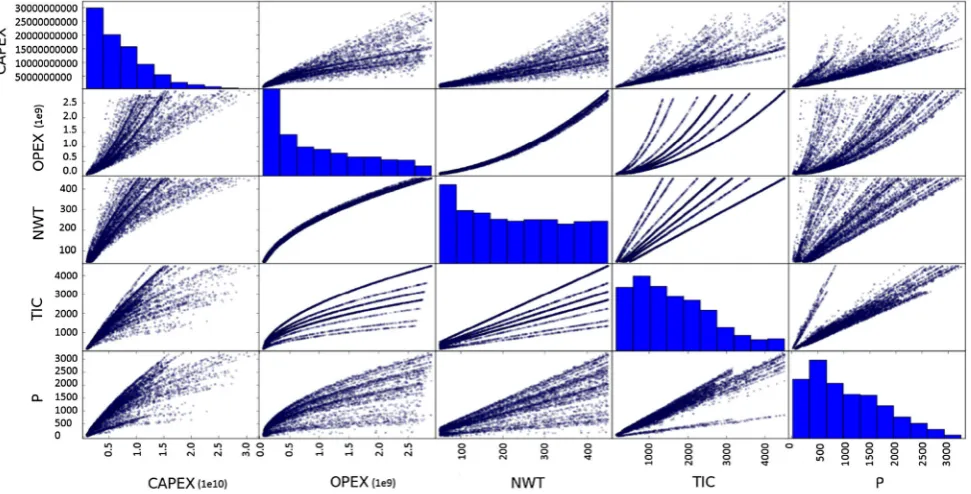
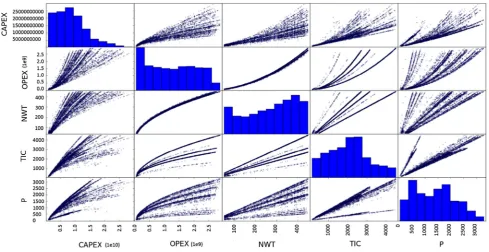
[image:12.595.55.544.200.454.2]Fig. 7 Scatter plot matrix among CAPEX, OPEX, NWT, P, and TIC using NSGAII
focused on the upper bound, whereas below that, the number of points explored is scarce. This practically means that the optimiser quickly identified chromosomes with good perfor-mance and used the computational budget towards exploring along this direction. This pattern applies to most of the plots. Plots whose performance has a pattern similar to ‘CO&M
ver-susCI&C’ also demonstrate that certain performance routes
were discovered and followed throughout the optimisation search. This explains the solid legs within the swarm of solu-tions. The bottom area of ‘P versusCP&A’ illustrates that a few areas of dominated performance (sporadic solutions) were discovered, but were not further investigated. Finally, ‘CP&CversusCP&A’, ‘TIC versusCI&C‘, and ‘CO&Mversus NWT’ vary in harmony.
By interactively investigating the results, the following behaviour was identified. Each of the legs of the plot ‘TIC versusCO&M’ is linked to a particular wind turbine. Then, by varying the combination of the number of turbines and the site, a wide range of values of the cost element can be obtained. This is more obvious in the PFs discovered by NSGAIII because of the continuous points discovered for the same type of plot, whereas this would be very hard to spot in the results from NSGAII. This feature could be integrated into a process to detect any hidden performance relationships.
4.2 NSGA III
Compared to NSGAII, NSGAIII was also found to behave better when the number of objectives increases (relative to the other two optimisers), as expected by definition. Hence,
the final results appear more uniform, as shown in Figs.8and 9. Consequently, the trade-offs for certain pairs of objectives are much more complete (in terms of the distance between any two points) and richer (in terms of a number of points within a relatively narrow area). It seems that the chromo-somes covered a wider spectrum of solutions. In NSGA III, the ‘NWT versusCO&M’ present the most straightforward relationship as they are approaching an exponential trend. As before, the same three combinations clearly vary in harmony. In general, this demonstrates the suitability of NSGAIII in such problems (and will be considered as the main optimiser in the next stages of the research).
4.3 SPEA2
The performance of SPEA2 is depicted in Figs.10and11. Fundamentally, the same characteristics can be observed. However, SPEA2 stands between NSGAII and NSGAIII, in terms of trade-off findings. It discovered more diverse solu-tions than NSGAII but less diverse than NSGAIII.
5 Discussion
Optimum locations for a wind farm have been discovered using three different MOO algorithms, NSGA II, NSGA III, and SPEA 2 and using the LCC analysis, to achieve cost-efficient solutions. The results follow a consistent trend and they seem to be in relative agreement. TIC,CP&A,CI&C, and
[image:13.595.61.539.53.304.2]Fig. 8 Scatter plot matrix among the seven objectives, i.e.,CA&P,CP&C,CI&C,CO&M, NWT, P, and TIC using NSGAIII
Fig. 9 Scatter plot matrix among CAPEX, OPEX, NWT, P, and TIC using NSGAIII suggests to be compound into a single objective in the future,
for simplicity. In addition,CO&Mand NWT also vary in har-mony by following a parabolic trend. In the same figures, most of the discovered solutions live at the lower end of the range ofCP&A andCP&C. This points out future research directions, so as to identify areas, where the performance remains constant.
[image:14.595.54.544.51.306.2] [image:14.595.57.543.345.592.2]Fig. 10 Scatter plot matrix among the seven objectives, i.e.,CA&P,CP&C,CI&C,CO&M, NWT, P, and TIC using SPEA2
Fig. 11 Scatter plot matrix among CAPEX, OPEX, NWT, P, and TIC using SPEA2
it is sensible to consider the CAPEX objective in the future steps of the research (instead of all these three individual objectives).
In SPEA2 and NSGAII results, the sparse dots at the end of each graph represent that the method (i.e., the search patterns employed by those algorithms) has not discovered a wide range of solutions in those areas.
[image:15.595.53.543.336.588.2]Fig. 12 % of frequency of each site from the pareto front solutions from SPEA2, NSGAII, and NSGAIII
(Celtic Array). A frequency graph has been created in Fig. 12to summarise and depict the % frequency of each offshore location that appears in the pareto front solutions. In general, the Firth of Forth, Dogger Bank, and Irish Sea (Celtic Array) zones reached the highest score for all optimisers.
The Teesside C scored first and it is closely followed by Seagreen Bravo when using NSGAII. The Seagreen Alpha in Firth of Forth seems to have the highest scores of all when using the SPEA2 algorithm, and thus, it is considered one of the best options for a wind farm project, as it was identified by all three optimisers. Finally, Seagreen Alpha was scored first for the NSGAIII. In general, the Hornsea Projects family has been found to be suitable in only a small amount of appearances in the pareto front.
The performance of the algorithms has shown that NSGAIII demonstrated its suitability in multi-objective
problems as its results appear to be more uniform and clear because of its main design, compared to the other optimis-ers. Therefore, the trade-offs for certain pairs of objectives are more complete, wider, and richer, in terms of a number of points. In general, the patterns of the revealed trade-off are very clear and distinct for the results from NSGAIII with 12 divisions.
Fig. 13 Comparison of CAPEX versus OPEX using NSGAII, NSGAIII, and SPEA2
Table 4 Selected solution based on high frequency (from Fig. 12) for each algorithm
Algorithm Site name Turbine type (MW) NWT TIC (MW) P(MW)
SPEA 2 Seagreen Alpha 10 148 1480 718.04
Seagreen Bravo 6 308 1848 157.70
Rampion (Hastings) 6 185 1110 475.86
NSGA II Teesside C 10 402 4020 2846.06
Seagreen Alpha 3 449 1347 685.93
Seagreen Bravo 6 117 702 536.49
NSGA III Rampion (Hastings) 8 261 2088 360.56
Seagreen Alpha 10 293 2930 1994.90
Seagreen Bravo 7 50 350 290.17
budget in different development phases, as required. More specifically, the Seagreen Alpha provides many more opti-mum options that are equally efficient (involving the number and type of turbines in each solution) than the Moray Firth Western Development Area, which gives the flexibility to invest more money in the installation or the maintenance stage of the project.
An application has been submitted and consented for the Firth of Forth Seagreen Alpha and Bravo, which are at the first phase of the Round 3 Firth of Forth development according to 4COffshore (2017f), RYA (2017). Both Seagreen Alpha and Bravo faced some engineering and environmental prob-lems and developed the project accordingly to accommodate such constraints that appeared in their offshore locations (4COffshore2017f). Teesside C and D in Dogger Bank appli-cations were submitted together by Forewind. Unfortunately, the projects have been cancelled according to 4COffshore (2017a,2017b). Rampion (Hastings) is currently under con-struction according to 4COffshore (2017e). Finally, Celtic
Array South West Potential development Area was also can-celled (4COffshore2014).
Probably, the six primary selected offshore locations have been either cancelled, consented or just submitted and only one of them is under construction, because other factors are also involved in the selection process. For example, the can-cellation in all cases happened, because the Crown Estate asked the developers to revise all the terms of their agree-ment, while the project transitioned toward the development phase (4COffshore2017e). Other reasons could also result in cancellation such as environmental problems, legal and procurement restrictions, etc.
[image:17.595.176.545.311.449.2]for both industrial and educational purposes in the wind sec-tor for future investments.
In Fig.13, the performance of each optimisation algorithm in CAPEX versus OPEX is shown. As expected, most of the solutions gather at the lower left end. NSGAII and SPEA2 discovered and followed certain trends for a particular wind turbine, as shown by the various legs in the figure. Because of the design of NSGAIII, the discovered solutions are more spread throughout the objective space.
Table4shows the top three locations discovered by each optimiser in terms of frequency in the Pareto Front from Fig.12. The listed solutions were selected manually so as to demonstrate the conflicting nature of the objectives. The table numerically demonstrates the conflict among the objec-tives in the trade-off, for instance, comparing Seagreen Alpha and Seagreen Bravo using SPEA 2 algorithm, when the NWT increases then P decreases. In the results of the same algorithm, including Rampion (Hastings), when the NWT increases, TIC reduces (whereas previously, it increased). This demonstrates the conflicting nature of the results and non-linear relationships, which will be further investigated in the future.
From the obtained results, the average savings were cal-culated to assess the performance of the approach and the framework. An average savings formula was used (i.e., Average savings= Maximum costMaximum cost−Average cost)to calculate per-centages for CAPEX and OPEX using NSGA II, NSGA III, and SPEA 2. NSGA II reached 77 and 66.7% savings for CAPEX and OPEX, respectively. NSGA III found 69.1 and 59.2% for CAPEX and OPEX, respectively. Finally, SPEA 2 shows 70.1 and 55.8% savings for CAPEX and OPEX, respectively. It appears that the optimisation approach can discover solutions with lower CAPEX deviation than OPEX. The high percentages were expected because of the large number of conflicting objectives which forces the optimisers to discover a great number of solutions in the Pareto Front.
6 Conclusions
This study successfully demonstrated by example the effec-tiveness of the newly developed optimisation process and delivered satisfactory outcomes for the most suitable and cost-efficient offshore wind farm Round 3 locations. A com-parison has been presented among the three state-of-the-art algorithms (i.e., NSGA II, NSGA III, and SPEA 2), which were applied to a wind energy real-world case. The com-parison and the useful outcomes on their performance have been illustrated and discussed. The optimum locations for a wind farm have been suggested by considering the signifi-cant input of the LCC analysis. Six sites were suggested (with the frequency of appearance higher than 10% in the parent front).
The results follow a relatively similar and consistent trend. The performance of the algorithms has shown that the NSGAIII demonstrated its suitability in multi-objective problems as its results appear to be more uniform and clear because of its design compared to the other optimisers.
The limitations of this work are related to the LCC calcu-lations and the associated assumptions that had to be made in the development of the model. To get more accurate results, more precise data are required to validate and calibrate the LCC, which could refine the results of this work. Many data and assumptions taken for this study have been obtained and chosen from wind-related databases and crown estate reports, to reach the real-world values. However, research and surveys are important for every individual site to have more accurate inputs. Data acquisition is the hardest part as it is impossible for a developer to proceed without a project plan. Here, only one type of foundation was considered, the jacket structure. The impact of Net Present Value on the economic objectives (i.e., CAPEX and OPEX) has not been considered and will be further investigated in the future.
The revealed outcomes will have an important impact on a possible extension of the Round 3 zones in the future of the UK and will help decision makers for their next cost effi-cient investment move. The proposed framework could also be applied to other sectors to increase investment confidence and provide optimum solutions. For example, the installation of floating offshore wind and wave devices could be bene-fited by the framework, where the optimum locations can be suggested according to cost and operational aspects for each technological need.
Acknowledgements This work was supported by Grant EP/L016303/1 for Cranfield University, Centre for Doctoral Training in Renewable Energy Marine Structures (REMS) (http://www.rems-cdt.ac.uk/) from the UK Engineering and Physical Sciences Research Council (EPSRC).
Open Access This article is distributed under the terms of the Creative Commons Attribution 4.0 International License (http://creativecomm ons.org/licenses/by/4.0/), which permits unrestricted use, distribution, and reproduction in any medium, provided you give appropriate credit to the original author(s) and the source, provide a link to the Creative Commons license, and indicate if changes were made.
References
4COffshore Celtic Array South West Potential Development Area Off-shore Wind Farm (2014)http://www.4coffshore.com/windfarms/ celtic-array-south-west-potential-development-area-united-king dom-uk1r.html
4COffshore Dogger Bank—Teesside C Offshore Wind Farm (2017a) http://www.4coffshore.com/windfarms/dogger-bank-teesside-c-united-kingdom-uk1h.html. Accessed 2017
4COffshore Global offshore wind farms database (2017c)http://www. 4coffshore.com/offshorewind/index.html?lat=50.668&lon=-0. 275&wfid=UK36. Accessed 2017
4COffshore Offshore Turbine Database (2017d) http://www. 4coffshore.com/windfarms/turbines.aspx. Accessed 2017 4COffshore Rampion Offshore Wind Farm (2017e) http://www.
4coffshore.com/windfarms/rampion-united-kingdom-uk36.html. Accessed 2017
4COffshore Seagreen Bravo Offshore Wind Farm (2017f)http://www. 4coffshore.com/windfarms/seagreen-bravo-united-kingdom-uk 1a.html. Accessed 2017
Adinolfi G, Graditi G, Siano P, Piccolo A (2015) Multiobjective opti-mal design of photovoltaic synchronous boost converters assessing efficiency, reliability, and cost savings. IEEE Trans Ind Inform 11:1038–1048. doi:10.1109/TII.2015.2462805
Angelakoglou K, Botsaris PN, Gaidajis G (2014) Issues regarding wind turbines positioning: a benchmark study with the application of the life cycle assessment approach. Sustain Energy Technol Assess 5:7–18
BEC CREW (2015) Here’s what you need to know about the new Paris climate deal. http://www.sciencealert.com/here-s-what-you-need-to-know-about-the-climate-deal-from-paris. Accessed 2017
Branke J, Deb K, Miettinen K, Slowi´nski R (2008) Multiobjective optimization: interactive and evolutionary approaches. Springer, Berlin, Heidelberg
Brownlee J (2011) Clever algorithms nature-inspired programming recipes. lulu.comhttp://dl.acm.org/citation.cfm?id=1983645 Cagan J, Shimada K, Yin S (2002) A survey of computational
approaches to three-dimensional layout problems. Comput Aided Des 34:597–611. doi:10.1016/S0010-4485(01)00109-9 Chiang T-C (2014) nsga3cpp: a C++ implementation of NSGA-III.
http://web.ntnu.edu.tw/~tcchiang/publications/nsga3cpp/nsga3cp p-installation.htm. Accessed 2017
Cradden L, Kalogeri C, Barrios IM, Galanis G, Ingram D, Kal-los G (2016) Multi-criteria site selection for offshore renewable energy platforms. Renew Energy 87(Part 1):791–806. doi:10. 1016/j.renene.2015.10.035
Deb K (2001) Multi-objective optimization using evolutionary algo-rithms. Wiley, New York, US
Deb K, Agrawal RB (1994) Simulated binary crossover for continuous search space. Complex Syst 9:1–15
Deb K, Jain H (2014) An evolutionary many-objective optimiza-tion algorithm using reference-point-based nondominated sorting approach, part I: Solving problems with box constraints. IEEE Trans Evol Comput 18:577–601
Department of Energy and Climate Change (2009) UK ports for the offshore wind industry: time to act.http://webarchive.natio nalarchives.gov.uk/+/http:/www.berr.gov.uk/files/file49871.pdf. Accessed 2017
Department of Energy and Climate Change (2011) UK renew-able energy roadmap. https://www.gov.uk/government/uploads/ system/uploads/attachment_data/file/48128/2167-uk-renewable-energy-roadmap.pdf. Accessed 2017
Dicorato M, Forte G, Pisani M, Trovato M (2011) Guidelines for assess-ment of investassess-ment cost for offshore wind generation. Renew Energy 36:2043–2051. doi:10.1016/j.renene.2011.01.003 Elkinton CN, Manwell JF, McGowan JG (2008) Algorithms for offshore
wind farm layout optimization. Wind Eng 32:67–84
Espinosa IA (2014) Life cycle costing of offshore wind turbines. MSc Thesis. Cranfield University, Cranfield, UK
European Observation Network for Territorial Development and Cohesion (2011) Inspire policy making by territorial evidence. http://www.espon.eu/main/Menu_Publications/Menu_MapsOf TheMonth/map1101.html. Accessed 2017
Fuller SK, Petersen SR (1996) Life-cycle costing manual for the federal energy management program, 1995 Edition. NIST handbook 135 González JS, Gonzalez Rodriguez AG, Mora JC, Santos JR, Payan MB (2010) Optimization of wind farm turbines layout using an evolutive algorithm. Renew Energy 35:1671–1681. doi:10.1016/ j.renene.2010.01.010
Graditi G, Adinolfi G, Tina GM (2014) Photovoltaic optimizer boost converters: temperature influence and electro-thermal design. Appl Energy 115:140–150. doi:10.1016/j.apenergy.2013.10.031 Hadka D (2015) Platypus. http://platypus.readthedocs.io/en/latest/
experimenter.html#comparing-algorithms-visually. Accessed 2017
HM Government (2013) Offshore wind industrial strategy business and government action.https://www.gov.uk/government/uploads/ system/uploads/attachment_data/file/243987/bis-13-1092-offsho re-windindustrial-strategy.pdf. Accessed 19 July 2017
Ippolito MG, Di Silvestre ML, Riva Sanseverino E, Zizzo G, Gra-diti G (2014) Multi-objective optimized management of electrical energy storage systems in an islanded network with renewable energy sources under different design scenarios. Energy 64:648– 662. doi:10.1016/j.energy.2013.11.065
Jain H, Deb K (2014) An evolutionary many-objective optimiza-tion algorithm using reference-point based nondominated sorting approach, part II: handling constraints and extending to an adaptive approach. IEEE Trans Evol Comput 18:602–622
Jones DF, Wall G (2015) An extended goal programming model for site selection in the offshore wind farm sector. Ann Oper Res. doi:10. 1007/s10479-015-1828-2
Kamjoo A, Maheri A, Dizqah AM, Putrus GA (2016) Multi-objective design under uncertainties of hybrid renewable energy system using NSGA-II and chance constrained programming. Int J Electr Power Energy Syst 74:187–194. doi:10.1016/j.ijepes.2015.07.007 Karimi M, Hall M, Buckham B, Crawford C (2017) A multi-objective design optimization approach for floating offshore wind turbine support structures. J Ocean Eng Mar Energy 3:69–87. doi:10.1007/ s40722-016-0072-4
Kolios A, Collu M, Chahardehi A, Brennan F, Patel M (2010) A multi-criteria decision making method to compare support structures for offshore wind turbines. In: European Wind Energy Conference, Warsaw
Kolios A, Mytilinou V, Lozano-Minguez E, Salonitis K (2016) A com-parative study of multiple-criteria decision-making methods under stochastic inputs. Energies. doi:10.3390/en9070566
Kolios AJ, Rodriguez-Tsouroukdissian A, Salonitis K (2014) Multi-criteria decision analysis of offshore wind turbines support struc-tures under stochastic inputs. Ships Offshore Struct 11(1):38–49 Laura C-S, Vicente D-C (2014) Life-cycle cost analysis of floating
off-shore wind farms. Renew Energy 66:41–48. doi:10.1016/j.renene. 2013.12.002
Lin S-Y, Chen J-F (2013) Distributed optimal power flow for smart grid transmission system with renewable energy sources. Energy 56:184–192. doi:10.1016/j.energy.2013.04.011
Lozano-Minguez E, Kolios AJ, Brennan FP (2011) Multi-criteria assessment of offshore wind turbine support structures. Renew Energy 36:2831–2837. doi:10.1016/j.renene.2011.04.020 Marine Traffic Marine traffic.http://www.marinetraffic.com. Accessed
2017
Martin H, Spano G, Küster JF, Collu M, Kolios AJ (2013) Application and extension of the TOPSIS method for the assessment of float-ing offshore wind turbine spport structures. Ships Offshore Struct 8:477–487. doi:10.1080/17445302.2012.718957
Meza JLC, Yildirim MB, Masud AS (2009) A multiobjective evo-lutionary programming algorithm and its applications to power generation expansion planning. IEEE Trans Syst Man Cybern Part A Syst Hum 39(5):1086–1096
Mirjafari M, Balog RS (2012) Multi-objective optimization of the energy capture and boost inductor mass in a module-integrated converter (MIC) photovoltaic energy system. In: Applied power electronics conference and exposition (APEC), 2012 twenty-seventh annual IEEE, Orlando, US, pp 2002–2007. doi:10.1109/ APEC.2012.6166097
Momoh JA, Reddy SS (2014) Review of optimization techniques for renewable energy resources. In: IEEE symposium on power elec-tronics and machines for wind and water applications, pp 1–8. doi:10.1109/PEMWA.2014.6912225
Myhr A, Bjerkseter C, Ågotnes A, Nygaard TA (2014) Levelised cost of energy for offshore floating wind turbines in a life cycle per-spective. Renew Energy 66:714–728. doi:10.1016/j.renene.2014. 01.017
Mytilinou V, Kolios AJ, Di Lorenzo G (2015) A comparative multi-disciplinary policy review in wind energy developments in Europe. Int J Sustain Energy 1–21: doi:10.1080/14786451.2015.1100194 Nalianda DK (2012) Impact of environmental taxation policies on civil aviation—a techno-economic environmental risk assessment. PhD Dissertation, Cranfield University, Cranfield, UK
Nordahl M (2011) The development of a life cycle cost model for an off-shore wind farm. MSc Thesis, Chalmers University of Technology, Göteborg, Sweden
Papatheou E, Dervilis N, Maguire AE, Antoniadou I, Worden K (2015) A performance monitoring approach for the novel Lillgrund off-shore wind farm. IEEE Trans Ind Electron 62(10):6636–6644 Perkgoz C, Sakawa KKM, Kato K, Katagiri H (2005) An interactive
fuzzy satisficing method for multiobjective stochastic integer pro-gramming problems through a probability maximization model. Asia Pac Manag Rev 10:29–35
QGIS A Free and Open Source Geographic Information System.http:// www.qgis.org/en/site/index.html. Accessed 2017
Renewables First What are the main project risks for wind power? (2017)https://www.renewablesfirst.co.uk/windpower/windpower -learning-centre/what-are-the-main-project-risks-for-wind-pow er/. Accessed 2017
RYA Round 3 wind farms.http://www.rya.org.uk/knowledge-advice/ offshore-renewables/Pages/round-3-wind-farms.aspx. Accessed 2017
Saavedra-Moreno B, Salcedo-Sanz S, Paniagua-Tineo A, Prieto L, Portilla-Figueras A (2011) Seeding evolutionary algorithms with heuristics for optimal wind turbines positioning in wind farms. Renew Energy 36:2838–2844. doi:10.1016/j.renene.2011.04.018 Sakawa M, Kato K, Katagiri H (2004) An interactive fuzzy
satisfic-ing method for multiobjective linear programmsatisfic-ing problems with random variable coefficients through a probability maximization model. Fuzzy Sets Syst 146:205–220. doi:10.1016/j.fss.2004.04. 003
Sakawa M, Matsui T, Katagiri H (2013) An interactive fuzzy satis-ficing method for random fuzzy multiobjective integer program-ming problems through probability maximization with possibility. Fuzzy Inf Eng 5:335–350. doi:10.1007/s12543-013-0146-0 Shafiee M, Brennan F, Espinosa IA (2015) Whole life-cycle costing of
large-scale offshore wind farms. Paper presented at the Confer-ence: European Wind Energy Association (EWEA) Paris, France Stewart T et al (2008) Real-world applications of multiobjective optimization. Multiobjective Optim Interact Evol Approaches 285–327: doi:10.1007/978-3-540-88908-3_11
The Crown Estate (2010a) The Crown Estate announces Round 3 off-shore wind development partners.http://www.thecrownestate.co. uk/news-and-media/news/2010/the-crown-estate-announces-rou nd-3-offshore-wind-development-partners/. Accessed 2017 The Crown Estate (2010b) Round 3 zone appraisal and planning. A
strategic approach to zone design, project identification and con-sent. https://www.thecrownestate.co.uk/media/5702/ei-km-in-pc-method-052010-round-3-zone-appraisal-and-planning.pdf. Accessed 2017
The Crown Estate (2013) Round 3 offshore wind site selection at national and project levels.https://www.thecrownestate.co.uk/me ia/5644/ei-km-in-pc-planning-062013-round-3-offshore-wind-site-selection-at-national-and-project-levels.pdf
The Crown Estate (2017) A guide to an offshore wind farm. The Crown Estate. https://www.thecrownestate.co.uk/media/5408/ei-km-in-sc-supply-012010-a-guide-to-an-offshore-wind-farm.pdf. Accessed 2017
UK Ports Directory Ports The Comprehensive Guide to the UK’s com-mercial ports.http://uk-ports.org/. Accessed 2017
Wan C, Wang J, Yang G, Gu H, Zhang X (2012) Wind farm micro-siting by Gaussian particle swarm optimization with local search strategy. Renew Energy 48:276–286. doi:10.1016/j.renene.2012. 04.052
Wind energy The facts (2017) Development and investment costs of offshore wind power.http://www.wind-energy-the-facts.org/dev elopment-and-investment-costs-of-offshore-wind-power.html. Accessed 2017
Wolpert DH, Macready WG (1997) No free lunch theorems for opti-mization. IEEE Trans Evol Comput 1:67–82. doi:10.1109/4235. 585893
Yan G (2009) Research on green suppliers’ evaluation based on AHP & genetic algorithm. In: International conference on signal process-ing systems, pp 615–619. doi:10.1109/ICSPS.2009.92
Yeh W-C, Chuang M-C (2011) Using multi-objective genetic algorithm for partner selection in green supply chain problems. Expert Syst Appl 38:4244–4253. doi:10.1016/j.eswa.2010.09.091
Yuan Y, Xu H, Wang B (2014) An improved NSGA-III procedure for evolutionary many-objective optimization. In: Proceedings of the 2014 annual conference on genetic and evolutionary computation, ACM, pp 661–668