THE SIMULATED RAMAN EFFECT
Donald M. Paul
A Thesis Submitted for the Degree of PhD
at the
University of St Andrews
1972
Full metadata for this item is available in
St Andrews Research Repository
at:
http://research-repository.st-andrews.ac.uk/
Please use this identifier to cite or link to this item:
http://hdl.handle.net/10023/14624
THE STIMULATED RAMAN EFFECT
A Thesis presented by Donald M. Paul, B.Sc.
to the
University of St. Andrews in application for the Degree
of Doctor of Philosophy.
ProQuest Number: 10167165
All rights reserved INFORMATION TO ALL USERS
The quality of this reproduction is dependent upon the quality of the copy submitted. In the unlikely event that the author did not send a com plete manuscript and there are missing pages, these will be noted. Also, if material had to be removed,
a note will indicate the deletion.
uest
ProQuest 10167165
Published by ProQuest LLO (2017). Copyright of the Dissertation is held by the Author.
All rights reserved.
This work is protected against unauthorized copying under Title 17, United States C ode Microform Edition © ProQuest LLO.
ProQuest LLO.
789 East Eisenhower Parkway P.Q. Box 1346
DECLARATION
I hereby certify that this thesis has been composed by me, and is a record of work done by me, and has not previously been presented for a Higher Degreec
This research was carried out in the Physical Science Laboratory of St. Salvator's College, in the University of St. Andrews, under the supervision of Mr. A. Maitland.
CERTIFICATE
I certify that Donald M. Paul, B.Sc., has spent nine terms at research work in the Physical Science Laboratory of St, Salvator’s College, in the University of St. Andrews, under my direction, that he has fulfilled the conditions of Ordinance No. 16 (St. Andrews) and
that he is qualified to submit the accompanying thesis in application for the Degree of Doctor of Philosophy.
CAREER
I first matriculated in the University of St. Andrews in October 1960. X studied Mathematics
and Natural Philosophy, and obtained First Class Honours in Natural Philosophy in 1964.
ACKNOWLEDGEMENTS
I would like to thank my supervisor, Mr, A, Maitland, for his encouragement and helpful advice throughout this work and also Professor J,F, Allen for making the necessary
laboratory facilities available,
I would like to thank the entire technical staff, and Mr, Fritz Akerboom, who made the argon laser tube and
ABSTRACT
THE STIMULATED RAMAN EFFECT
The present work describes a theoretical and experimental investigation of the stimulated Raman effect excited by the focused output of a slow, Q-switched ruby laser in the self-focusing liquids benzene, nitrobenzene, chlorobenzene, and carbon disulphide. Time relationships between the exciting pulse, the transmitted laser pulse, and the time resolved stimulated Raman spectra have been studied using a high speed streak camera in conjunction with fast photodiodes. The spontaneous Raman spectra of these liquids have been investigated using a photoelectric Raman spectrometer and a method is outlined for measuring the relative values of the stimulated Raman gain coefficients.
It is experimentally shown that, on a nanosecond time scale, stimulated Raman lines are not generated simultaneously but in the
sequence Stokes, Anti-Stokes, and second harmonic Stokes. Further, the time delay between the start of first and second harmonic Stokes is shown to be dependent on the rate of rise of the exciting pulse. It was found that during stimulated Raman generation the laser pulse
transmitted laser pulse not the exciting pulse. The threshold for the onset of pulse distortion is shown to be dependent on the rate of rise of the exciting pulse whilst, in all the liquids, apart from carbon disulphide, the 'cut-off' threshold is dependent on the peak power of the incident pulse. Investigation of the pulse distortion thresholds for the range of liquids produced relative values which did not agree with those predicted from either the optical Kerr coefficient or the calculated stimulated Raman gain coefficients.
A theoretical model of the self-focusing of a focused beam in a medium for which both électrostriction and the optical Kerr effect are
significant is presented and has been used to explain the anomalous
threshold results. Within the experimental scatter of the results obtained this model appears to explain the observed threshold effects. Since the forward stimulated Raman generation was weak in comparison to the trans mitted laser pulse and followed this distorted pulse rather than the
exciting pulse, it is concluded that stimulated Raman is not the dominant mechanism in the interaction. A brief review is presented of the theory and predictions of steady and non-steady state Brillouin scattering. Although the phonon lifetimes for the other liquids appear to be too
CONTENTS
Page CHAPTER 1 THE RAMAN EFFECT
loi The Raman Effect 1
1.2 Polarisability 2
1.3 Semi-Classical Treatment 4
lo4 Dirac's Scattering Theory-Stimulated Raman Gain 6 CHAPTER 2 STIMULATED RAMAN EFFECT
2.1(a) Intra-Cavity Stimulated Raman Spectra 15
2.1(b) Extra-Cavity Stimulated Raman Spectra 16
2.2 Stimulated Raman Gain 17
2.3 Anti-Stokes Emission 20
2.4 The Raman Laser 22
2.5 Anomalous Gain and Threshold 24
CHAPTER 3 NON-LINEAR EFFECTS
3.1(a) SeIf-Trapping 27
3.1(b) Self-Focusing and Self-Trapping 27
3.2(a) Electrostriction and the Optical Kerr Effect 30
3.2(b) Parallel Excitation 33
3.2(c) Focused Excitation 33
CHAPTER 4 STIMULATED AND SPONTANEOUS RAMAN
4,1
(EXPERIMENTAL ASSESSMENT)
A - Stimulated Raman Spectra
Page
4.2(a) The Ruby Laser 36
4.2(b) Output Pulse Characteristics 37
4.3(a) The Autocollimator 38
4.3(b) Autocollimator Resolution 39
4.3(c) Alignment Technique 39
4.4(a) The Rat’s Nest Calorimeter 40
4.4(b) Theory 41
4.4(c) Corrections 42
4.4(d) Measurement Circuit 43
4.4(e) Energy Output 43
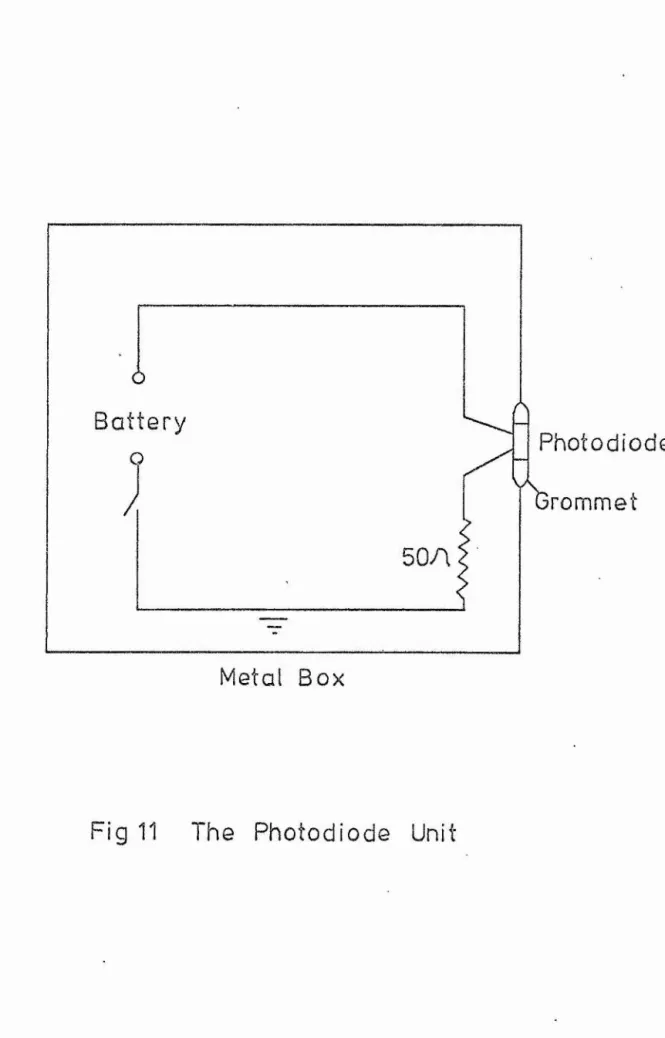
4.5 Photo-diode Unit 43
4.6(a) Time Resolution of Stimulated Raman Spectra 44
4.6(b) Triggering 45
4.6(c) Helium-Neon Alignment Laser 48
4.6(d) Optical Train 48
4.6(e) The Spectrometer 48
4.6(f) Modification of Spectrometer for Time
Resolution 50
4.6(g) Setting-up Procedure 51
4.7(a) Results - Streak Records 52
4.7(b) Distortion of the Laser Output Pulse during
Raman Generation 52
4.8 Conclusions 55
Page B - Spontaneous Raman Spectra
4c10 Raman Scattering Gross Section 58 4.11 Proposed Experimental System 59
4.12 Raman Spectrometer for Spontaneous Emission
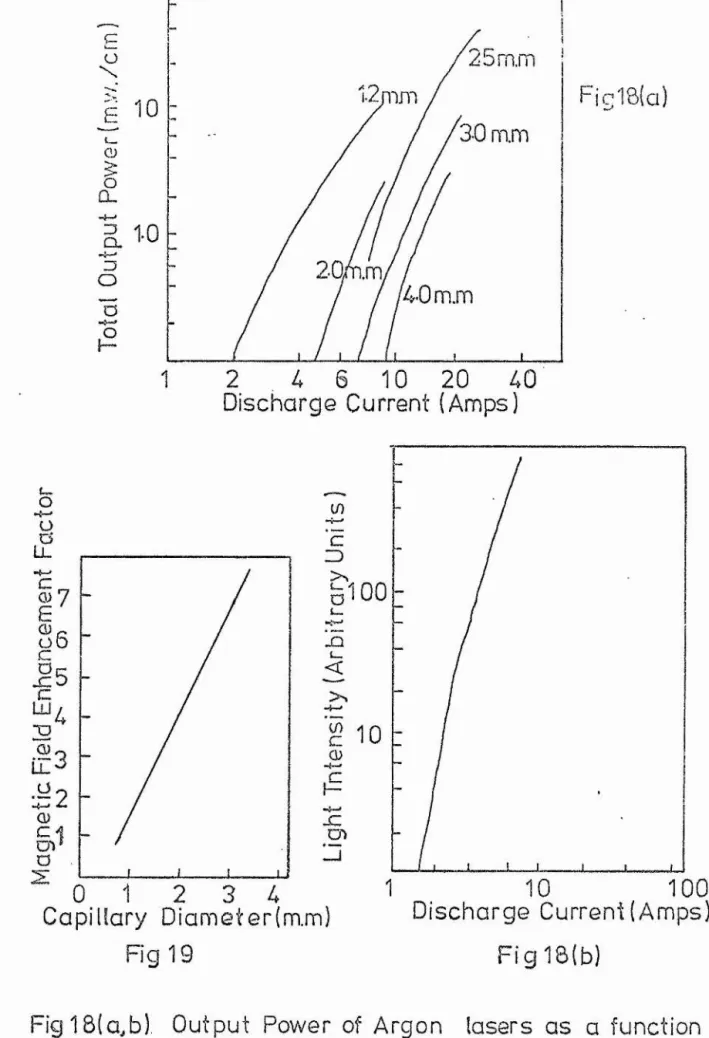
4.12(a) The Argon Laser 60
4,12(b) Design Criteria 61
4.12(c) Tube Design 62
4.12(d) Gas Return Path 63
4.12(e) Power Supply 63
4o12(f) Vacuum and Gas Filling System 64
4o12(g) Laser Cavity 65
4ol3 Detection and Recording of Raman Spectra 65 4.14 Monochromator and Pen-Recorder System 66
4.15 Scattering Geometries
4.15(a) Intra-Cavity System 67
4.15(b) Extra-Cavity System :>8
4.16 Assessment 69
CHAPTER 5 CORRELATION OF TIME RESOLUTION EFFECTS IN STIMULATED RAMAN WITH PULSE DISTORilON OF TRANSMITTED PULSE AND RATE W RISE'OF EXCITING PULSE
501 Introduction 71
502 General Experimental Conditions 72
5.3 Experimental Modifications 73
5.4 Experimental Procedure 73
Page 50 6 (a) Determination of Pulse Distortion 74
50 6 (b) Rate of Rise Measurements 74
50 6 (e) Error in Pulse Distortion Threshold 75
50 6 (d) Streak Photographs 75
5.6(e) Treatment of Results 76
5.7 Results - Benzene
5.7(a) Streak Record 77
5o7(b) Characteristics of Pulse Distortion 77
5,7(c) Correlation of Stokes Generation with
Distortion of Transmitted Pulse 78 5.7(d) Delay between Stokes and Second Stokes Threshold
as a Function of Rate of Rise of Exciting
Pulse. 78
5o7(e) Influence of Rate of Rise of Exciting Pulse on
Pulse Distortion Threshold 78 5.7(f) Influence of Input Pulse Amplitude on Pulse
Distortion Cut-Off 78
5.7(g) Generation of Second Harmonic Stokes Radiation 79 5.8 Results - Carbon Disulphide
5.8(a) Streak Record 79
50 8(b) Characteristics of Pulse Distortion 79
5.8(c) Influence of Rate of Rise of Exciting Pulse on the Delay between Stokes and Second
Harmonic Stokes 79
5.8(d) Stokes Streak Duration and Pulse Distortion
Duration 8 0
5.8(e) Influence of Rate of Rise of Exciting Pulse
Page 5.8(f) Influence of Input Pulse Amplitude on Pulse
Distortion Cut-Off 80
5.8(g) Generation of Second Harmonic Stokes Radiation 80 5.9 Results - Chlorobenzene
5.9(a) Streak Record 81
5.9(b) Characteristics of Pulse Distortion 81 5.9(c) Stokes Streak Duration and Pulse Distortion
Duration 81
5.9(d) Influence of Rate of Rise of Exciting Pulse
on Pulse Distortion Threshold 81 5.9(e) Influence of Input Pulse Amplitude on Pulse
Distortion Cut-Off 81
5.10 Results - Nitrobenzene
5.10(a) Streak Record 82
5.10(b) Characteristics of Pulse Distortion 82 5.10(c) Influence of Rate of Rise of Exciting Pulse
on Pulse Distortion Threshold 82 5.10(d) Stokes Streak Duration and Pulse Distortion
Duration 82
5.10(e) Influence of Input Pulse Amplitude on Puls%
Distortion Cut-Off 82
5.11 Summary of Results
5.11(a) Correlation of Pulse. Distortion Duration
with Streak Duration 83
5.11(b) Pulse Distortion 83
5.11(c) Nature of Threshold for Stimulated Raman
Radiation 84
5.12 Discussion of Results
5.12(b) Transient Response 88 5.13 Experimental Results
5.13(a) Threshold as Observed from the Onset of Pulse
Distortion 93
5.13(b) Time Resolution and Pulse Distortion Results 94
5.13(c) Stimulated Raman Gain Coefficient 96 5.13(d) Anomalous Effects Due to Focused Excitation 96
CHAPTER 1 THE RAMAN EFFECT 1,1 The Raman Effect
The Raman effect, discovered by Raman and Krishnan^ is the inelastic scattering of light by a molecule such that when a photon interacts with the molecule some of the photon energy is distributed into the rotational and vibrational states of the molecule. The result of the interaction is that light scattered from the molecule is shifted in frequency by amounts corresponding to the particular vibrational and/or rotational states excited. The phenomenon was predicted by
2
Smekal who reasoned that a quantum of light of frequency, v, could interact with a molecule in energy state, E^,by an inelastic collision. Conservation of energy demands that
hv + E- k hv' + E , n 1.1,1(a)
where hv' is the energy of the scattered photon, and E^ is some definite state of the molecule after the interaction. If we have v'<v, the
line generated is termed a Stokes line, and if v'>v, the line generated is an Anti-Stokes line. Then we haVe
m + hv ^ m* + hv'» U'<v, . Stokes
m* 4- hv m + hv", v'*>v, Anti-Stokes 1,1.1(b) where m is the molecular ground state and m^ t - e excited state. The Raman frequencies are given by
v'-v = (E^ - E^)/h . 1.1.2
The excitation does not correspond to a straightforward absorption and re-emission of energy. A third state m ^ which is an intermediate
state, is involved, but the incoming radiation need only satisfy the condition that
hv > E. - E^ o 1,1.3 The process may be written as
m 4 hv m
V
m V m* 4 hv* The net process is given by
m 4 hv m* 4 hv', where m > m*.
V
1o 2 Polaris ab i1ity 3
Placzek related the. Raman effect to changes in the polarisability of the molecule interacting with an optical field. When a molecule is introduced into an electric field, E_, an electric dipole moment,
per molecule is induced. If the polarisability of the molecule is a then the magnitude of the induced dipole is given by
|P,| = a |e | . , 1.2.1
Both 2 ^ are vectors and for an isotropic molecule they are in
the same direction and a is scalar. However, for nvnisotropic molecules the application of an electric field in a fixed direction induces a moment in a different direction and a is a tensor.
The equations taking account of the different polarisabilities along the different principal axes of the molecule are
« a E + a E 4 a E ,
X XX X xy y XZ z
1 — a E + a E 4 a E 5
y yx X yy y yz z " ” oi E + a E 4 a E
“3~
The tensor, a, is defined by the nine coefficients a , ,..^ but since we have - ^yx’ etc., there are effectively only six. These six
coefficients together with the coordinates x, y, z may be used to derive the polarisability ellipsoid which is given by
“xx af + «yy + «22 = 1
Thus the components of the polarisability of the molecule are taken along the three component axes x, y , z,and the magnitudes of these components determine the polarisation ellipsoid.
The criteria for generation of Rataan can be derived classically by considering the oscillating electric vector of an optical field,
EcosZxvt, acting upon a molecule. For very small vibrational amplitudes the polarisability is related to the normal vibrational coordinate, q^, by the equation
a » + (3a/3q )°q , V 1.2,3
where the zero corresponds to the equilibrium value. This equation holds for each of the six coefficients defining a. The dependence of
the normal coordinate on the vibrational frequency, is given by q = q° cos2xv t , V V 1.2,4
where q° is the normal coordinate of the initia^ equilibrium position. Putting the frequency variation of E into 1^2*2 we get
= ^“x x \ ^ “ x y \ ^ . 1.2.5
From 1.2,3 and 1,2,5, we have o
P ~ ( a E + a E 4 a E ) cos2nvt X XX X xy y xz z
9a 9a 9a
•4-This equation readily gives
V
V \ Epcos2,rvt 1.2.6(b) q 9a4 {( — S. )E 4 o o o , }{cOS2ïï(v"”V )t 4 C0S2ïï(v4v )t}
z dq X V V
V
The first term in 1,2,6(b) corresponds to a dipole oscillating at the frequency of the incident radiation, whilst the second term with
frequency and (v+v ), correspond to Raman Stokes and Anti-Stokes generation.
The physical interpretation of the above expression is that, whilst the polarisability gives rise to Rayleigh scattering, it is the
changes in the polarisability during intramolecular motions which are. responsible for Raman generation. The criterion for Raman generation is
therefore that one of the six polarisability tensors must change curing an intramolecular vibration or rotation.
This simple classical treatment indicates equal probabilities (intensities) for Stokes and Anti-Stokes which is not the case, A quantum mechanical treatment gives the correct intensities of the various Raman,lines,
1.3 Semi-Classical Treatment
Although the dispersion theory of Kramers and Heisenberg (1925) can readily be extended to the Raman effect, the first analysis was
3
“5“
perturbation of the dipole moment caused by a monochromatic radiation field and hence calculated the magnitude of the electric dipole
moment, for a molecule making a transition from state k to ' state n through intermediate states r . Placzek’s result is
^kn ^ ■*" \ r ' 2.3.1
A is a complex time-independent field vector, and is the
moment between states k and r, and states r and n. This dipole
moment corresponds to scattering light at a frequency v+v,^ (anti-Stokes) subject to the condition
EL - E < hv o k n 1.3.2
The intensity of the total Raman scattering can be derived from the classical dipole radiation for the transition k to n which gives
3c
The physical content of the above expression is that the Raman effect is an interaction whereby the molecule makes a transition (k,r,n) under the action of the radiation field. Two levels (k,n) can only exhibit the Raman effect provided that there exists a third level to which transitions are allowed. A more rigorous quantum electro dynamical treatment shows that the two terms of the electric moment correspond to two mechanisms producing the Raman effect. According to Heitler, these are the following;
(1) an absorption event followed by emission leaving the molecule in state n; and
—6—
Using the polarisation equations of paragraph 1,2 the electric
moment, can be related to the magnitude of the induced dipole.
Designating the Cartesian coordinates x, y, z by the subscripts p and
a 5 we obtain
where (C is given by
(Cpc)kn = ^ <("a)kn
+ f(Wp)kn + hv)} 1.3.5
It can be readily shown that
“ ^“pa^cn 1.3.6 ^
Therefore, the magnitude of the induced dipole can be expressed in terms of the polarisability by the following
P P,o
This can be written as F, = A Z (a ), ,e kn pa kn or 1,3.7(b)^ P,cf
where e is a unit vector in the direction of the applied field for a plane polarised monochromatic exciting source .
1.4 Dirac's Scattering Theory
In Placzek's treatment, the relation between the electric moment and the scattered radiation was hypothesised, but in Dirac's
-7-iïiteraction energy. H ’, thus we have H » H + H 4 H ’m s
The Hamiltonian of the unperturbed system consists of H ^ H + H , o m s
The interaction energy, H', is considered to be the perturbation. To determine H^, the radiation is imagined to be enclosed in a cavity with walls having specular reflecting surfaces so that the radiation field consists of standing waves i.e», eigenvibrations
(modes) of energy, E, given by
E = 2E = s V Z e E'(t) s s sinF s 1.4.1
s s
In equation 1,4.1, is given by
2g = 2i,Vg(k^r)/c + 6g .
and the other symbols are as follows, e is a unit vector in the direction of the field, E^ is the field amplitude, the frequency,
the propagation vector, r the position vector, c the velocity of light, 6 an arbitrary phase, and V is the volume of the cavity.
The classical expression for the energy density of a harmonic oscillator leads to the equation
Hg = + 4irVg^ ) 1.4.2
s
Equation 1.4.2 represents a system of oscillators with frequency v and mass unity. The number of eigenvibrations in unit volume in a frequency range v to v +dv is readily shown to be
dN^ ~ (87TV^/c^)dv 1.4,3
The interaction of the radiation and the molecule is given by
H' = -(n.E) 1.4.4
- 8
-The SchrBdinger equation of the unperturbed system (molecule and radiation) is given by
(H^ - E)* = 0,
where 4 i E (q^^ 4 An^Vg^q^^)
8
The eigenvalues are the sums of the energies of the molecule and the cavity while the eigenfunctions are products
E = E 4 E ( n 4 ^ ) h vns n g ^ s 4 = IÜ r Uns ^n g ns
The state of the radiation field is determined by the quantum numbers Ug g which indicate the number of light quanta that occupy the individual eigenvibrationso The eigenfunctions, U , are harmonic oscillator
functions.
Let us consider next any given state of the radiation field, s^ and state k of the molecule. As long as the energy is the sum of
that of the molecule and the cavity, the system remains in the same state, When is included, transitions are made to state s,n. Eigenfunctions of the perturbed system are developed in terms of the unperturbed system, thus we have
i|} « f a (t) é exp(- iE, ^t/h).
ns ns ns ns
First order perturbation theory then gives
/I\ ks^ fl-exp2ri(v )t}
= 2 H» ° 1.4.6(a)
ns
nk SB
where °
ks
(H')„g “ /l'* '2t
and in second order
k s ns^
(
2) „ ,
rs* 2(v ,+v_,._ ) rk s's , 2(v___+ V ,)tin
o S3
l“ exp27ri(v .+v_ ) t - — ---1.4.6(b)
+ ''bs )O
By substitution of H' from equations 1,4.4 and 1.4,1 into 1,4,6, the first order perturbation theory yields processes corresponding to absorption and emission for which the atom changes its quantum state and for which the population number of the cavity oscillators changes by ±1,
To obtain the scattered radiation, the second order perturbation theory is considered. Since H' (according to 1.4.1)and 1.4.2 is linear in q^, and since the selection rules for the harmonic oscillator are Ang - ±1, it can be seen by inspection of 1.4.6(b) that only those
transitions are possible for which two cavity oscillators change by ±1, while the molecule may change or remain in the same state.
Considering the cavity, three cases are distinguished. The population numbers of cavity oscillators are denoted by n and a 6 where the
subscripts a and $ are particular eigenvibrations of the radiation field, s, which undergo a change of state.
1. n ' - n + Ij, ” n. 4 1, double emission.
— a a $ 3
2, n ' = n - 1, n_' = n_ ™ 1, double absorption,
— a a 3 p
- 10
-In case 3, hv or hv disappear and hv or hv appear as scatteredd p p a radiation. The third process is the Raman effect and we shall now consider this to obtain an expression for the probability amplitude,
/ 2 \ 2
|a^g I 0 Equation 1.4.6 along with the matrix elements shown in
1.4.1, 1.4.4, lp4.5 and the following values for the coordinate matrices of the oscillator are employed,
(n ,4l)h
q = /-"-n exp(2TTiv,.t) b' a+1 8tt Vg ®
(n, +l)hv,
q = i/ ^ exp2'iïiv t
"s'*S+l 2 *
n h
q = /— exp2riv t
s n hv.
q = — Ê. exp27riv t /2\ 2
The quantity |a^^ | gives the probability of the molecule making a transition n to k in a time t by an interaction with the radiation field in a state s^(n^,n^.n^,n^ which after the interaction is in a state sCn^yn^, — n-l-g+l — For this transition we have
n <n„+l)v v„sitt^F sin^F.l'-"® kn ''a ^6^ and
^2
a'- ‘ 8 ' “kn '
aB _ .-Ir
'kn - ^ ^ " ”- 7 r ; v v - “
- 11
-eigenvibrations2 a§ that occur in the incident radiation* The first
summation is carried out by integrating over all solid angles and
emitted frequencies^ dv« On consideration of the number of vibrations per solid angleg, the frequency range given by 1.4.3 and the density^
s> of the radiation of a given polarisation and frequency in the cavity%
where P.,(v*,w')dv'dw? « K n hv /V »
J p 3 P
the probability may be rewritten in the fo^m l^ns^l vsin^r^sin^r £ //(p
a a J J c
, 2 2 _2
X s ' kn ' sin 7t(v +kn a v -v*)t(v +v -v') dv'dw' 1.4* 7(b)kn a
The vector e is replaced b> the unit vector e , .,, which is
P 5» J
perpendicular to the direction of propagation k^ and fixed by
GL Ô
its state of-polarisation j *, j ’ - 1,2 and s^^ is denoted by
01 k ^ T ^ « «
\ n * The eigenfrequency, is replaced by the continuous /2^ 2
frequency v* so that the probability ja^^ | is now a continuous function of solid angle and frequency.
For large time intervals, the factor
2 2
sin 7t(v, + V “ v’)t/(v^ + V - v') ,kn a kn a '
has a sharp maximum at v* - + v , and it follows that only
- 12
-^ n 9 9
/ sin it(v» +v “v'^)t/(v, +v -v*) dv'' = ir t .
^ kn a kn a
2
The quantity sin is evaluated over all eigenvibrations. Since the phases 6^ contained in (see 1.4*1) are independent, we
2
have sin F^ ~ and we get
^
f{Pj,(v%w')+ïÿ}|s«;rkYd,,1*4*8 If 1.4.8 is integrated over all eigenvibrationsin the incident frequency, then we have
Av, Ao)
p.(u,w)dudw - Z j a n hv /Va a and, finally, we get
1^4 1 3
w, (V,V«) = X ///p.(v,ui){ ^ + p'.,(v',0i')}
hr j.j' j ^
X sk 1 k M ’ ,^ I dvdwdw' 1.4.9
The probability per unit time for the transition of a molecule from state k to state n under the influence of the radiation field and for a quantum hv* of undetermined polarisation and direction tc be scattered is given by i.e.,
hv hv* ~ h(v ± V, )kn
This probability, as is clearly shown in 1.4*9, is increased when radiation of frequency v ± v. is present, i.e., induced emission* Two special cases of equation 1.4.9 are discussed below.
Case 1
—13—
plane polarised and monochromatic,
Then we have
// Zp.(v,w)dvdw ^ « J A L. J ^ 4
tt 2tt ^
J and equation 1*4*9 becomes
4 , . , 3
(v+^kg) JaL^
he 2tt
X[ h ^
J h'^ j»
r (^o^kr)(GkVjvMro) ^
f ^rk " ^ ^rk * ^
2
dw
Vector e^ is a unit vector in the direction of the incident radiation, The integral may be written as follows
/ E |â , , Vl^do)' , j.
where V is a vector (see diagram),
If components are chosen such that e^^, is in the plane formed by k and v and e^^^ perpendicular to it then we have
f I le V| dco* “ 2tt/ |e v| sin0d0
j* k'j* L
2it/ I v l^ s i n ^ e d e = | V | ^ ,
and
\ n - • 1.4.10
3c h r rk .. ... .— — — Vrn. + V The scattering intensity is given by
\ n "
- 14
-oscillator as in equation I*3*3, By comparison^, therefore, with equation 1.3,3 and 1,3*7(b),this can be written
7 5
I = I Z L ^ 4 2 R ' 4 ” R - s° “kn '3c
where is the intensity of the exciting beam, Placzek further showed that if the system was averaged over all molecular orientations, a
1 - '
factor Y was introduced. The normal Raman effect is therefore given by
2 7^5 4 ^ 2
Ir = . ^S°“kn “ lo4.11
3 c Case 2
In the presence of radiation density, p of significant j*
value it can be shown from equation 1,4*9 that \ n ' Pj(Av) + »kn
where and are termed the probability coefficients for a spontaneous and stimulated Raman scattering (analagous to Einstein coefficients)* The stimulated Raman effect is discussed in Chapter 2
- 15
-CHAPTER 2
THE STIMULATED RAMAN EFFECT 2ol(a) Intra-Cayity Stimulated Raman Spectra
The stimulated Raman effect was discovered with the development of the Q-switched laser^ of McClung and Hellworth using a nitrobenzene Kerr cell. Woodbury and Ng^ found that radiation appeared at 7670& which did not correspond to any of the emission lines of ruby and yet
its power was 15% of the main ruby emission at 6943& . The new line was in the same direction as the laser output and was investigated by
7
Eckhard, et al , who identified the line as a strong Raman vibration in the nitrobenzene and correctly deduced that it was generated by
stimulated Raman scattering. These authors investigated a range of liquids with a cell inside the laser cavity and summarised the main properties of the effect as follows.
1. There is a threshold for the process, which when exceeded, causes the power output in the Raman line to increase to values in the range 1% - 1 0 % of the primary laser pulse.
2, The lines excited correspond to the excitation of Raman vibrations in the liquids studied.
3, The emission consists of not only the Raman lines, but also their harmonics given by v-nv^^^ where n is an integer and
is the Raman vibration frequency.
- 16
-6 o The Raman emission has the same beam divergence as that
of the laser*
7o The line width of the stimulated Raman line is very much less than that of the normal Raman line*
The above phenomena correspond to one type of stimulated Raman spectra and are described by their method of generation which is called intra-cavity generation* The second type is termed extra cavity generation and this occurs when the Raman cell is outside the laser resonator*
2ol(b) Extra-Cavity Stimulated Ramah Spectra
S
It was found by Terhune that stimulated Raman spectra could also be generated by focusing the output of a Q-switched laser into a Raman cell outside the cavity* The effect was investigated by
9
Stoicheff and the following effects were found,
1* There is a threshold for the process, not only in the
intensity of the laser, but also in the path length in the liquid used
2o Both Stokes and anti-Stokes are generated and thr Raman lines are given by v ± nv^^ , where n is an integer*
3* When threshold is exceeded by a small amount, the harmonic lines are generated, so that it was concluded that threshold was the same for both fundamentals and harmonics* (However,the work described in this thesis shows that this is not the case)*
- 17
-symmetrical vibrations have the highest intensity and the narrowest
line widths, they are expected to have the lowest threshold (see Section 2*2),
5c The angular distribution was investigated and it was
found that, whilst Stokes emission occurs within angles of 4°-5° about the laser beam, the anti-Stokes emission occurred at discrete angles of a few degrees to the beam direction.
6 , The line widths of both Stokes and anti-Stokes lines are
narrower than the more usual unstimulated Raman lines*
7* The generation of harmonics could not be explained on an iterative basis as the threshold for both was the same* In experiments using two cells and two liquids no lines were generated corresponding to sum and difference frequencies so that again an iterative mechanism did not seem possible*
,2*2 Stimulated Raman Gain
Theoretical treatments of stimulated Raman scattering have
fallen into two categories* There were the treatments of Hellwarth^^^^^ based on the individual molecular process of Raman scattering and
“”18—
molecule picture requires separate thresholds for each harmonic whilst
the multi-molecule scheme bases its treatment on the modulation of
the dielectric constant of the medium by the optical fields of laser
and first Stokes radiation requiring no further threshold condition. It will be shown in this thesis that separate thresholds do exist an expression for stimulated Raman gain, based on the single molecule
scattering equations of Placzek and Dirac shown in Chapter 1, is derived below.
It was shown, using Dirac’s scattering theory that the probability of stimulated Raman scattering could be separated into two parts, one proportional to the energy density of the exciting radiation, and another proportional to the energy densities of the excited and scattered
radiation. Following this treatment, the probability, W, of Raman scattering per molecule can be written as (cf. eq 1 .4 .1 2 )
^ ^ ® 2.2.1
where, as shown previously, A and B correspond to spontaneous andxï^iHi xim stimulated scattering, and the intensities of the laser and the
stimulating Raman radiation are I^ and I^, respectively. The relation between A and B is given bymn mn
/c ) B ^ 2 .2 . 2
The intensity due to Raman scattering is given by
^.2.3
- 19“
I_ = 4 g,2 2 .2 . 4
R R mn
By comparing 2.2,4 with the equation 2.2,3 which accounts for spontaneous scattering, it is clear that we have
A = (2^irV^/3\c^)o^ mn R mn 2.2.5 and,therefore we get
= (2^7T^/3\c^)a^ 2 .2 . 6
mn mn
With high laser intensities, the spontaneous Raman component can be neglected with respect to the stimulated scattering, so that the Raman intensity due to stimulated scattering is given by
Ij^ 6 Vr = B g ^ h V R o 2 . 2 , 7
If N is the number of molecules per unit volume, the number of molecules in a cylinder of unit area and length dx, is Nd%; therefore, the
increase in intensity in a length dx is given by
d i R = ( N I ^ I R /A V R ) B ^ h v R d x , 2 , 2 . 8
where the stimulating intensity, Ir, is generated by spontaneous
scattering into the frequency range Av (the line width for spontaneous scattering). Substituting the value for B^^ into 2,2,8 we obtain
dl„/l„ = (2^TT^Nv„/3\c^Av„)a^ L dx . -K. Ü JK. JA. lïin JLi :.2.9 Integrating over a distance Ji and taking the initial value of Ir
to be Ir° gives
ta(I„/I„°) = (2^ti\v„/3\c^Av„)a^ . 1_ . & .K K K mn L Finally, the expression obtained for the gain, G, is
- 20
-is greater than the cavity losses,
2o3 Directionality of Anti-Stokes Emission
The directionality can be explained on the basis of the momentum matching condition in a dispersive medium. Both momentum and energy are conserved in an interaction between radiation and matter.
When a single photon ’collides’ with a molecule, the molecule recoils to conserve momentum* When a coherent beam interacts with the molecules of the medium, the difference of momentum is taken up by an optical
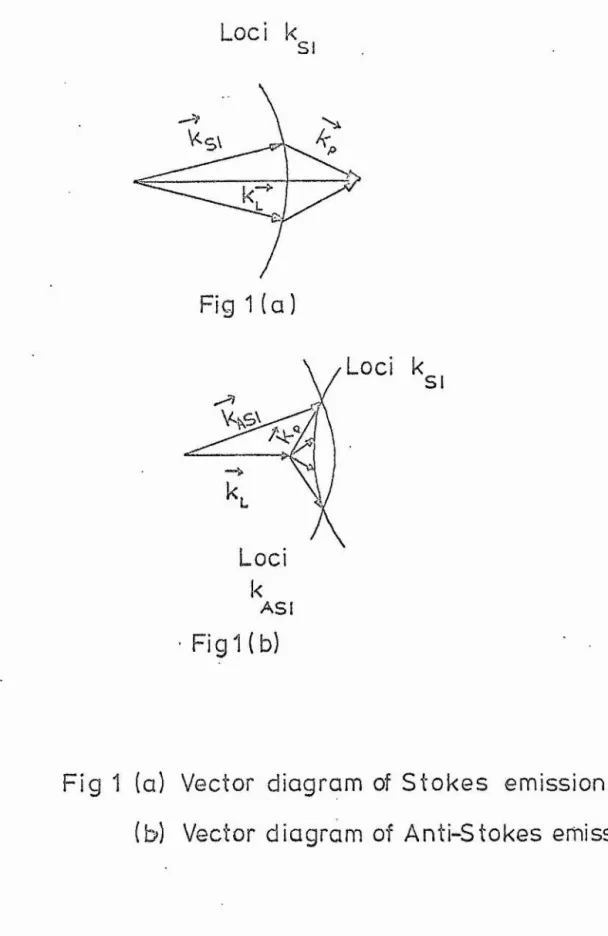
phonon. The directions in which anti-Stokes and Stokes radiation are emitted are readily obtained in terms of wave vectors, k. The condition for Stokes emission is given by
^ ’ 2.3.1
where k- , k -, k are the wave vectors for the laser and Stokes— 1.1 '— s 1 — ”p
radiation and the optical phonon, respectively* Since the magnitude of kg^ is fixed by conservation of energy, the above relationship is satisfied at all points on a circle of radius k (see Fig 1), As the
si
Stokes beam gets away from the laser direction, the coupling between the two decreases and therefore the Stokes emission decreases, i.-e* Stokes emission is confined to a diffuse cone with an apex angle slightlylarger than that of the exciting laser*
For anti-Stokes generation the condition given by k. 1 - k * k 2.3,2
—As 1 —L —p must be satisfied.
Loci k
Fig 1 (a)
Loci
k
AS I
Fig Kb)
Loci k
SI- 21
-can only satisfy 2.3.2 for particular directions. Generation of
anti-Stokes radiation is, therefore^ only possible in a direction at a fixed angle to the exciting beaxno
The fact that anti-Stokes emission only occurs outside the cavity is thus explained by the vector model since the model shows that momentum matching condition cannot be satisfied at the same time as the directionality conditions for Raman laser action inside the cavity*
From this simple analysis a number of the features of the stimulated Raman effect can be explained*
lo Lines in the normal Raman spectrum with a high scattering probability and narrow line width will have the highest gain and the lowest threshold*
2. Intra-cavity generation of Raman spectra can be explained on the basis of a Raman laser in which stimulated Raman occurs when the Raman gain exceeds the cavity losses for the Raman line^^*^^.
So The directionality and nafrowing of the stimulated
Raman lines are explicable in terms of laser theory (Cain narrowing). 4* The threshold for the process (i.e. when the gain equals the cavity losses) is dependent not only on the laser intensity, but also on the length of the cell used in the cavity*
- 22
-2.4 The Raman Laser
It is clear from paragraph 2.2 that intra-cavity stimulated Raman radiation can be treated in terms of rate equations in which the laser acts as a pump for the generation of the Raman radiation* From 2.2.1 the probability of stimulated Raman scattering can be expressed as
I^R ^ ^ ^ *L *R ' 2*4ol
where n^ and n^ are photon densities at the ruby and Raman laser frequencies5, k is the filling factor, V is the volume of the optical
resonator, and n^ is the number of Raman active molecules per unit volume*
The loss of photons from the resonator can be expressed as
U)r(Wr/Qr), where Q is the quality factor of the laser at the Raman
frequency, and is the stored radiation density.
The rate equation for Raman laser action is therefore given by dn^/dt - k n^^ B n^ n^ “• * 2 .4 . 2
The threshold for the Raman laser, therefore, is given by
^Lth ^ ^ " i«4.3
From this it is clear that threshold is inversely proportional to the Raman scattering cross section. Using this expression Takuma and
13
-23-bases of an iterative scheme, that is, n^ generates n_^ and the
intensities of the harmonics were found to be comparable with that of the fundamental. This was explained on the basis of saturation. The rate equation of the Ruby laser is given by
dn^/dt « n n^ - kn^ Bn^ n^^ - w^n^/Q^, 2 .4 . 4
where B^ is the stimulated emission probability, and n is the population inversion. Under saturation conditions, we have dn^/dt - 0 and so from 2.2.4 we obtain
\ nBj^Cl - n ^^n~^)/kn^B, 2.4.5
where n B^ (~ /Q^) gives the threshold value of n for ruby laser action. It is clear, therefore, that n^ can be very large since under stimulated Raman conditions we have n >> n , and kn B << n B^.th m L
Similarly, n^ can saturate in the presence of the second harmonic, n^j^. The rate equation to be considered is
dn^/dt » " (“r
V V
’ 2.4.6 Under saturation conditions with n^, n^, n^>|, we have^Lth V n t -}
^2R " " n^ ) 2.4.7
which shows that the second harmonic can be as intense as the laser line. The above is at least qualitatively correct since the peak power output of the Raman laser was found to be comparable to that of the power necessary to produce stimulated Raman.
—24—
13
In spite of these anomalous effects Takuma and Jennings found that the input electrical power necessary to produce second harmonic Raman generation was found to be 1.7 times that of the fundamental suggesting that the process was iterative and should therefore be dependent on stimulated Raman gain.
2.5 Anomalous Gain and Threshold
When experiments were performed to investigate stimulated Raman gain and to predict thresholds for stimulated Raman, results were
13 obtained which did not agree with those of Takuma and Jennings
McClung (unpublished) found that the threshold for Raman in nitrobenzene was an order of magnitude less than that predicted. This result was explained by Bloembergen^^ who, in a semi-quantitative
analysis, showed that the multimode nature of the ruby output beam led to gains in certain modes which could be up to an order of magnitude
15
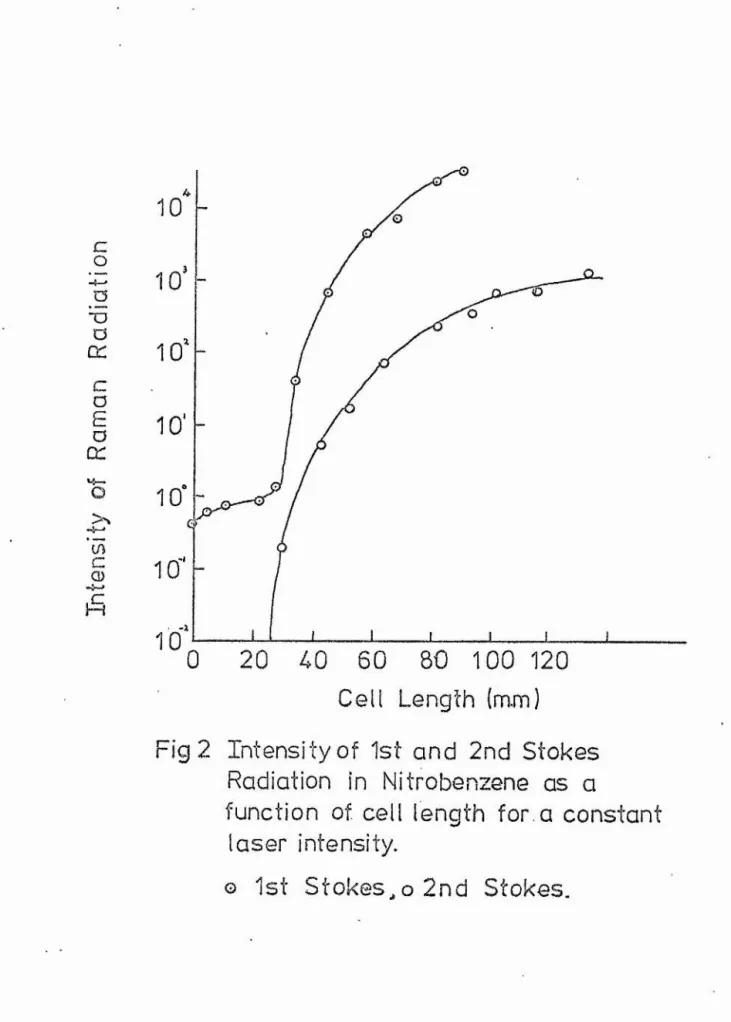
greater than the average gain. Lallemand and Bloembergen showed experimentally that the Stokes intensity could be explained on the multimode theory. Their experimental results (Fig 2) could be represented by the equation
“ f 5,threshold^* 2.5.1
where i refers to a mode and c^ is the mode dependent cross-section. The expression indicates that there is a threshold distribution explicable in terms of mode structure. The generation of the second harmonic Stokes radiation was explained on the iterative scheme with the first Stokes line acting as a pump. It was proposed that as soon
c
o
H
Cell Length (mm)
Fig 2 Intensity of 1st and 2nd Stokes
Radiation in Nitrobenzene as a
function of cell length for a constant
laser intensity.
* 25
-radiation increases rapidly, so depleting the laser power in the filament*
The Stokes second harmonic is then created in this filament whilst other harmonics are still below threshold* As the gain is increased, more Stokes modes go above threshold and the higher order intensities increase in a similar manner.
McClung et al^^, however, showed that the conversion into
stimulated Raman radiation was mode-independent by using a single mode ruby laser with which it was shown that the conversion efficiency was the same as a multimode system. It was clear, therefore, that the
anomalous results could not be explained by mode structure and possible effects leading to beam distortion in the Raman active medium were
considered, 17
Chiao showed that the interaction between the high optical field and the medium led to an intensity dependent refractive index which could lead to beam deterioration and self-trapped filaments. The effect was termed self-focusing (see Chapter 3),
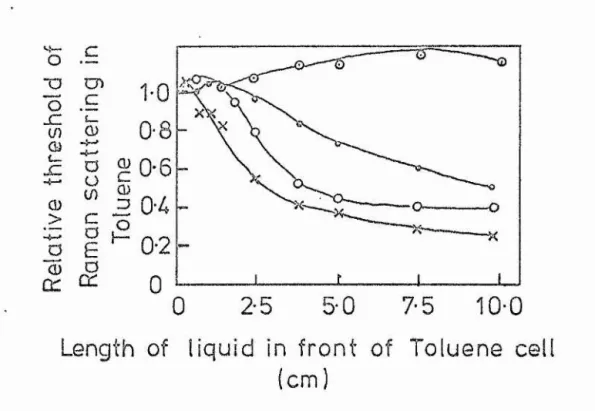
It.was shown by Shen and Shaham^^, by using two cells that the threshold for the generation of stimulated Raman radiation in the second cell was dependent on the length of the first and of the particular
liquid used (Fig 3). This was explained by beam distortion and the multimode theory, A similar set of results was found by Lallemand
19
and Bloembergen , who further showed that the beam breaks into
7-5
10-0
Length of liquid in front of Toluene cell
(cm)
Fig 3 Raman Threshold in Toluene versus
the Cell Length of a Scattering cell
in front of Toluene ceII.The scattering
cell was filled with water, benzene,
acetophenone or nitrobenzene,
o Water, « Benzene, o Acetophenone,
- 26
-index of refraction. It was suggested that the threshold for stimulated Raman was more dependent on the self-focusing coefficient than the
- 27
-CHAPTER 3 NON-LINEAR EFFECTS 3.1(a) Self-Trapping
Because of the high fields produced by Q-switched lasers, non-linearÿ intensity dependent terms must be considered in the interaction of the radiation with the liquid.
The phenomenon leading to a self-trapped beam can be described in terms of refractive index, by an expansion, given by
n = n^ + n^ 3 „1 , 1
together with the interaction of a diffraction limited beam with the non-linear medium.
For a beam diameter D, the beam has an angular divergence given by
e = 1.22A/n oD 3.1.2
If the non-linear term of 3,1,1 increases, the refractive index within the beam becomes such that the angle for critical reflection
is exceeded so the beam ceases to expand. The threshold condition for this to occur has been obtained by Chiao^^ and is given by
R,. = (■irD^/4)(n^E^c/8Tr)>
(X
c/ ,
3.1.33.1(b) Self-Focusing and Self-Trapping
From the simple analysis above it is clear that, at a certain critical power level, the beam is trapped and does not spread, and
2
that the threshold power level decreases with X , For a more detailed treatment of the effect, the following non-linear wave
21
“=28—
V^E “ -y — ( E % =0. 3.1.4
c 9t c 9t
Kelley assumed a linearly polarised wave of frequency w propagating
along the z axis, so that
E = (£/2){E^ expi(kz - wt) + c.c.}, 3*1,5 where E^ is the slowly varying field amplitude.
Substituting 3.1.5 into 3,1,4 and neglecting the third harmonic term then gives
0 Ï 2
2ik oZ + V^E' + 0 I E* 1^' E ’. « ' ' 0 3.1.6
O where Gg' = (3 0 2/4) ,
The term in the second derivative of z is assumed to be small so that we get
2ik H ' + + V^y)E' + .!i^ |E' I^E' = 0 . 3.1.7 o
As a first approximation, transverse E* components are neglected to give the simple solution
E» == exp(i U2 ^ k|E*|^z/n^) . 3.1.8
This equation shows that the non-linearity produces an intensity
dependent phase change. Applying Huygens principle to a uniphase beam, it can be shown that a focusing action is produced^
Assuming that the transverse second derivative of E ’ in 3.1,7 depends upon the axial distance through the variation of intensity
in the exponent 3,1,8, this solution can be used to obtain a
-”29~
^ “ Sfocus = (1/2) ^ (%/"2)/®m'
where a is the transverse radius of curvature of the input intensity and E^ is the peak field value. Equating z_ m focus to the diffraction length an approximate threshold for cylindrical beam trapping is obtained, this is given by
» (1.221)2,/(512 n^’) = (1.221)2,/(2 5 6 1I2 ) . 3.1.9
•This more detailed analysis gives a factor 4 lower in threshold than equation 3,1,3 which was obtained by Chiao's simple analysis. The net focusing distance after correcting for diffraction is given by
W = ( ^/2>(V2’)^ ( \ ’ - > 2.1.10 where « (1,22 )/8a(n2 ’n^)^
2 2
The treatment was further extended by Wang who showed that Kelly's equation 3.1,10 could be written in the form
, = ^ / {P^ - p j ) 3.1.11
The equation has been modified by the introduction of the factor f which is the ratio of the radius of the beam, a, to a characteristic
transverse radius of curvature of the input intensity. Equation 3,1.11 can be written in the form
+ (a/£)
2 _ I
cr
n 2 ^
where a = (|~) (-~ ) \ 3.1.12
This gives the threshold power for the information of filaments in a liquid column of given length. Results confirming 3.1.12 were
22
6
CL 3 o (0 G) i— _c }— v>—o
'oo
cr CD t_ Z3 D " (y> C/O c 13 _Q L_<
(Cell Length)
Y
10 (cm')
Fi g 4(a)
£— CD 5; g "O
o
JZineu „
£ -5
c
o
ëO t~
o
a
2 z § <
cr
t/)
4
0
1 2
3
4
(Cell LengthjY lO'^(cni)
Fig 4(b)
Fi g 4 (a)Plot of the square root of threshold
laser power as a function of inverse
cell length for benzene o , toluene x
and nitrobenzeneo.
- 30
-A1though the threshold for self-focusing is a function of the beam area, that of self-trapping is not. This was experimentally verified by Wang as is shown in Fig 4(b), From these results Wang attempted to make absolute measurements of P but could not check hiscr results because of lack of information on the values of the non-linear coefficients, n^.
From the above, we see that the threshold for stimulated Raman is dependent primarily on the value of n_, rather than Raman gain. For this reason some consideration must be given to these coefficients.
3.2(a) Electrostriction and the Optical Kerr Effect
Since it has been shown in paragraph 3,1 that the non-linear refractive index in the presence of the high optical fields available from Q-switched lasers lead to self-focusing and could lead to a
threshold for stimulated Raman it is necessary to determine the magnitude of the self-focusing coefficient. The two effects causing the
non-linearity are électrostriction and the optical Kerr effect.
23
Shen determined the relative importance of the two effects by use of the Clausius Mossotti relation^^. The change ir refractive
index is given in terms of variations in density. A:, and polarisability, %
(n
An “ (An) + (An) = [M. + % 3.2.1
« P 6n (n 2+2) o o '’L Electrostriction (An)_
'“31“ 2
(-y2 + i 1_ _ 2T a )6p (v^E^) 3.2.2,
y2 a £ y2 /
where the medium only responds to the slowly varying part of the field Shen found that
(An) = k X(|E^) 3.2.3
P P
where k = y^3/8tt n^X 3.2.4
3 is the isothermal compressibility, y = 2ny/9n/9p) and the velocity
V = (pQg)"^ .
Optical Kerr Effect (An)^
The change in polarisability was assumed to come from the orientation of anisotropic molecules and was calculated using the
2^
theory of Langevin ”. Again, the medium only responds to the slowly varying part of the field, and, for a linearly polarised wave, Shen found
(An)g = 2/3 k^XdE^), 3.2.5
where the optical Kerr constant is given by
L = {(n ^+2)(n 2_i)(e+2)/(6+2)2<5-l)](f^,'J 3.2.6 The dielectric constant is e, and 6 is given by the Debye relation
4ïïp
(6-l)/(6+2) = {(e-l)/(e+2) + 3.2.7 where p is the permanent dipole moment of the molecule.
The table below gives the values of optical Kerr constants and electrostrictive constants for a range of liquids.
TABLE X
Electrostrictive coefficients, K , optical Kerr constants K^g and the d.c, Kerr constants, (K,) calculated at the
wavelength of the sodium D line for various liquids « In
calculating these constants, n^ is obtained from the International Critical Tables and g Mnd g from the Handbook of Chemistry and PhysicsÔ All physical constants are taken at 20°C if possible«
LIQUID K X 10P K X 10a (Ki)dc ^ 10 (esu)
Carbon"-” tetrachloride Carbon-disulphide Hexane Cyclohexane m-xylene 1.21 2,53 1.06 1.06 1.20 0.67 32.6 0.45 0.78 7,59 0,74 32.26 0.45 0.74 8.58 Benzene Toluene
Chi o rob en z erie Bromobenzene Nitrobenzene Aniline 1.33 1.25 1.20 1.50 0.92 1.00 5.73 6.55 9.93 14.35 26 0 4 3.22 5.93 7.53 91 91 2560 12.3 Chloroform Acetone Methÿl alcohol Ethyl alcohol Butyl alcohol
- 32
-inverse ratio of their non-linear coefficients.
In practice the interaction between a medium and a giant pulse must be considered and E(r) must be replaced by E(r,t)o The
interaction of a giant pulse of the form
2
E (r,t) = A e t, A E^(r,t) = A e~“ ^ (2A-t), tÿ A with the medium is considered below,
A rough estimate of the magnitude of the two effects can be made by substitution of the above into the driven acoustical wave equation neglecting the transverse variation of Ap, This is valid for
"^2 « 0- * *
r < a and a < 10 . The equation is a linear differential equation whose solution is
An = 1/3 K A e““ . 3.2.8
P P
The total change in refractive index, therefore, is given by the addition of the optical Kerr component. The reorientation time2 ^
% 0
is typically 'V'lO sec so that the Kerr-dependent change in refractive index accompanies the pulse and so we have
An = An + An = {K (1-a^r^) (— )^ + K } E^(rgt), P , Ot p T CX 3.2*9
““1
.
.
33
-focused beam,. The ratio of the two coefficients, is given by P
which must be considered for all conditions of excitation, 3.2(b) Parallel Excitation
With the typical values a=30cm ^, and pulse width 20n sec, the ~2
maximum value of is 10“* K /K^ which indicates that électrostriction can be ignored, Kaiser and Maier , using this system investigated a range of liquids and found that the thresholds of carbon disulphide, benzene, nitrobenzene and toluene were in the inverse ratio of their non-linear Kerr coefficients. Even if a pulse of double the width were used it would still be valid to use the optical Kerr coefficient.
3o2(c) Focused Excitation
If we consider the focusing of a diffraction limited beam, it is well known that the beam focuses to a cylinder whose dimensions are
■FA
D = — na 3.2.11
where n is the refractive index of the medium and a is the diameter of the input beam. It is clear, therefore, that the time response of the medium under these conditions is such that électrostriction cannot now be eliminated, since t = ^ and D can be of the order of a fewp V
-wavelengths. The coefficient R^^ can be expressed in the form
IL = , 3.2.12
“■34-rate of rise of the pulse.
This result will be discussed further in Chapter 5. Direct observation of seIf-focusing using a focused system was observed by
27
Pilipetskii and Rustamov who found that filaments were formed ahead of the lens focus.
Conclusions
From the above we see that an intensity dependent refractive index leads firstly to self-trapping followed by self-focusing which produces filaments inside the beam envelope where the beam intensity can be very large. It would appear that, with unfocused excitation, the threshold for stimulated Raman corresponds to the self-focused threshold due purely to the index change caused by the optical Kerr effect. It is not clear what dictates threshold in a focused excitation system. The dynamics of filament formation have not been studied in any great
28
“35-
CHAPTER 4
STIMULATED AND SPONTANEOUS RAMAN SPECTRA (EXPERIMENTAL ASSESSMENT) *
4ol Introduction
Papers published up to October* 1964 indicated that many of the features of the stimulated Raman effect were not understood.
One of the reasons for this was that thresholds for the effect could not be theoretically determined because of the lack of data on the line widths of spontaneously emitted Raman lines and the scattering cross
sections needed for calculation of Raman gain coefficients.
The siinultaniety of harmonic generation could not be explained on the basis of stimulated Raman gain using an iterative generation scheme.
It was proposed therefore to investigate stimulated Raman by
setting up both stimulated and normal Raman spectrometers* so that all the information necessary for a theoretical analysis would be available, The projected investigation was therefore in two parts* A* the study of stimulated Raman spectra and B* normal (spontaneous) Raman spectra.
The aim of the investigation of stimulated Raman spectra was to construct a spectrometer based on a Q-switched ruby laser and to
develop methods for measuring thresholds for a range of liquids and to compare the thresholds obtained with the predicted values calculated from spontaneous scattering data. It was also proposed to investigate the possibility that stimulated Raman spectra may be iteratively
“36“
To study spontaneous Raman spectra a conventional Raman spectrometer was to be constructed to assess the possibility of
measuring cross sections and line widths with a photo-electric detection system in conjunction with a CW gas laser.
Since the investigation started with an empty room and this was an ambitious investigation it was decided to pursue both projects with the proviso that the investigation of spontaneous Raman spectra would be suspended if either it was no longer possible to complete it in the available time or if it was no longer worthwhile in the light of
developments in the field, A , Stimulated Raman Spectra
The ruby laser for the investigation was purchased from Barr and Stroud in 1965. A rotating prism Q-switched unit was chosen as this generated a slow pulse (typically 40 nanoseconds) suitable for the proposed time resolution experiments. It was specified that it should produce pulses ^-20 Mwatt. Before setting up any experiment it was
necessary to develop instrumentation and techniques to align and measure the power output of the device. These are discussed below.
4.2(a) The Ruby Laser
- 37
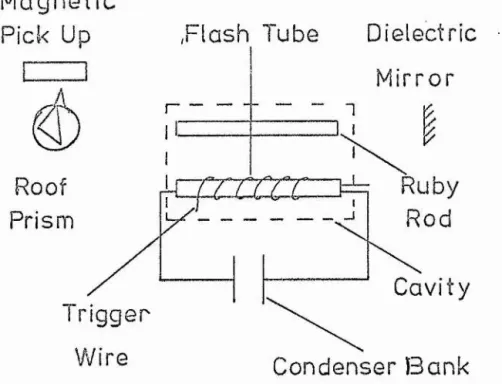
-with screws giving a three dimensional movement. The cavity mirrors are (a) a roof prism which is rotation at 15*000 rpm and a dielectric mirror with a reflectivity of 30% at 694sX , The ruby rod is cut at 90°
to the crystal axis so that the output is plane polarised.
The ruby can be operated in either the non Q-switched or Q“switched modes by locking the prism in the aligned position or permitting it to
rotate at 15*000 rpm. Triggering in both cases is effected by the application of a hgih voltage pulse to a trigger wire wound round the flash tu6e. In the Q-switched case the trigger pulse is generated by a pointer mounted on the rotating prism passing a magnetic pick-up and the
system is synchronised such that the high Q* lasing position occurs during the peak of the flash tube pump pulse.
The unit is mounted on an optical bench 2 metres long which is itself mounted on a heavy iron girder. This ensures a fixed calibrated reference axis with a stable mounting. A schematic diagram of the system is shown in Fig 5 and the actual unit can be seen in Plate 1, 4.2(b) Output Pulse Characteristics
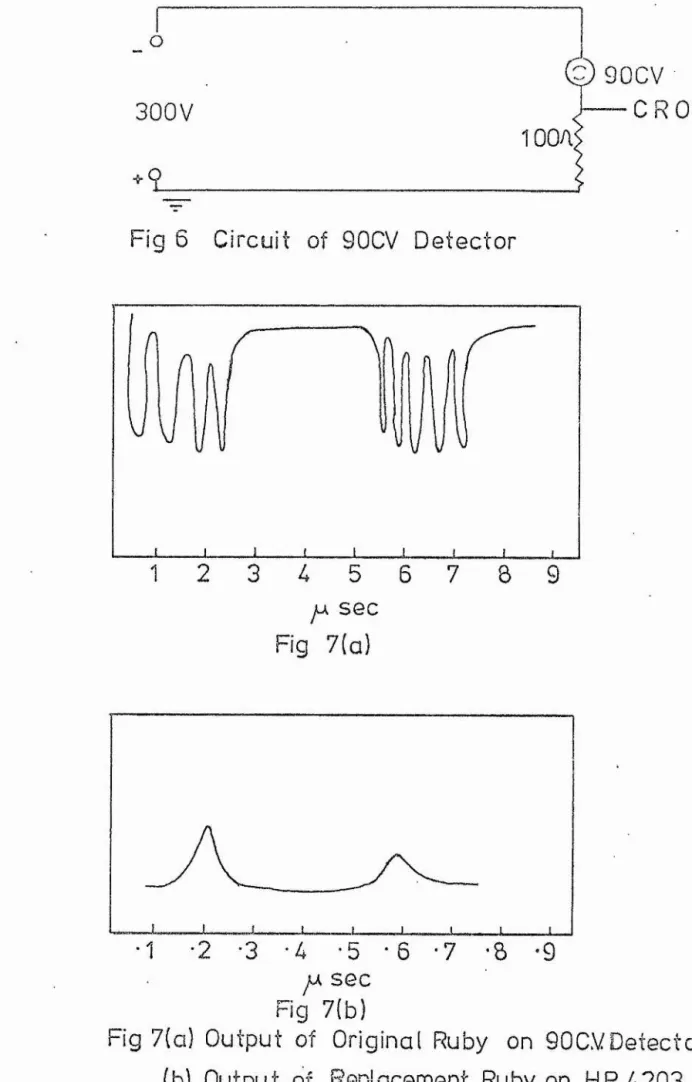
The laser was aligned by using the autocollimato^ described in section 4.3, A photodetector (90 CV) was used to investigate the beam scattered off a block of MgO, The response-time of the photodetector was reduced by operating it at 300 volt in the circuit shown in
Magnetic
Pick Up
,Flash Tube
Dielectric ■
Mirror
Ruby
Rod
Roof
Prism
Cavity
I rigger
Wire
Condenser Bank
Q) m 3
(S <D g
(D
-Pc5
I—I
o
300V
?) 90CV
— CRÛ
iooa
:
ig 6 Circuit of 90CV Detector
1 2 3 - C 5 6 7 8 9
yU sec
Fig 7(a)
— ^ ^ ^ ■ ■■— ^ -I ^ - ri-TIMill» nu f . i -r -III A j
1 -2 -3 -4 -5 -6 -7 8
jj.
sec
Fig 7(b)
- 38
-the rotating prism removed suggesting that -the gain was too high to
produce a Q-switched pulse output® Examination of the ruby rod showed discontinuities which would lead to an increased beam divergence.
The ruby was returned to the makers who, after some time^ agreed with our findings and replaced it. The new rod was found to operate
satisfactorily with a typical pulse output of the form shown, Fig 7(b) taken with a HP4203 photodiode as discussed in section 4.5.
4.3(a) The Autocollimator
The ruby rod and the mirror system must be aligned to within a few seconds or arc. To do this an autocollimator was designed and
constructed. The unit is shown in Fig 8,
The light source S, is a 50 watt Phillips projection lamp which focuses onto the pin-hole, P. The pin-hole is at the focus of the
lean, L so that a collimated beam is produced whose diameter is variable by means of the iris, I. The parallel beam then passes through a beam splitter over which is mounted a telescope adjusted to receive parallel light. Light from the. autocollimator striking two reflecting surfaces passes back into the field of view of the telescope and the separation of the two spots gives a measure of their angular orientation with
respect to the beam. In operation a reference beam is set up by reflecting the beam back along the axis into the field of view of the telescope.
tjj Q. O O
U1
ÜJ
00
en
00
-J
Cl
cr
o
CD CL
'“39““
4»3(b) Autocollimator Resolution
The beam divergence of the unit constructed was measured over a distance of 5 metres and found to be 6 mins„ of arc. This was checked by using the mirror mount with the autocollimator and finding the
rotation of a single control which moved the spot one diameter.
The control had to be turned & of a turn which corresponded to an angular rotation of 4 mins, of arc. Since the smallest screw movement the
operator is capable of making corresponds to approximately one fifth of the spot diameter; the collimator is capable of alignment within the capabilities of the adjustment controls,
4,3(c) Alignment Technique
The procedure for aligning the ruby laser is as follows,
1, With the iris aperture set at minimumg the collimator is aligned along the optical bench by means of the adjustment screws until the beam passes through a 2 mm pin-hole over the one metre length of bench that is to contain the ruby laser cavity,
2, The reference beam is then formed by means of the roof prism which is adjusted with respect to orientation and height until the
collimator beam striking centrally on the roof edge is reflected back through the pin-hole placed immediately in front of the collimator. The prism is then locked in this position.
3, The ruby unit is then placed on the bench and the beam is aligned centrally on the ruby face nearest the collimator,
—40—
by the adjustment screws of the ruby laser head until the spot reflected
from the front surface of the ruby coincides with the reference spot in the field of view of the telescope.
5, The iris aperture is now increased and, if accurate alignment has been achieved; a red circular spot of the same diameter as that of the ruby rod should be visible on a white card inserted near the roof prism. If this is not the case, further alignment adjustments are necessaryo
6, The dielectric mirror is then inserted and after aligning it such that the beam is centrally placed on the mirror surface and the reflected spot is coincident with the reference spot, the system should be in a lasing condition.
7, The ruby unit is then tested in this non Q-switched arrangement and should lase at the minimum voltage of the condenser bank*
8^ The prism is released from its locking screw and the system may now be operated in the Q-switched mode,
4,4(a) The Rat's Nest Calorimeter
To measure the power from the laser it is necessary to measure the energy output in the Q-switched pulse. Following a paper by
29
Baker a bolometer unit was constructed.
In this system the beam energy is trapped and absorbed in a bundle of fine insulated copper wire termed a Rat*s Nest, The change in
-41-chosen because of its advantages over others in which the energy is
absorbed in a liquid or a solid and the temperature rise is measured
by means of a thermocouple. These systems, apart from problems of measurement of absorption coefficient and heat capacity, suffer from the defect that thermal equilibrium must be reached before any measurement is made and as a result errors are caused due to loss of energy during this period and the final temperature is a function of the heat loss. In using the Rat's Nest there is no need to wait for equilibrium. That this is so is shown by Baker's analysis which is given below.
Construction
The Rat's Nest consists of approximately 1,000 ft. of fine insulated copper wire of resistance lOOOQ (measured on an avometer) contained in a silvered beaker. The disturbance caused by air effects is avoided by covering the end of the beaker with a glass plate sealed on with araldite. The measurement circuit is a conventional Wheatstone bridge and to maintain thermal equilibrium two of the bolomecers are used in the measurement arm* The two units are contained in a metal cylinder and are isolated from the walls by means of a plastic foam cushion. See Fig 9.
4,4(b) Theory
Foam Cushion
Silvered Beakers
lass
Window
'*42'=”
change in resistance of an element of wire, AR % is given by ARg* = aR^'E'/CA.Z M'C) , 4.4.1
where is the resistance of the element^ E® is the energy absorbed^ M® is the mass of the element, C is its specific heat, and a the
temperature coefficient of resistance. The total resistance change is summed over all elements of the wire.
If the wire is of uniform cross section^ then we have
R^'/M'e Rq/M , 4.4.2
where M are the corresponding total resistance and total mass of the wire. The total change in resistance is therefore
AR ^ aR^/(4.2 MOTE® - aR^/(4.2 MC) E, 4.4.3 where E is the total energy absorbed.
The energy dumped into the Rat®s Nest is therefore given by E = (4.2 MC/aR)AR , 4.4.4
where MG is the thermal capacity of the wire. 4.4(c) Corrections
Since some of the incident energy is reflected back by both the glass plate and the wire itself, a correction must be ^\ade. Baker found this to be 28% and this figure has been used as being probably accurate enough for our purposes. The wire is covered in a layer of Lewmex insulation whose heat capacity is not known so that the value of MC was determined experimentally by discharging a condenser of known
energy into the system and measuring the temperature rise. The final expression obtained from 4.4.4 by substituting appropriate values is