Determination of Single-Cell Oxygen Consumption
with Impedance Feedback for Control of
Sample
-
Probe Separation
Damon M. Osbourn, Richard H. Sanger, and Peter J. S. Smith*
Program in Molecular Physiology, Marine Biological Laboratory, BioCurrents Research Center, Woods Hole, Massachusetts 02543
The ability to measure chemical gradients surrounding single cells provides novel insights into several areas of cell dynamicssparticularly metabolism. Detection of meta-bolic oxygen consumption can be achieved from a single mammalian cell using a modulated amperometric sensor in a self-referencing mode. To date, however, apart from visual cues, we do not have a reliable and cell-compatible method for determining and stabilizing the position of such probes. In this paper, we report on having success-fully measured the increase in the uncompensated resis-tance of an electrochemical cell upon approach to single, living, biological cells, while simultaneously measuring the metabolic oxygen consumption. This was accom-plished by applying an ac and a dc excitation signal to the electrode. The applied ac waveform was a 100-kHz sine wave with an amplitude of 10 mV rms, while the dc voltage applied was-600 mV. The two signals were shown not to interfere with one another. Furthermore, it is shown that the sample-probe distance can be measured for approach to single cells on the order of 10-15-µm diameter and 5-µm height, with 100-nm resolution.
Several groups have previously demonstrated that electro-chemical microsensors have the required properties for successful single-cell studies. In addition to good spatial resolution, these microsensors exhibit high temporal resolution enabling the investigation of relatively fast processes. For example, manually positioned carbon-fiber sensors have been employed to study the time course of the release of neurotransmitters.1,2With the same
method, hydrogen peroxide flux and corresponding oxygen concentration changes, from a single human fibroblast in response to mechanical stimulation, have been monitored.3Oxygen
con-sumption and photosynthetic production at substructures of cells have been demonstrated with isolated retinal photoreceptors4and
the algaSpirogyra greveilina.5 It has also been shown that the
modulation of neuronal oxygen flux can be measured using electrochemical microsensors.5
To measure oxygen flux in the latter experiments,4,5 the
electrode was operated in a modulation format, stepping over a known distance (∆x) usually 10-20µm, between near and far positions with respect to the cell at ∼0.3 Hz. The procedure, termed self-referencing, has been previously described for both potentiometric and amperometric sensors.6,7 This technique is
particularly useful in measuring small extracellular gradients, such as oxygen consumption, in the presence of a large background concentration. The electrode spends ∼1.5 s at each position, allowing a large number of data points to be averaged, and then the difference in signal between the two positions is recorded. Because this is a relatively slow technique, error due to noise and drift is reduced and small differences in current of tens to hundreds of femtoamperes can be determined. The difference current obtained by an electrode with a step distance ∆x
represents the slope of the extracellular diffusion gradient (∆C/∆x) created through the metabolic processes of the cell. Alternatively, this gradient can be represented as a flux (J, pmol/cm2‚s) through application of Fick’s first law,-J
(x,t))
(D)δC(x,t)/δx, whereDis the diffusion coefficient of the
electro-active species.
Diffusion-based signals detected by the self-referencing tech-nique are inevitably distance dependent. This is a result of the gradient created by the cell as it releases analyte into, or consumes analyte from, the bulk solution. The placement of the electrode near pole relative to the cell has an effect on the measured concentration change and thus flux. Although this distance-dependent variation does not affect the determination of cellular responses to perturbation in a qualitative fashion, it does prevent the direct comparison of measurements taken at multiple points or multiple cells. Presently, electrode positioning is achieved by manually adjusting the probe tip in the cellular near-field. This has problems. First, it is difficult and requires operator experience to avoid touching the cell. Second, the measurements are limited to thex-y plane where the high contrast boundary of the cell can be seen. Third, it is not possible to observe small changes in * To whom correspondence should be addressed. Phone: (508) 289-7241.
E-mail: psmith@mbl.edu.
(1) Cahill, P. S.; Walker, Q. D.; Finnegan, J. M.; Mickelson, G. E.; Wightman, R. M.Anal. Chem.1996,68, 3180-3186.
(2) Bruns, D.; Jahn, R.Nature1995,377, 62-65.
(3) Arbault, S.; Pantano, P.; Jankowski, J. A.; Vuilaume, M.; Amatore, C.Anal. Chem.1995,67, 3382-3390.
(4) Malchow, R. P.; Land, S. C.; Patel, L. S.; Smith, P. J. S.Biol. Bull.1997, 193, 231-232.
(5) Land, S. C.; Porterfield, D. M.; Sanger, R. H.; Smith, P. J. S.J. Exp. Biol.
1999,202, 211-218.
(6) Smith, P. J. S.Nature1995,378, 645-646.
(7) Smith, P. J. S.; Haydon, P. G.; Hengstenberg, A.; Jung, S. K.Electrochim. Acta2001,47, 283-292.
Anal. Chem.2005,77,6999-7004
thezaxis of the electrode position that may arise while adding or removing solution to the sample dish. Fourth, the resolution of electrode placement is limited to 1 µm, even for experienced analysts. Finally, the repeatability of electrode placement cannot be determined.
For these reasons, impedance measurements of the electro-chemical cell will be used as positional feedback for amperometric electrodes. Previous uses of an impedance feedback approach have been largely limited to nonbiological systems with two exceptions. Kashyap and Gratzl employed impedance feedback for the placement of large (g250 µm) electrodes next to a monolayer of cells on a solid support.8In this report a 20-mV ac
signal was applied to large electrodes at a frequency of 250 Hz.8
Since the solution resistance does not change, the resistive component of the impedance can be related to the proximity of obstructions in the immediate vicinity of the probe tip. This method reports a dependence of the distance measurement on the size of the probe tip. A maximum distance of 300µm was measured for a 250-µm probe, while a maximum distance of 400µm was measured for a 500-µm probe. In this application, it is not obvious if the change in the ac signal is due to the cell monolayer or tp the solid support. Alpuche-Aviles and Wipf also detailed the use of impedance feedback, using 2- and 10-µm platinum disk electrodes with a 14-mV ac signal at<100 kHz9for
scanning electrochemical microscopy (SECM) of electrode sur-faces. More recently Baur and co-workers10reported SECM of
PC-12 cells employing 5-µm carbon-fiber electrodes. We report the use of impedance feedback, in a manner similar to that reported by Wipf and co-workers, for single point measurement of extracellular gradients. By employing the self-referencing technique during our measurements we are able to significantly stabilize the determination of oxygen gradients as well as sample -probe separation, allowing constant positional feedback.
EXPERIMENTAL SECTION
Solutions and Reagents.Phosphate-buffered saline (PBS) with Ca2+ and Mg2+, trypsin-EDTA, Roswell Park Memorial Institute medium (RPMI) 1640, penicillin-streptomycin, L-glutamine, and fetal calf serum were obtained from Invitrogen (Carlsbad, CA). Potassium chloride, potassium cyanide, calcium chloride, glucose, pyruvate, 4-(2-hydroxyethyl)-1-piperazineethane-sulfonic acid (HEPES), and cellulose acetate were obtained from Sigma (St. Louis, MO). All solutions were prepared in filtered, deionized water (Barnstead, Dubuque, IA) unless otherwise noted. Potassium cyanide was prepared as 3 M in 1 M NaOH. Cellulose acetate was prepared at 6 wt % in acetone.
Cell Culture.The culture medium consisted of RPMI 1640, buffered with 10 mM HEPES, and supplemented by 10% fetal calf serum, 2 mML-glutamine, 100 units/mL penicillin, 100 µg/mL streptomycin, 1 mM sodium pyruvate, and 50µM 2-mercapto-ethanol.11 Frozen cells in culture media with 10% dimethyl
sulfoxide were thawed in a 37°C water bath and immediately added to 10 mL of culture media in a 100-mm culture dish. The dish was incubated for 5 days at 37°C with 5% CO2. The cells
were then rinsed with PBS, 4 mL of trypsin solution was added to the dish, and the cells were incubated for 5-10 min at 37°C. The cells were suspended in solution, and 1 drop was added to each 35-mm culture plate containing 2 mL of culture media. INS cells on 35-mm culture plates could be kept for 3-6 days depending on density. Just prior to the experiments, the cells were rinsed with PBS and 2 mL of 4 mM glucose in PBS was added to the dish. To stimulate the cells, 2 mL of 16 mM glucose in PBS was added to the dish.
Self-Referencing Electrode System. The electrochemical instrumentation was constructed around an Zeiss IM 35 inverted microscope mounted on a vibration isolation table. A three-electrode potentiostat was mounted on the microscope, and electrode position was adjusted by anx-y-zpositioner (Newport) driven by size 23 stepper motors under computer control (Bio-Currents Research Center, Woods Hole, MA). This arrangement provided submicrometer resolution of electrode placement in either an oscillating or a static mode The electrode self-referencing step function was computer controlled at a 10-µm step size in the
zaxis. Commands to lower the electrode to the bottom of the Petri dish were given manually, while monitoring the ac signal. At large distances, the difference current in the ac signal was zero. When the electrode initially showed a response in the ac difference current, it was positioned in the x-y plane over a cell. For experiments with a quantified sample-probe separation, an approach curve was performed with 0-µm separation being the point of contact with the plasma membrane. Experiments were then carried out on adjacent cells. For experiments with qualitative determination of position, the electrode was adjusted to∼5µm as determined visually, and the ac signal was used to maintain a constant sample-probe separation. The electrode position was maintained by monitoring the ac signal and manually sending commands to the stepper motors to make 100-nm corrections as necessary. In all experiments, the sample-probe separation was verified to be free of artifactual signals in the faradaic response due to diffusion boundary effects. This was performed by position-ing the electrode above the Petri dish, without a cell, at the same ac difference current used to collect faradaic data. If the electrode position showed a nonzero response in the faradaic difference current then the sample-probe separation was increased. Elec-trodes were screened for quality of the ac signal. ElecElec-trodes providing adequate signal-to-noise ratio to determine 200-nm steps at a distance 1µm further than the point at which diffusional boundry effects were observed were used. This distance was
∼5µm under most experimental conditions.
Data were acquired with a 16-bit a/d converter, and the electronics were built in-house. Data points were acquired at 1000 Hz and averaged to 0.3 Hz. The entire assembly was housed within a Faraday cage, and all software control and data acqusition was developed using Visual Basic. A platinum auxiliary electrode was employed, and all voltages are reported against a Ag/AgCl reference electrode. Representative data from a minimum of three replicates are shown.
Working Electrode Manufacture. Oxygen measurements were made with platinum disk electrodes as previously de-scribed.12 A 1-cm segment of 25-µm Pt wire (Alfa Aesar, Ward
Hill, MA) was attached to a 2.5-cm length of stainless steel (World (8) Kashyap, R.; Gratzl, M.Anal. Chem.1999,71, 2814-2820.
(9) Alpuche-Aviles, M. A.; Wipf, D. O.Anal. Chem.2001,73, 4873-4881. (10) Kurulugama, R. T.; Wipf, D. O.; Takacs, S. A.; Pongmayteegul, S.; Garris,
P. A.; Baur, J. E.Anal. Chem.2005,77, 1111-1117.
Precision Instruments, Sarasota, FL) using silver epoxy (Epoxy Technology, Billerica, MA). The Pt wire was then etched to a fine taper in 3 M KCN solution, using a waveform generator set at 6 V at 1800 Hz. The electrode was then carefully inserted through a pulled glass capillary with a 3.5-µm i.d. and 5-µm o.d. at the tip, such that a short segment of platinum protruded. The stainless steel electrical contact was then glued (QuickTite, Avon, OH) to the glass capillary for stability. A drop of UV resin (Norland Products, Cranbury, NJ) was then placed in a second pulled capillary, with a large opening, so that the electrode could be advanced into the resin reservoir. UV resin is allowed to fill the tip of the working electrode. The electrode was then cured under UV light and allowed to sit overnight. The electrode was then etched in 3 M KCN solution at 4 V at 180 Hz with a+2 V offset. This produces an exposed 2-µm platinum disk. A drop of 6% cellulose acetate solution was then drawn across the surface, and the electrode sat overnight.
Positioning Feedback.The ac excitation signal (10 mV at 100 kHz) was delivered directly to the potentiostat from the lock-in amplifier (LIA; EG&G Instruments, Wellesley, MA). The resulting current through the electrochemical cell was passed through thei-Econverter of the potentiostat. The output signal of the potentiostat was then split. The signal was sent directly to the LIA, which measured the rms magnitude of the voltage at 100 kHz and returned the value to the data acquisition software. Additionally, the signal was sent to an eight-pole low-pass Bessel filter set at 10 Hz and then sent to the data acquisition software to record the dc faradaic response.
RESULTS AND DISCUSSION
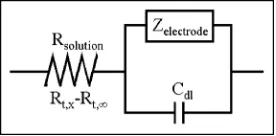
Factors Contributing to the Measured Impedance. To maintain consistency in the positional information and to verify that the impedance measurement can identify biological samples, it is important to consider the factors affecting the ac signal. The simple Randles cell model shown in Figure 1 is used to describe the electrochemical cell. In this diagram, the electrode surface is viewed as an impedance in parallel with the double layer capacitance. The capacitance of the electrode decreases linearly with the electrode surface area. Since the capacitive reactance (in ohms) of the double layer isX)(2πfC)-1, wherefis the ac
frequency (in Hz) andCis the capacitance (in F), it is observed that the smaller the electrode, the larger the capacitive reactance for a given frequency. This requires the use of high frequencies to capacitively couple across the electrode surface. Since the
frequency of the ac signal is limited by the electronics of the LIA, we are not able to completely couple across the electrode surface and some portion of the current still flows through the electrode impedance. While the ac signal is stable under these conditions for multiple experiments, electrodes with a higher capacitive reactance can be affected by changes in the electrode impedance due to faradaic currents. In this work, changes in the solution resistance as small as 50 Ω are easily measured. The overall change in solution resistance is highly dependent on the electrode geometry. A recessed 2-µm disk electrode would show a change in resistance of 10 kΩover the approach curve, while a flush 2-µm disk electrode would show a change of less than 1 kΩunder the same conditions (Figure 2).
Figure 2 details a series of experiments to determine what conditions affected the change in impedance upon approach to a target, in this case a 100-µm glass bead. Since the current is flowing through a parallel impedance and capacitance, and the applied potential is known to affect these parameters, the response on approach versus applied ac and dc potential was determined. The ac response showed a difference in the overall impedance of the electrochemical cell with increasing applied potential; however, there was no effect on the change in solution resistance during approach (Figure 2a). This is an important illustration that the change in solution resistance upon approach is not due to changes on the electrode surface.
The contribution of ionic strength to the approach curve is shown in Figure 2b. Here the panels are scaled the same and the progression is 100 mM CaCl2, 100 mM KCl, and 10 mM KCl. This
shows a correlation between the ionic strength and the change upon approach, with the lowest ionic strength giving the highest change in resistance. It is hypothesized that since the ions are not migrating in the oscillating field, the density of charge carriers is more important than the mobility of the individual charge carrier. This is further confirmed in Figure 2c where a progression in temperature is illustrated. The approach curves represent 23, 30, and 37°C, from left to right. There is no correlation between the magnitude of change in solution resistance and temperature, although the overall impedance of the electrochemical cell decreases with increasing temperature. If the ions were migrating in the field, one would expect to see a dependence equivalent to the increase in mobility with increasing temperature.
Finally, the effect of electrode radius for disk electrodes of 2-, 3-, and 25-µm diameters is shown in Figure 2d. Surprisingly, the change in resistance decreases with increasing diameter, and the approach curve does not seem to react to the surface at significantly larger distances. All electrodes began to show a change in resistance at∼35µm.
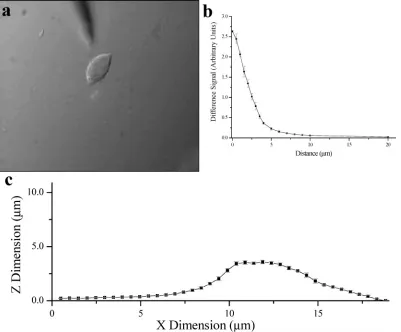
Impedance Feedback for Single-Cell Approach.Figure 3a shows a picture of the electrochemical probe close to an immortal-ized insulin-secreting cell (INS). The cell is approximately 5µm high and 10µm×15µm wide. The electrode, positioned above the cell, is a 2-µm recessed Pt disk with an insulator o.d. of
[image:3.612.106.244.40.108.2]∼5µm. Figure 3b shows the difference signal from the output of the LIA as the modulated electrode approached the cell. The error bars represent the standard deviation of 30 data points collected for each position over 1 min. To determine whether this technique could differentiate between the cell and the bottom of the dish, the electrode was held at a constant height and moved in 0.5-µm
steps across the cell (Figure 3c). Not only was a height difference measured between the cell and dish but the line scan rendered accurate cell dimensions.
One benefit of this technique is that it allows the sample -probe separation to be maintained by one of two methods. First, approach curves can be used to quantitatively determine the feedback signal as a function of distance from the target. The second method is to adjust the electrode to an arbitrary position close to the cell and then use the ac signal to verify that all measurements are taken at the same distance. Although the second method does not quantitatively determine sample-probe separation, it does maintain consistency between multiple mea-surements and ensures that the sample-probe separation is the same throughout the experiment. All reported distances were calibrated against approach curves.
Simultaneous ac and dc Measurements.The next concern was interference between the ac measurement of the impedance of the electrochemical cell and the dc measurement of the reduction of O2. To evaluate the effect of the ac waveform on the
faradaic response, cyclic voltammetry was performed without the ac signal (Figure 4a) and with the ac signal (Figure 4b). It was obvious that the magnitude of the ac current obscured this faradaic current. However, ac and dc signals were easily separated, and
Figure 4c shows the cyclic voltammogram after passing the signal through an eight-pole Bessel filter at 10 Hz.
Simultaneous measurements of the impedance of the electro-chemical cell and oxygen consumption of a single INS cell are shown in Figure 4d. The electrode was manually positioned near a cell where the measured difference current from the ac signal corresponded to a 5-µm sample-probe separation according to the approach curve. The upper trace is the positional feedback on the right axis, and the lower trace is the oxygen flux on the left axis. The negative oxygen flux indicated a consumption of oxygen by the cell and diffusion of oxygen from the bulk solution. Upon increasing the glucose concentration from 4 to 10 mM, an increase in oxygen consumption was observed. This would be consistent with the increase in respiration occurring with cell stimulation and insulin release.13The positional data indicated a
shift in the electrode position relative to the cell when glucose solution was added. This change in signal represented a move-ment of∼300 nm. Controls taken in bulk solution did not show a change in signal when glucose was added. During the experiment, there was also a gradual shift in the sample-probe separation, which was corrected at 33 min by a command to move the stepper
[image:4.612.73.544.35.357.2](13) Porterfield, D. M.; Corkey, R. F.; Sanger, R. H.; Tornheim, K.; Smith, P. J. S.; Corkey, B. E.Diabetes2000,49, 1511-1516.
Figure 2. Factors contributing to the measured change in impedance. All data are for approach to a 100-µm glass bead. (a) Changes in applied ac potential do not affect the change in impedance. The approach curves represent (2) 10, (O) 25, and (b) 50 mV rms. Although the
motor in thezaxis by 200 nm. This drift could represent either instability in the electrode position or a change in the cell dimensions during vesicle fusion. It is important to note that a related shift in the faradaic current is not observed. Using impedance feedback to maintain electrode position makes it possible to maintain the electrode position with enough resolution to prevent artifactual changes in the measurement.
[image:5.612.109.510.40.372.2]With the ability to set the sample-probe separation at a known distance, it is possible to take measurements at different points on a cell and directly compare the data. When INS cells are labeled with a mitochondrial membrane potential dye and viewed under a microscope, the cell is seen to have light and dark regions (data not shown). The dark regions have a lower density of mitochon-dria due to the relatively large nucleus of the cell. Figure 5 shows
Figure 3. Impedance feedback for sample-probe separation from single INS cells. (a) Picture of a single INS cell with a Pt disk working electode∼5µm above the focal plane. (b) Approach curve showing self-referenced ac signal as the working electrode was brought toward an INS cell. The dc offset was 0 V, ac waveform was 10 mV rms at 100 kHz, and the working electrode was an∼4-µm recessed, 2-µm Pt disk. (c) Line scan of an INS cell, with 500-nm steps at a constant height.
[image:5.612.107.510.427.575.2]the measurement of oxygen flux from single INS cells before and after glucose stimulation. The first cell had a centrally located nucleus, and measurements were taken at opposite poles of the cell where mitochondrial density was highest. The data in Figure 5a and b are consistent with each other and with the data in Figure 4d. Alternatively, Figure 5c and d shows a cell with a high density of mitochondria at one pole (Figure 5c) and the nucleus located on the opposite side (Figure 5d). The data in Figure 5c are similar to that in Figures 5a, 5b, and 4d while the data in Figure 5d are dramatically different. Even after stimulation, the oxygen flux near the nucleus is approximately the same as the prestimulated mitochondria rich location. This result is not surprising as respiration is the major oxygen sink in the cell and the nucleus will, to some extent, obscure oxygen diffusion to mitochondria. In conclusion, the application of impedance feedback for determining and maintaining sample-probe separation during electrochemical measurements, in this case self-referencing data collection from single living cells, will provide a significant improvement in the reliability of data. First, impedance feedback provides a means to identify the point at which an electrochemical measurement is made. In its simplest form, there is no need to quantitate the sample-probe separation. Rather, the probe can
be set at a specific distance corresponding to a measured impedance and then the placement of the probe can be monitored to ensure that the distance remains constant over the course of the measurement, or during subsequent measurements. Alterna-tively, by performing an approach curve to quantitate the positional dependence of the measured impedance, the sample-probe separation can be determined within 100 nm. Second, the difficulty experienced in manual positioning of electrochemical probes is alleviated, allowing reproducible spacing of the probe relative to the sample in all three axes. Finally, the sample-probe separation can be stabilized to account for perturbations to the system or volume changes in the biological cell.
ACKNOWLEDGMENT
We thank George Holz for providing INS-1 cells. This work was supported by NIH NCRR P41 RR001395.
Received for review February 22, 2005. Accepted August 3, 2005.
[image:6.612.105.508.40.263.2]AC050326W