Determinants of home range and territory size in coral reef fishes
190
0
0
Full text
(2) DETERMINANTS OF HOME RANGE AND TERRITORY SIZE IN CORAL REEF FISHES. Thesis submitted by Melissa Cowlishaw BSc (Hons) University of Queensland in March 2014. For the degree of Doctor of Philosophy in Marine Biology within the School of Marine and Tropical Biology James Cook University. i.
(3) Acknowledgements Firstly I would like to thank my supervisors Professor Geoff Jones and Professor Mark McCormick for their guidance and support. Thank you to Dr Maya Srinivasan for assistance with statistics. Thanks to the staff at the Lizard Island Research Station for their assistance and help over the years. The research station is wonderful place to say and the facilities are a testament to the hard working staff. Thank-you to my friends, Erin Smith, Adam Mills, Rebecca Silcock, Matene Ackfun, Kate Winters, Dr Naomi Gardiner and Rob Shillam who have been wonderful assistants in the field. I am grateful for your smiling faces, persistence, initiative, skill and commitment. I must thank my wonderful family and friends who have provided unconditional support and encouragement throughout the course of my PhD. Finally I would like to extend my sincerest appreciation to my loving husband Rob, without him much of this research would not have been possible, and for that reason this thesis is dedicated to him.. ii.
(4) Statement of Contribution of Others Nature of Assistance Intellectual Support. Contribution. Name. Data Analysis. Professor Geoff Jones. Statistical Support. Dr Maya Srinivasan Mr Robert Shillam. Cartography. Spatial Data Centre - Great Barrier Reef Marine Park Authority. Financial Support. Data Collection. Field Research. Professor Geoff Jones. Stipend. Australian Postgraduate Award. Research Assistance. Ms Erin Smith Mr Adam Mills Ms Rebecca Silcock Mr Matene Ackfun Ms Kate Winters Dr Naomi Gardiner Mr Robert Shillam. This research presented and reported in this thesis was conducted in compliance with the National health and medical Research Council Australian Code of Practice for Care and Use of Animals for Scientific Purposes, 7th Edition, 2004 and the Queensland Animal Care and Protection Act 2001. The proposed research study received animal ethics approval from the CU Animal Ethics Committee Approval Number #968.. iii.
(5) Abstract Most animals limit their daily movements to a familiar space known as a home range. However, some animals may also defend part or all of the home range, with the defended portion termed a territory. The twin concepts of home range and territory define an individual’s use of space. The determinants of home range and territory size are known to be complex. Body size, diet and food availability can set the minimum area required to meet metabolic demands, for both home ranges and territories. However, population density and interactions with other species may constrain the size of defended areas. Coral reef fishes typically have relatively small home ranges and are also considered to be highly territorial. However, patterns in the use of space are highly variable and the differing determinants of home range and territory size are poorly understood. An understanding of the ecological factors that govern an individual’s use of space is critical, not only to understanding the evolution of behaviour, but also provide information on how best to manage species in changing environments. The overall aim of this thesis was to increase our empirical and theoretical understanding of the determinants of home range and territory size in coral reef fishes. I applied both comparative and experimental approaches to generate and test hypotheses concerning a range of factors affecting both home range and territory size in reef fishes. In the comparative studies (Chapters 2 and 3), the goal was to extend the taxonomic data-base to explore the correlates between both home range and territory size, and the factors theory predicts to be important, including body size and trophic status. In addition, I focussed on factors that may specifically apply to coral reef environments such as depth, coral cover and habitat complexity. The experimental studies focussed on the potential roles of food availability and local population density as determinants of territory size in an herbivorous damselfish (Chapter 4) and butterflyfishes (Chapter 5). In Chapter 2, I compared home ranges sizes within and among 24 species from 10 commonly present families of coral reef fishes, representing different body sizes, trophic groups and local habitats at Lizard Island (Great Barrier Reef). Home range sizes varied from 0.5 m2 in the territorial damselfish Pomacentrus chrysurus to 350 m2 in the butterflyfish Chaetodon melannotus, with an overall average of approximately 62 m2. Home range sizes differed among the families studied, being highest in the. iv.
(6) butterflyfish (Chaetodontidae), emperors (Lethrinidae) and rabbitfishes (Siganidae), and lowest in the damselfishes (Pomacentridae). This appeared to reflect both trophic position (with home ranges largest in corallivores, macro-carnivores and roving herbivores, and smallest in planktivores), and body size (with home ranges larger for typically larger species). Within species, home ranges were commonly found to increase with body size and proximity to the substratum and to decrease with topographic complexity. However, there were no general rules and much of the variation in home range size among species and individuals was unexplained. The results confirm that home range sizes of reef fishes are an order of magnitude smaller than terrestrial vertebrates of similar size. The small home ranges of most reef fishes closely associated with complex reef habitats makes them particularly sensitive to habitat degradation, as they are likely to have limited ability to relocate following local disturbances. The next chapter (Chapter 3) explored the determinants of homing and territorial behaviour in damselfish (family Pomacentridae), a group recognized for having small home ranges, strong territoriality and a close association with coral reef habitats. This comparative behavioural study examines the correlates of variation in home range and territory size in nine different damselfish species that are common at Lizard Island (Great Barrier Reef), and that encompass a range of trophic and social systems. All species exhibited relatively small home ranges, ranging from an average of only approximately 0.2 m2 for the coral-associated Chromis viridis to 6.5 m2 for the omnivorous Abudefduf sexfasciatus. All species except two small schooling planktivores exhibited some level of aggressive defence of core areas in their home range, but the proportion of the home range defended varied among species. Farming herbivorous species and A. sexfasciatus defended the largest proportion of their home range, while planktivores generally had the smallest home ranges and were the least aggressive. Both home range and territory sizes were weakly correlated with body size and average distance above the substratum, both within and among species. These results confirm that damselfishes commonly defend core areas within their home ranges. Population density and food availability are two key ecological factors known to influence the size of defended areas in territorial animals. Territories are predicted to be smaller at high population densities and with increasing food availability. However, these two factors potentially interact, with high population densities constraining territories and preventing them from expanding when food declines, which may lead to. v.
(7) territory abandonment. The aim of Chapter 4 was to examine the correlates of natural variation in territory size in low and high density populations of the herbivorous damselfish Dischistodus melanotus at Lizard Island (Great Barrier Reef). The roles of food availability were then tested by experimentally decreasing and increasing food levels in the low-density population (experiment one) and high density populations (experiment two). In experiment two, the effects of local density were tested by experimentally removing conspecific neighbours. Average territory size was two times larger. in. low-density. populations,. compared. with. high-density. populations.. Unexpectedly, there was no significant change in territory size in response to experimental increases or decreases in food in the low-density population, but several individuals abandoned territories when food was decreased. Also unexpectedly, individuals in the high-density population did not expand territories when neighbours were removed, but many relocated to occupy new territories. Individuals showed a significant increase in territory size when food was increased, both when neighbours were removed and in the controls. These results suggest that both population density and food availability do influence territory size, but the effects are context specific and do not conform to common theoretical predictions. Chapter. 5. focussed. on. specialised. coral-feeding. butterflyfishes. (family. Chaetodontidae). It examined whether patterns of home range use and territorial behaviour relate to coral cover, and experimentally investigated whether individuals expand home range size when coral cover is reduced. Behavioural observations on five species showed that individuals concentrate activity in multiple core areas within their home ranges, which between 80 and 380 m2. Core areas appeared to be determined by the presence of preferred coral species. When access to core areas was experimentally reduced for two species by placing cages over the corals in core areas within home ranges, two different patterns were observed. A specialised corallivore (Chaetodon lunulatus) tended to show no response or abandon home ranges, while a more generalised coral-feeder (C. auriga) expanded its home range by over 60%. For both species, individual variation in home range size was positively correlated with body size and rugosity, and negatively correlated with coral cover. These results suggest that the localised availability of corals is critical in determining the location and size of butterflyfish home ranges and territories, which may explain the dramatic population consequences of reef degradation. Overall, this study has shown that the spatial behaviour of coral reef fishes, including both home range and territorial behaviour is complex, and influenced by a range of. vi.
(8) factors, most notably body size, degree of association with benthic substrata, reef rugosity, population density and food availability. It confirms the general perception that most small reef fish have small home ranges, relative to similar-size terrestrial animals. It confirms that territorial behaviour is commonly associated with small home range size in coral reef damselfishes. These spatial behaviours suggest that most small reef fishes will be amenable to management inside relatively small marine protected areas. However, additional actions to protection reef health will be essential to maintain natural patterns in the behavioural ecology of this diverse group of vertebrates.. vii.
(9) Table of Contents Acknowledgements ....................................................................................................... ii Statement of Contribution of Others ............................................................................. iii Abstract........................................................................................................................ iv Table of Contents......................................................................................................... 8 List of Tables ............................................................................................................. 13 List of Figures ............................................................................................................ 16 General Introduction .................................................................................................. 20 1.1. Concepts of home range and territoriality ..................................................... 21. 1.2. To defend or not to defend ........................................................................... 22. 1.3. Determinants of home range and territory size............................................. 22. 1.4. Home range and territorial behaviour in coral reef fishes ............................. 24. 1.5. Alternative approaches to studying home range and territory size in reef fish 25. 1.6. Use of space and reef fish conservation ...................................................... 26. 1.7. Aims and structure of thesis ......................................................................... 27. Multiple correlates of home range size within and among species of coral reef fishes 32 2.1. Abstract ....................................................................................................... 32. 2.2. Introduction .................................................................................................. 33. 2.3. Methods ....................................................................................................... 36. 2.3.1. Study species and location ................................................................... 36. 2.3.2. Home range observations and field measurements .............................. 37. 2.3.3. Factors influencing home range size ..................................................... 37. 2.3.4. Data analysis ........................................................................................ 38. 2.4. Results......................................................................................................... 38. 2.4.1. Prediction 1: Home range size will be positively correlated with body size,. both among individuals within species, species within families and across all taxa combined. .......................................................................................................... 38. 8.
(10) 2.4.2. Prediction 2: Home ranges will vary among trophic groups, with. carnivores and corallivores exhibiting larger home ranges than herbivores, and planktivores exhibiting the smallest home ranges. .............................................. 39 2.4.3. Prediction 3: Home ranges will increase with the depth of an individual,. as local productivity is likely to decline with depth, thus increasing the area required to meet energy demands. ..................................................................... 39 2.4.4. Prediction 4: Home ranges will be larger in individuals that are less. strongly associated with the substratum (i.e. those occupying positions higher above the substratum). ....................................................................................... 40 2.4.5. Prediction 5: Home ranges will be smaller in more topographically. complex habitats, compared with open habitats. ................................................ 40 2.4.6. Prediction 6: Home range size will decrease with increasing percentage. of coral cover for corallivores. ............................................................................. 40 2.5. Discussion ................................................................................................... 57. 2.5.1. Role of body size .................................................................................. 57. 2.5.2. Phylogenetic constraints ....................................................................... 58. 2.5.3. Trophic categories ................................................................................ 58. 2.5.4. Habitat features .................................................................................... 60. 2.5.5. Limitations of the study ......................................................................... 61. 2.5.6. Future research opportunities ............................................................... 63. 2.5.7. Conservation implications ..................................................................... 63. 2.6. Conclusions ................................................................................................. 63. Determinants of home range and territory size in coral reef damselfishes .................. 65 3.1. Abstract ....................................................................................................... 65. 3.2. Introduction .................................................................................................. 65. 3.3. Methods ....................................................................................................... 68. 3.3.1. Study species and location ................................................................... 68. 3.3.2. Home range observations and measurements ...................................... 68. 3.3.3. Territory measurements and observations ............................................ 69. 3.3.4. ArcView GIS analysis............................................................................ 69. 3.3.5. Correlates of home range and territory size .......................................... 69. 9.
(11) 3.3.6 3.4. Data analysis ........................................................................................ 70. Results......................................................................................................... 70. 3.4.1. Prediction 1: Individuals will maintain home ranges and rigorously defend. all or part of their home range............................................................................. 70 3.4.2. Prediction 2: Both home range and territory areas will increase with. increasing body size, both among and within species. ....................................... 70 3.4.3. Prediction 3: Home range area and territory size will differ among species. from different trophic groups ............................................................................... 71 3.4.4. Prediction 4: Home range area and territory size will increase with depth 71. 3.4.5. Prediction 5: Home ranges and territories will be larger for species and. individuals that forage above the substratum...................................................... 71 3.4.6. Prediction 6: Home ranges and territories will be positively related to the. rugosity of the habitat ......................................................................................... 72 3.4.7. Prediction 7: Home range size and territory size will be positively. correlated with both hard and soft coral cover .................................................... 72 3.4.8. The frequency of territorial encounters and the type of territorial. behaviour exhibited will vary proportionally with territory size, with more attacks made by individuals with who have a larger territory area to defend. .................. 73 3.4.9. Relative importance of the different correlates of home range and territory. size. 73. 3.5. Discussion ................................................................................................... 91. 3.5.1. Relationship between home range and territoriality ............................... 91. 3.5.2. Body size .............................................................................................. 92. 3.5.3. Depth, height above substratum and rugosity ....................................... 93. 3.5.4. Role of hard and soft coral cover .......................................................... 94. 3.6. Conclusion ................................................................................................... 95. Roles of population density and food availability in determining territory size in an herbivorous coral reef damselfish............................................................................... 96 4.1. Abstract ....................................................................................................... 96. 4.2. Introduction .................................................................................................. 96. 4.3. Methods ..................................................................................................... 100. 10.
(12) 4.3.1. Study site and species ........................................................................ 100. 4.3.2. Comparison of territory size in low and high density locations ............. 100. 4.3.3. Experiment 1: Food manipulations in a low density population ........... 101. 4.3.4. Experiment 2: Food and density manipulations in a high density. population ........................................................................................................ 101 4.3.5 4.4. Analysis .............................................................................................. 102. Results....................................................................................................... 102. 4.4.1. Comparison of low and high density populations ................................ 102. 4.4.2. Experiment 1: Food manipulations in a low density population ........... 103. 4.4.3. Experiment 2: Food and density manipulations in a high density. population ........................................................................................................ 103 4.5. Discussion ................................................................................................. 113. 4.5.1. Natural differences between low and high density populations ........... 113. 4.5.2. Role of food abundance ...................................................................... 114. 4.5.3. Role of population density ................................................................... 115. 4.6. Conclusion ................................................................................................. 116. Home range and territorial behaviour of coral reef butterflyfishes: the importance of coral cover ............................................................................................................... 117 5.1. Abstract ..................................................................................................... 117. 5.2. Introduction ................................................................................................ 117. 5.3. Methods ..................................................................................................... 120. 5.3.1. Study site and species ........................................................................ 120. 5.3.2. Home range, use of core areas and territoriality.................................. 120. 5.3.3. Co-variation between home range area and body size, depth, rugosity. and coral cover ................................................................................................. 121 5.3.4 5.4. Experimental reduction in food availability .......................................... 122. Results....................................................................................................... 122. 5.4.1. Prediction 1: Butterflyfishes would exhibit both home ranging and. territorial behaviour, and would exploit core sites within their home range. ....... 122 5.4.2. Co-variation between home range size, and body size, depth rugosity. and coral cover ................................................................................................. 123 11.
(13) 5.4.3 5.5. Experimental reduction in access to hard corals. ................................ 124. Discussion ................................................................................................. 132. 5.5.1. Home range, territoriality and core areas ............................................ 132. 5.5.2. Multiple correlates of home range area ............................................... 133. 5.5.3. Critical role of coral cover ................................................................... 134. 5.5.4. Population consequences ................................................................... 134. 5.5.5. Future studies ..................................................................................... 135. 5.6. Conclusions ............................................................................................... 135. General Conclusions ................................................................................................ 137 6.1. Home ranges, territorial behaviour and core areas..................................... 137. 6.2. Body size ................................................................................................... 137. 6.3. Habitat structure and depth ........................................................................ 138. 6.4. Food abundance ........................................................................................ 140. 6.5. Population density...................................................................................... 141. 6.6. Future directions ........................................................................................ 142. 6.7. Implications for Management Arrangements .............................................. 143. 6.8. Concluding Remarks.................................................................................. 144. References .............................................................................................................. 145 Appendix 1 ............................................................................................................... 182. 12.
(14) List of Tables Table 2.1: List of species observed including family and trophic grouping, mean body size (cm), range of body sizes (cm) observed and range of home ranges observed (m2), including upper limit, lower limit and mean. ....................................................... 43 Table 2.2: Correlation between home range area (m2) and body size (cm), depth (m), average height above substratum (cm) and rugosity (m), across all individuals, species and families sampled (n = 671): correlation is significant at the 0.01 level (2-tailed); correlation is significant at the 0.05 level (2-tailed). .................................................... 44 Table 2.3: Pearson’s correlation coefficients between home range area (m2) and the variables measured: correlation is significant at the 0.01 level (2-tailed); correlation is significant at the 0.05 level (2-tailed). ......................................................................... 46 Table 2.4: Multiple linear regression analysis was used to develop a model for predicting which of the variables, being body size, depth of the site, height of the individual above the substrate or the rugosity of the habitat, influenced the total size of the home range area maintained. Only body size had a significant (p < 0.01) correlation with home range area. .............................................................................. 47. Table 3.1: List of species observed including family and trophic grouping, mean body size (cm), range of body sizes (cm) observed, and range of home ranges (m2) and territories (m2) observed, including upper limit, lower limit and mean. ........................ 76 Table 3.2: Pearson’s correlation coefficients between home range area (m2) and the variables measured: correlation is significant at the 0.01 level (2-tailed); correlation is significant at the 0.05 level (2-tailed). ............................ Error! Bookmark not defined. Table 3.3: Pearson’s correlation coefficients between territory area (m2) and the variables measured: correlation is significant at the 0.01 level (2-tailed); correlation is significant at the 0.05 level (2-tailed). ............................ Error! Bookmark not defined. Table 3.4: Summary of territorial interactions engaged in during the observation period for the species of Pomacentrids sampled. Aggressive interactions are defined as instances where the observed individual actively chased another outside of its defended space, or engaged in physical aggressive contact with another individual. Passive aggressive interactions are defined as instances where the observed individual flared its dorsal fin and elevated its position in the water column. ............... 88 Table 3. 5: Multiple regression analysis was used to develop a model for predicting which of the variables, being body size, depth of the site, height of the individual above. 13.
(15) the substrate, the rugosity of the habitat, percentage of coral cover, percentage of soft coral cover and the type of interactions, influenced the total size of the home range area (m2). ................................................................................................................... 89 Table 3.6: Multiple regression analysis was used to develop a model for predicting which of the variables, being body size, depth of the site, height of the individual above the substrate, the rugosity of the habitat, percentage of coral cover, percentage of soft coral cover and the type of interactions, influenced the total size of the territory area (m2). ........................................................................................................................... 90. Table 4.1: Experimental design and number of replicates for Experiment 1, a single factor experiment involving low population density food manipulation with five levels of food availability, including 50% and 90% increases and decreases in food. ............. 106 Table 4.2: Experimental design and number of replicates for Experiment 2, a two factor experiment involving high density population manipulation and food manipulation with five levels of food availability, including 50% and 90% increases and decreases in food.......................................................................................................................... 106 Table 4.3: Pearson’s correlation coefficients (n=50) between the territory area (m2) recorded and the variables measured in low density populations: correlation is significant at the 0.01 level (2-tailed); correlation is significant at the 0.05 level (2tailed). ...................................................................................................................... 108 Table 4.4: Pearson’s correlation coefficients (n=100) between the territory area (m2) recorded and the variables measured in high density populations: correlation is significant at the 0.01 level (2-tailed). ....................................................................... 108 Table 4.5: Experiment 1: One-Way ANOVA analysis was used to determine if food resource availability influenced changes in territory area over the 48 hours observation period, in areas with naturally occurring low populations of Dischistodus melanotus. 109 Table 4.6: Experiment 1: Summary of individuals observed to abandon territories during treatments at sites with low population densities. .......................................... 109 Table 4.7: Experiment 1: Chi squared test of the observed number of individuals abandoning territories during the food manipulation treatments: distribution is significant at the 0.05 level. ...................................................................................... 110 Table 4.8: Experiment 2: A two-way Fixed-factor ANOVA analysis was used to determine significance between food treatments at intervals throughout the observation period, in areas with naturally occurring high populations of Dischistodus melanotus. ................................................................................................................................ 110 Table 4.9: Experiment 2: Summary of individuals observed to abandon territories during treatments at sites with high population densities. ......................................... 111 14.
(16) Table 4.10: Experiment 2: Chi squared test of the observed number of individuals abandoning territories during the food manipulation treatments: distribution is significant at the 0.01 level. ...................................................................................... 112. Table 5.1: List of species observed including trophic grouping, mean body size (cm), range of body sizes (cm), and observed home range area (m2), including upper limit, lower limit and mean. ............................................................................................... 127 Table 5.2: Summary of territorial behaviour displayed by and against chaetodontid species observed. .................................................................................................... 128 Table 5.3: Summary of the number of members of the observed chaetodontids that maintain more than one core area within their home ranges. ................................... 128 Table 5.4: Pearson’s correlation coefficients between the initial territory area (m2) recorded and the variables measured: correlation is significant at the 0.01 level (2tailed); correlation is significant at the 0.05 level (2-tailed). ...................................... 130 Table 5.5: Multiple regression analysis was used to develop a model for predicting which of the variables, being body size, depth of the site, height of the individual above the substrate, the rugosity of the habitat, percentage of coral cover and percentage of soft coral cover influence the total size of the home range area (m2) for Chaetodon auriga. ...................................................................................................................... 130 Table 5.6: Multiple regression analysis was used to develop a model for predicting which of the variables, being body size, depth of the site, height of the individual above the substrate, the rugosity of the habitat, percentage of coral cover and percentage of soft coral cover influence the total size of the home range area (m2) for Chaetodon lunulatus. ................................................................................................................. 131 Table 5.7: Summary of individuals observed to abandon territories during treatment. ................................................................................................................................ 131. 15.
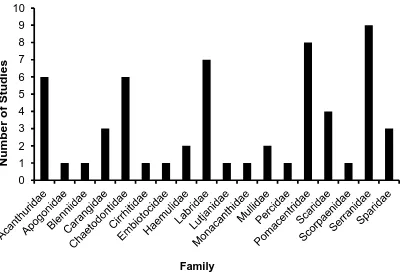
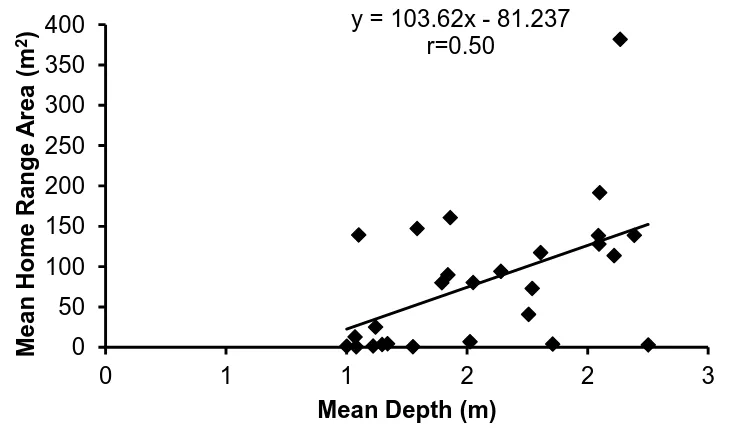
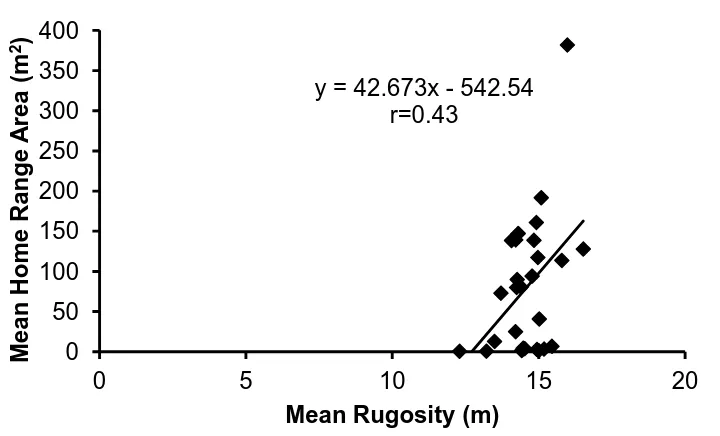
(17) List of Figures Figure 1.1 A summary of the number of coral reef associated fish home range studies published from 1958 to the present time (refer to Appendix 1 for studies included). ... 30 Figure 1.2: A summary of the number of coral reef associated fish home range studies per family. .................................................................................................................. 30 Figure 1.3: The relationship between the home range area of coral reef associated fishes and their body size, for all species with published data since 1958. Data is presented on a log scale with base 10. ...................................................................... 31. Figure 2.1: Map of Lizard Island showing reefs where field observations were conducted.. 42 2. Figure 2.2: The average home range area (m ) and average body size (cm) for families of coral reef fish observed.. 48. Figure 2.3: The relationship between the mean home range area (m2) and the mean body size (cm) for all 27 species of coral reef fish observed in this study. Data is presented on a log scale with base 5.. 48 2. Figure 2.4: The relationship between home range area (m ) and trophic group of coral reef fish observed.. 49. Figure 2.5: The relationship between mean home range area (m2) and mean depth (m) at which coral reef fish were observed for all 27 species of coral reef fish observed in this study.. 49. Figure 2.6: The relationship between mean home range area (m2) and the mean height above the substrate (cm) at which coral reef fish were observed for all 27 species of coral reef fish observed in this study.. 50 2. Figure 2.7: The relationship between mean home range area (m ) and the mean rugosity (m) of the habitat in which coral reef fish were observed for all 27 species of coral reef fish observed in this study.. 50 2. Figure 2.8: The relationship between the home range area (m ) and the body size (cm) for all nine families of coral reef fish observed in this study: a) Acanthuridae; b) Chaetodontidae; c) Labridae; d) Lethrinidae; e) Lutjanidae; f) Nemipteridae; g) Pomacentridae; h) Scaridae and i) Siganidae. Data is presented on a log scale with base 5.. 51 2. Figure 2.9: The relationship between the home range area (m ) and the depth (m) for all nine families of coral reef fish observed in this study: a) Acanthuridae; b). 16.
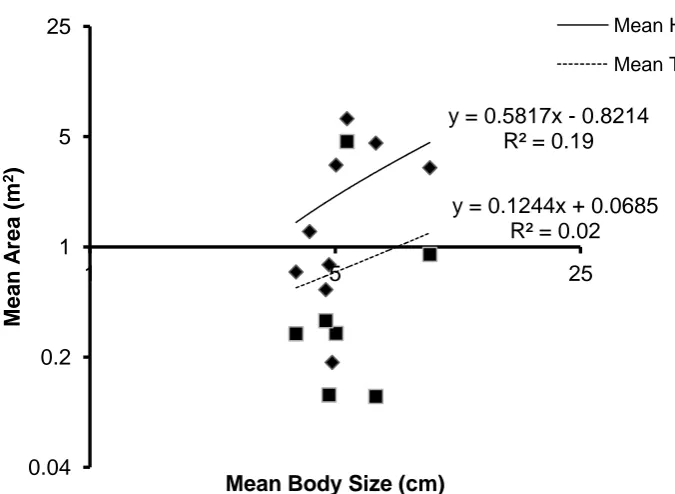
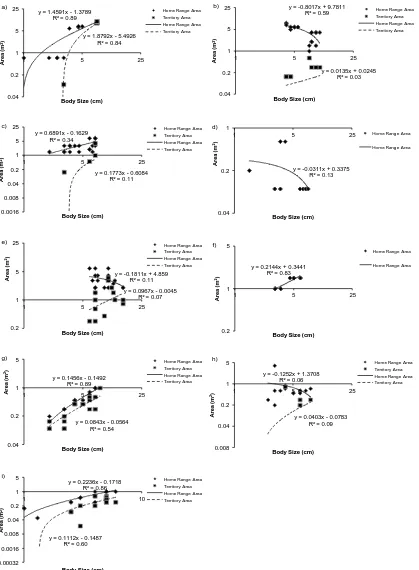
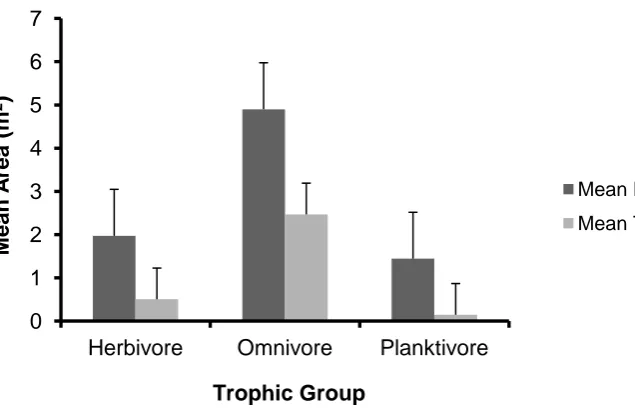
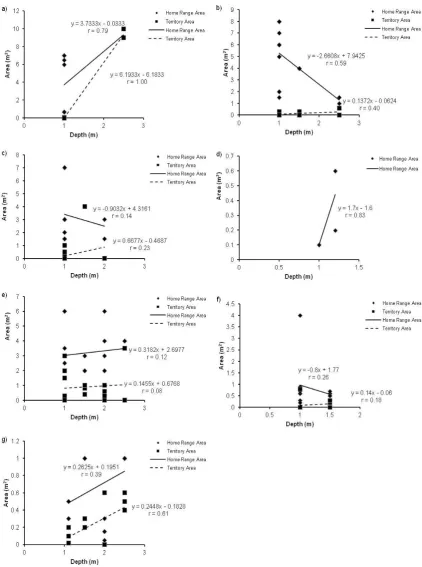
(18) Chaetodontidae; c) Labridae; d) Lethrinidae; e) Lutjanidae; f) Nemipteridae; g) Pomacentridae; h) Scaridae and i) Siganidae.. 52 2. Figure 2.10: The relationship between the home range area (m ) and the average height above the substrate (cm) the observed individual was positioned, for all nine families of coral reef fish observed in this study: a) Acanthuridae; b) Chaetodontidae; c) Labridae; d) Lethrinidae; e) Lutjanidae; f) Nemipteridae; g) Pomacentridae; h) Scaridae and i) Siganidae.. 53 2. Figure 2.11: The relationship between the home range area (m ) and the rugosity of the site (m) for all nine families of coral reef fish observed in this study: a) Acanthuridae; b) Chaetodontidae; c) Labridae; d) Lethrinidae; e) Lutjanidae; f) Nemipteridae; g) Pomacentridae; h) Scaridae and i) Siganidae.. 54. Figure 2.12: The relationship between the home range area (m2) and the percent coral cover present at the site.. 55 2. Figure 2.13: The relationship between the home range area (m ) and the percent coral cover for all corallivorous fish observed in this study: a) Chaetodon aureofasciatus; b) C. lunulatus; c) C. melannotus; d) C. plebeius.. 56. Figure 3.1: Map of Lizard Island showing reefs where field observations were conducted. ................................................................................................................. 75 Figure 3.2: The relationship between both the mean home range area (m2) and the mean territory area (m2), and the mean body size (cm) for all nine species of Pomacentrids observed in this study. Data is presented on a log scale with base 5. .. 77 Figure 3.3: The relationship between the home range area (m2), the territory area (m2), and the body size (cm) for all nine species of Pomacentrids observed in this study: a) Abudefduf sexfasciatus; b) Acanthochromis polyacanthus; c) Amblyglyphidodon curacao; d) Chromis viridis; e) Dischistodus melanotus; f) Neopomacentrus bankieri; g) Pomacentrus amboinensis; h) Pomacentrus chrysurus; i) Pomacentrus moluccensis. Data is presented on a log scale with base 5. ............................................................ 78 Figure 3.4: The average home range area (m2) and territory area (m2) for trophic groups of Pomacentrids observed. ............................................................................. 79 Figure 3.5: The relationship between both the mean home range area (m2) and the mean territory area (m2), and the mean depth (m) of observations, for all nine species of Pomacentrids measured in this study. .................................................................... 79 Figure 3.6: The relationship between the home range area (m2), the territory area (m2), and the depth (m) of observations for all nine species of Pomacentrids observed in this study: a) Abudefduf sexfasciatus; b) Acanthochromis polyacanthus; c) Amblyglyphidodon curacao; d) Chromis viridis; e) Dischistodus melanotus; f). 17.
(19) Pomacentrus chrysurus; g) Pomacentrus moluccensis. No variation was recorded in Neopomacentrus bankieri and Pomacentrus amboinensis home range areas. .......... 80 Figure 3.7: The relationship between both the mean home range area (m2) and the mean territory area (m2), and the mean position of the sampled individuals above the substratum (cm) for all nine species of Pomacentrids observed in this study. ............ 81 Figure 3.8: The relationship between the home range area (m2), the territory area (m2), and the position of the sampled individuals above the substratum (cm) for all nine species of Pomacentrids observed in this study: a) Abudefduf sexfasciatus; b) Acanthochromis polyacanthus; c) Amblyglyphidodon curacao; d) Chromis viridis; e) Dischistodus melanotus; f) Pomacentrus amboinensis; g) Pomacentrus chrysurus; h) Pomacentrus moluccensis. No variation was recorded in Neopomacentrus bankieri home range areas. ..................................................................................................... 82 Figure 3.9: The relationship between both the mean home range area (m2) and the mean territory area (m2), and the mean rugosity (m) of the site for all nine species of Pomacentrids observed in this study. ......................................................................... 83 Figure 3.10: The relationship between the home range area (m2) the mean territory area (m2), and the rugosity (m) of the site for all nine species of Pomacentrids observed in this study: a) Abudefduf sexfasciatus; b) Acanthochromis polyacanthus; c) Amblyglyphidodon curacao; d) Chromis viridis; e) Dischistodus melanotus; f) Pomacentrus amboinensis; g) Pomacentrus chrysurus; h) Pomacentrus moluccensis. No variation was recorded in Neopomacentrus bankieri home range areas. .............. 84 Figure 3.11: The relationship between both the mean home range area (m2) and mean territory area (m2), and the percentage of total coral cover present at the site. ........... 85 Figure 3.12: The relationship between both the mean home range area (m2) and mean territory area (m2), and the percentage of total soft coral cover present at the site. .... 85 Figure 3.13: The relationship between the home range area (m2), the mean territory area (m2), and the percent coral cover present at the site for all nine species of Pomacentrids observed in this study: a) Abudefduf sexfasciatus; b) Acanthochromis polyacanthus; c) Amblyglyphidodon curacao; d) Chromis viridis; e) Dischistodus melanotus; f) Pomacentrus amboinensis; g) Pomacentrus chrysurus; h) Pomacentrus moluccensis. No variation was recorded in Neopomacentrus bankieri home range areas.......................................................................................................................... 86 Figure 3.14: The relationship between the home range area (m2), the mean territory area (m2), and the percent soft coral cover present at the site for all nine species of Pomacentrids observed in this study: a) Abudefduf sexfasciatus; b) Acanthochromis polyacanthus; c) Amblyglyphidodon curacao; d) Chromis viridis; e) Dischistodus melanotus; f) Pomacentrus amboinensis; g) Pomacentrus chrysurus; h) Pomacentrus. 18.
(20) moluccensis. No variation was recorded in Neopomacentrus bankieri home range areas.......................................................................................................................... 87. Figure 4.1: Map of Lizard Island showing reefs where field experiments were performed.. 105. Figure 4.2: Mean territory areas (m2) at low population density and high population density sites, with standard error represented.. 107 2. Figure 4.3: Experiment 1: Mean change in territory area (m ) over the 48 hour observation period, relative to the food treatment, for individuals in low population density habitats, with standard error represented.. 109. Figure 4.4: Experiment 2: Mean change in territory area (m2) over the 48 hour observation period, relative to the food and population treatments, for individuals in high population density habitats, with standard error represented.. 110. Figure 4.5: Experiment 2: Average territory size (m2) in areas where food resources were manipulated for high population densities of Dischistodus melanotus, with standard error represented.. 111. Figure 5.1: A map of Lizard Island indicating areas where experiments were performed. ............................................................................................................... 125 Figure 5. 2: Kernel Analysis of observed home range areas of a) Chaetodon aureofasciatus, b) C. auriga, c) C. lunulatus, d) C. melannotus and e) C. plebeius. . 126 Figure 5.3: The home range area (m2) of the omnivore Chaetodon auriga and the corallivore Chaetodon lunulatus a) over the observation period, and b) changes over the observation period, with standard error represented. ......................................... 129. 19.
(21) CHAPTER 1. General Introduction Behavioural ecology examines the ecological drivers of animal behaviour that contribute to survival and reproduction (Brown, 1975, Wilson, 1975b, Krebs et al., 2012). A fundamental aspect of behavioural ecology is an animal’s use of space and how they interact with other individuals over the use of space (Gross, 1994, Krebs and Davies, 1993). Mobile animals vary from living their entire lives in an area less than 1 m2 to migrating from one side of the globe to the other. However, very few species are truly nomadic, and even in migratory species, individuals exhibit a strong association with particular places at particular times. On a day to day basis, most species associate with a home base and restrict normal daily activities to a home range (Wilson, 1975b, Burt, 1943). The position and size of the home range is often governed by the availability of basic resources such as food, shelter and breeding sites (Schoener, 1968, Krebs and Davies, 1993). However, use of home areas can be associated with varying degrees of aggression and social interaction within and among species, and all or part of the home range may be defended. This leads to an enormous variety of social and spacing systems (Brown, 1975, Wilson, 2000). An understanding of the ecological factors that govern the nature and diversity of spatial behaviours is critical, not only to understanding the evolution of behaviour, but also to assess how individuals will respond to changes with their environment. An understanding of the space requirements of animals has become critical as most species are experiencing major changes to habitat structure – including habitat loss and degradation (Tilman et al., 1994, Brooks et al., 2002, Fahrig, 2003). Many species exhibit flexible behavioural strategies to cope with dynamic habitats, while others adopt behaviours that buffer them from environmental fluctuations (Brown, 1975). Conservation measures designed to protect species from environmental change, such as the establishment of nature reserves, require a basic understanding of the area individuals need to survive and reproduce (McNeill, 1994, Blyth-Skyrme et al., 2006, McLeod et al., 2009). The size of nature reserves must take into account the potential effects of habitat degradation on the areas required to meet metabolic demands. Unfortunately, for many taxonomic groups, patterns of variation in use of space and the processes underlying this variation are not yet well understood. To address these issues, it is important to begin with the fundamental distinction between the twin concepts of home range and territoriality.. 20.
(22) 1.1. Concepts of home range and territoriality. A home range is usually defined as the area in which an individual lives and carries out its daily activities (Burt, 1943, Brown and Orians, 1970, Kramer and Chapman, 1999). Even within home ranges, some individuals show a preference for particular places or core areas) within their space (Don and Rennolls, 1983, Samuel et al., 1985). There are a number of potential advantages for individuals to restrict their activities to a home range. Through frequent use of an area, individuals establish familiarity with the resources, such as food, shelter and nesting sites, which may enhance their survival and reproductive success (Kramer and Chapman, 1999). These advantages are thought to outweigh the potential costs of living in a confined area. For example, restricting activities to the boundaries of a home range limits an individual’s access to the resources within their site, exposing them to local fluctuations in resources and inhibiting their ability to discover high quality resources in other places (Kramer and Chapman, 1999). It is critical that individuals adopt a home range size that guarantees sufficient resources in response to environmental change. In theory, the size of an animal’s home range is typically related to the fundamental metabolic requirements correlated to body size (Turner et al., 1969, Blueweiss et al., 1978, Wasserman and Mitter, 1978, Awata et al., 2012) and the nutritional value of a site (Simon, 1975, Connell and Kingsford, 1998, Bay, 1999, Holzman et al., 2007). The size and determinants of boundaries of home ranges have been most widely investigated for terrestrial animals, particularly mammals (Burt, 1943, Mohr, 1947, Damuth, 1981, Stearns, 1983, Swihart and Slade, 1985, Lindstedt et al., 1986, Swihart et al., 1988, Millar and Hickling, 1991, Stirrat, 2003) and birds (McNab, 1963, Schoener, 1968, Gill and Wolf, 1975, Gass et al., 1976, Andelt and Gipson, 1979, Barbraud et al., 1999, Adams et al., 2004, Fort and Otter, 2004, Olifiers et al., 2004, Mattern et al., 2007). However, it is clear that different taxonomic groups and different ecosystems can fluctuate markedly, in terms of the patterns and processes associated with home range size. In many species, individuals defend part or all of their home range from other individuals that use the same resources. This aggressive defence of an area against intruders is defined as territoriality (Noble, 1939, Brown, 1964, Clarke, 1970), and the size and extent to which the area is defended varies amongst species and relative to the threat to the resource (Ewald and Orians, 1983, Craig and Douglas, 1986, Riechert, 1988, Adams, 2001). Territoriality can provide some degree of exclusive access to resources (Grant, 1993, Grant, 1997), which may provide for competitive. 21.
(23) advantages and enhanced reproductive success over non-territorial individuals (Burt, 1943, Brown, 1964, Schoener, 1968, Myrberg and Thresher, 1974, Gass et al., 1976, Schoener, 1983b, Davies and Houston, 1984, Carpenter, 1987, Schoener, 1987, Davies and Hartley, 1996). However, territorial behaviour carries with it the risk of physical injury and the energetic costs associated with defending a resource. To be advantageous, the benefits of exclusive access to resources must outweigh these costs (Itzkowitz, 1979, Hixon, 1987, Grant, 1997). As with home range size, much of the theory and empirical knowledge on the determinants of territories has been based on birds (Schoener, 1968, Gill and Wolf, 1975, Gass et al., 1976, Ewald and Orians, 1983, Craig and Douglas, 1986, Fort and Otter, 2004) and terrestrial mammals (Burt, 1943, Harvey and Godfray, 1987, Adams, 2001), with aquatic species poorly understood.. 1.2. To defend or not to defend. Animals can defend all of their home range, just the core areas or exhibit no territorial defence whatsoever. Alternatively they may choose to only defend specific resources important to their survival and fitness. In theory, individuals are predicted to defend a resource when the benefits of maintaining the territory outweigh the costs associated with its defence (Gill and Wolf, 1975, Barlow, 1993, Chapman and Kramer, 1996). This is known as the theory of economic defendability and was first developed to explain the evolution of territoriality in birds (Brown, 1964). Territorial individuals should only attack intruders that consume or utilise the resource being defended (Itzkowitz, 1979, Itzkowitz, 1990, Johnson et al., 2011). This may depend on the species, the sex and the life history stage of both the intruder and the defender (Adams, 2001, Hixon, 1980b, Norman and Jones, 1984, Hourigan, 1989, Motta, 1989, Tricas, 1989a, Zschille et al., 2012), and the local conditions at the time (Stamps et al., 1987, Itzkowitz, 1990, van Rooij et al., 1996b, Fort and Otter, 2004). The mix of home range and territorial behaviour leads to a myriad of spacing and social systems in the animal kingdom (Brown, 1975, Wilson, 1975b). Whether territories are fixed in size or can vary in response to local conditions has important implications for the regulation of populations and their response to habitat change (Grant, 1993, Begon et al., 1996, Harborne et al., 2012, Hixon et al., 2012, Lemoine and Valentine, 2012).. 1.3. Determinants of home range and territory size. Many ecological models have been developed to quantify home range and territory size, and the parameters that determine them. The majority of models assume. 22.
(24) individuals choose an area that maximises the ratio of the energy gained from resources to the energy expended in acquiring the resources (Miller, 1968, Pulliam, 1974, Schoener, 1987, Stamps et al., 1987, Blackburn et al., 1990). Both benefits and costs will increase as some function of the size of the area, but there will be an optimal area at which benefits greatly exceed the costs. It is expected that in resource abundant habitats, individuals will have smaller home ranges than in areas with poor resource quality and abundance (Stirrat, 2003). Studies suggest that not only are home ranges proportionally larger in poor resource areas, but they can overlap and are more evenly spaced (Blackburn et al., 1990). Habitats can only support a certain number of home ranges, despite levels of overlap, particularly where the resource levels in the habitat are limited (Bradbury et al., 1995, Adams, 2001). Whilst home ranges appear to be determined by spatially limiting resources and habitat productivity (Harestad and Bunnell, 1979), the optimal home range size can reflect species traits such as feeding strategy, trophic status, resource use, metabolic demands, efficiency of movement and body size (Mohr, 1947, McNab, 1963, Turner et al., 1969, Maza et al., 1973, Andelt and Gipson, 1979, Harestad and Bunnell, 1979, Hixon, 1980b). For many terrestrial animals, body size and mass are considered to be the ultimate defining factor when determining home range area and many studies have established a positive relationship between the two (Simon, 1975, Lindstedt et al., 1986, Johnson, 1999, Olifiers et al., 2004), based largely on the dependencies between body size and the individuals subsequent greater metabolic requirements and decreased energy costs associated with movement (McNab, 1963, Basset, 1995). Generally species with smaller body sizes have narrowly defined niches leading to patchy distribution throughout a habitat and a reduced space requirement for range of movement (Johnson, 1999). On the other hand large predators are regarded to have more ‘free’ niche space as they can exploit a broader size range and thus a greater abundance of prey species than smaller predators (Brown and Maurer, 1986, Woodward and Hildrew, 2002). They are also often observed sharing home ranges with a greater variety of conspecifics compared to smaller sized individuals (Peters, 1983). Due to their larger body size, they are also often capable of controlling a larger proportion of the available resources through direct competition, which supports greater population abundance (Cotgreave, 1993). Whilst the determinants of home range and territory size are similar, population density and costs of aggression may be more critical when considering territory size. Population density effects home range size through reduced resource availability,. 23.
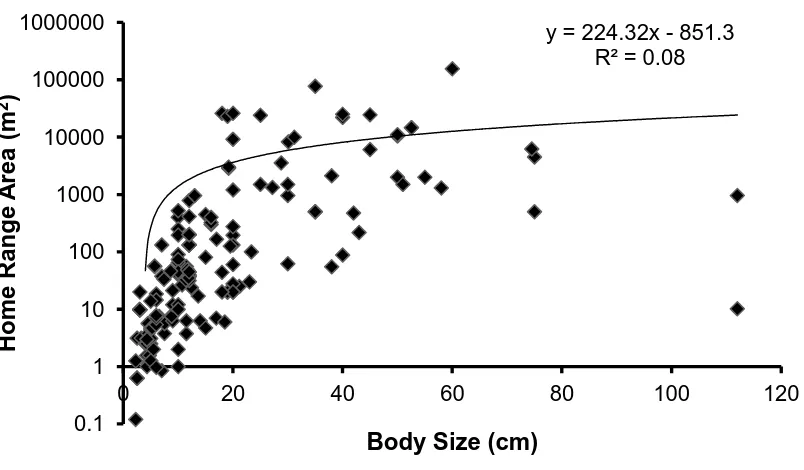
(25) however, for territorial individuals, it can also limit territory size through inter- and intraspecific interactions (Mohr, 1947, Maza et al., 1973, Hixon, 1980b, Schoener, 1981, Cotgreave, 1993, Huber and Kirchhofer, 1998, Saunders and McLeod, 1999, Adams, 2001, Rhodes et al., 2005, McLoughlin et al., 2007). At high population densities there is increased competitive interaction for resources and consequently territory size usually decreases with increasing competitor density (Hixon, 1980b, Hixon, 1987). Where territories are contiguous, i.e. the territory boundaries are alongside another individuals, pressures are placed on the boundaries through movement and interactions (Adams, 2001), both of which are influenced by population densities and food availability. These interactions compress territories and as such, it is predicted that only optimal territory size is achieved in non-contiguous circumstances (Grant, 1997) as reactions to movements at the boundaries are considered to be less strong (Adams, 2001).. 1.4. Home range and territorial behaviour in coral reef fishes. The first study into the home ranges of coral reef fishes focussed on the movement of a range of species in Bermuda (Bardach, 1958). However, our understanding of coral reef fish home range and spacing behaviour was pioneered by P F Sale, who published a series of papers on the determinants of home range size in damselfishes in the 1970’s (Sale, 1971, Sale, 1972a, Sale, 1972b, Sale, 1974, Sale, 1975). As the body of work on reef fish behaviour increased, it was hypothesized that there are fundamental differences between reef fishes, organisms in other aquatic environments and terrestrial animals in home range and territory sizes (Sale, 1978b). On the basis of this early work a number of generalizations emerged concerning the size of coral reef fish home ranges and the prevalence of territoriality. However, while information on reef fish home ranges and territories has accumulated for species in many coral reef families over the last few decades, these fundamental theories and emerging generalizations have received little further attention. The first generalization concerns home range size in coral reef fishes. Reef fishes appear to be highly site-attached and home ranges appear to be limited with an order of magnitude smaller in size than those observed in similar sized terrestrial species (Fricke, 1986, Roberts and Ormond, 1987, Danilowicz, 1996, Bergman et al., 2000, Chapman and Kramer, 2000). Many reef fish, for example, can have a home range of less than 1 m2, which is extremely rare in terrestrial birds and mammals of similar size. Small home ranges may relate to the aquatic medium, high ecosystem productivity and a close association between fishes and coral shelter sites (Stephens et al., 1970, Sale,. 24.
(26) 1980, Williams, 1991, Bell and Kramer, 2000, Meyer et al., 2000, Zekeria et al., 2002, Kobayashi and Hattori, 2006). Although this generalization emerged in the early 1980’s, it was based on relatively few studies and few reef fish taxa. Despite a further 30 years of research, the data-base on reef fish home range sizes and the determinants of home range size has been slow to accumulate, with only one or two papers being published every year (Figure 1.1), with a recent increase associated with new tagging methods. Most home range studies of have focused on the readily accessible families of Pomacentridae and Labridae, or the commercially important species belonging to the family Serranidae (Figure 1.2). There have been few reviews of this topic, the most recent being Chapman and Kramer (2000), which presented home range estimates for only 35 species. The papers published since 1958 support the conclusion that there is a weak but positive relationship between home range area and body size (Figure 1.3). The other long-standing generalization is that there is an unusually high prevalence of territorial behaviour in coral reef fish when compared with freshwater fishes and other animals (Grant, 1997). For many years, territorial behaviour was argued to be a fundamental determinant of space limitation in coral reef fish communities (Sale, 1976, Sale, 1977, Luckhurst and Luckhurst, 1978b, Sale, 1978a, Williams, 1980a, Robertson and Polunin, 1981, Robertson et al., 1981, Gladfelter and Johnson, 1983, Sale, 1984, Schmitt and Holbrook, 1986, Hixon and Beets, 1989, Karlson and Hurd, 1993, Kramer and Chapman, 1999). Grant (1997) suggested that as many as 79% of coral reef fish species exhibit some form of territorial behaviour. However, the criteria upon which species are classified as territorial is unclear, as not all studies have demonstrated that all or parts of home ranges are defended. In addition, most studies on reef fish behaviour have been restricted to the more site attached species in small reef fish families such as the damselfishes.. 1.5. Alternative approaches to studying home range and. territory size in reef fish Our evolving general models of the determinants of home range and territory size have been based on two different approaches, each with their strengths and limitations. The first is the comparative method in which the correlates of home range size have been compared across a range of species (Jarman, 1974, Felsenstein, 1985, Martins and Hansen, 1997, Martins et al., 2002). These comparisons can involve species in different taxa or trophic groups, or different body sizes within or among species. 25.
(27) (Jarman, 1974, Martins and Hansen, 1997). While a powerful tool for generating hypotheses, apart from Sale (1975), there has been little development of the comparative method for reef fishes. The breadth of our knowledge of home ranges and territory sizes for reef fish taxa of different body sizes, feeding groups and habitats is limited. The alternative approach has been the widespread use of experiments to manipulate factors that are potentially important in governing area requirements, such as food availability or local densities (Gill and Wolf, 1975, Hixon, 1980b, Hixon, 1981, Hixon and Brostoff, 1983, Hixon and Beets, 1989, Hixon, 1991). To date, there have been only a handful of studies which have used reef fishes as a model system for applying the experimental method (Ebersole, 1980, Hixon, 1981, Zeller, 1997, Rogers and Sargent, 2001, Kulbicki et al., 2005b, Semmens et al., 2005). The recent literature on home range size in fishes has largely been limited to the application of different methods of tagging, such as tag-recapture or acoustic tags, and quantifying the movements of particular reef fish (Holland et al., 1993, Barrett, 1995, Davies, 1995, Hilomen, 1997, Zeller, 1997, Heupel et al., 2004, Zeller et al., 2003, Kaunda-Arara and Rose, 2004b, Garla et al., 2006, Righton and Mills, 2006, Chateau and Wantiez, 2007, Wetherbee et al., 2007, Hutchinson and Rhodes, 2010, March et al., 2011, Marshell et al., 2011, Bennett et al., 2012, Knip et al., 2012, Welsh and Bellwood, 2012b). To a large extent, the concepts of home range and territory are not appropriately distinguished in the literature.. 1.6. Use of space and reef fish conservation. The realization that many coral reef areas in the world are threatened by a multitude of human impacts has provided a new impetus for understanding the home range and territorial requirements of coral reef fishes (Motta, 1989, Sebens, 1994, Wilkinson, 1999, Dulvy et al., 2003, Graham, 2007, McCook et al., 2010, Grüss et al., 2011, Babcock et al., 2012, Munday et al., 2012). Small home range size and a high prevalence of territoriality have important implications for their response to a variety of human impacts and appropriate management strategies. Strong site attachment in reef fishes appears to be strongly linked to the close association between fishes and the underlying, complex coral reef habitat. The is much evidence to suggest that the abundance of reef fishes is often dependent upon habitat structure (Luckhurst and Luckhurst, 1978a, Bell and Galzin, 1984, Sano et al., 1987, Syms, 1995, Caley and St John, 1996, Allen, 1999, Stewart and Jones, 2001, Harmelin-Vivien, 2002, Willis and Anderson, 2003) and consequently subject to variations in the physical structure of. 26.
(28) coral reefs, thereby altering the ecological processes involved in influencing the assembly, function and persistence of reef fish communities (Bell and Galzin, 1984, Caley and St John, 1996). The limited mobility of coral reef fishes appears to exacerbate the effects of habitat change, as there is little ability to move away from areas of habitat destruction or move into areas that have recovered. An understanding of the flexibility in home range and territory size will be critical to assessing the threats posed by habitat degradation and likely avenues of recovery. One of the most effective strategies for protecting reef fish biodiversity has been the introduction of no-take marine protected areas or marine reserves (McClanahan et al., 2006, Almany et al., 2009, McCook et al., 2010). Reserves often exhibit increases in the abundance and size of exploited species within their boundaries (Russ and Alcala, 1996, Emslie et al., 2008, Maggs et al., 2012). However, reserves are often limited in size and may not be effective in protecting highly mobile species (Nardi et al., 2004, Norse, 2010, Knip et al., 2012). An understanding of the home range or territory sizes of typical reef fish species is essential to gauge the minimum reserve size required to protect reef fish biodiversity (Chapman and Kramer, 1999). For species closely associated with live coral habitat, these minimum requirements may be expanding as a result of declining habitat quality, reducing the potential effectiveness of small marine reserves.. 1.7. Aims and structure of thesis. The overall aim of this thesis was to make a substantial contribution to the empirical data-base and theoretical understanding of the determinants of home range and territory size in coral reef fishes. I applied both comparative and experimental approaches to generate and test hypotheses concerning a range of factors affecting both home range and territory size in reef fishes. In the comparative studies, the goal was to extend the taxonomic database to explore the correlates between both home range and territory size, and the factors theory predicts to be important, including body size and trophic status. In addition, I focussed on factors that may specifically apply to coral reef environments such as depth, coral cover and habitat complexity. Experimental studies focussed on the potential roles of food availability and local population density as determinants of territory size. Finally, I use this data to evaluate long-standing assumptions concerning the prevalence of small home ranges and territoriality in reef fishes, and discuss those implications for reef fishes in relation to response to declining coral reef resources and current management strategies.. 27.
(29) The thesis is divided into 4 chapters: Chapter 2 – Multiple correlates of home range size within and among species of coral reef fish. This chapter takes a comparative approach to examine the correlates of inter-specific differences in home range size of representative species from a range of reef fish families and trophic groups studied at Lizard Island. Specifically, I examined the role of body size, depth, rugosity and the proximity of an individual to the substrate as possible determinants of home range size. Chapter 3 – Determinants of home range and territorial behaviour in coral reef damselfishes (family Pomacentridae). Territoriality is thought to be particularly prevalent in highly site attached reef fishes such as damselfishes. Damselfishes may defend a range of resources including food, shelter and requisites for reproduction. When competing for such resources, some coral reef fish will defend access to resources in an effort to exclude competitors. This chapter examined the prevalence of territorial behaviour and the correlates of territory size for a range of pomacentrid species at Lizard Island (Great Barrier Reef). As in Chapter 2, it focussed on the roles of body size, depth, rugosity and the proximity of an individual to the substrate as possible determinants for home range and territory size. Chapter 4 – Contrasting effects of food supply and population density on territorial behaviour in an herbivorous damselfish. Food supply and population density are the two most cited factors affecting territory size in animals. However, on a handful of studies on reef fishes have addressed these factors and their relative importance. Here I examined differences in territory size at high and low population density conditions in populations of the black-vent damselfish, Dischistodus melanotus. In addition, series of manipulative experiments in which food supply was both increased and decreased, and local population density was reduced, were carried out to test their effects on the prevalence of territoriality and territory size. Chapter 5 – Role of coral cover in determining home range use and territorial behaviour of coral reef butterflyfishes (family Chaetodontidae). Corallivorous butterflyfishes are closely associated with healthy coral reef habitat (Roberts et al., 1988). Home ranges are associated with patches of live coral and they often use particular core areas within their home ranges. However, their ability to adjust home range size in response to changes in coral cover is unknown. This chapter examine the nature of core activity areas within butterflyfish home ranges and territories, and documented changes in territory size in response to food abundance and population density.. 28.
(30) Chapter 6 – General Discussion This final chapter ties together key concepts presented through the previous chapters. It is here that I draw links between observations from experimental studies to already developed models of behaviour and discus the importance of recognising coral reef fish as a separate group when theorising on home range and territorial behaviour.. 29.
(31) Number of Published Studies. 6 5 4 3 2 1. 1958 1971 1973 1974 1975 1977 1978 1979 1980 1981 1982 1983 1990 1991 1992 1993 1994 1995 1996 1997 1998 1999 2000 2001 2002 2003 2004 2005 2006 2011 2012. 0. Year Figure 1.1 A summary of the number of coral reef associated fish home range studies published from 1958 to the present time (refer to Appendix 1 for studies included).. 10 9. Number of Studies. 8 7 6 5 4. 3 2 1 0. Family Figure 1.2: A summary of the number of coral reef associated fish home range studies per family.. 30.
(32) 1000000. y = 224.32x - 851.3 R² = 0.08. Home Range Area (m2). 100000 10000 1000 100 10 1 0. 20. 40. 0.1. 60. 80. 100. 120. Body Size (cm). Figure 1.3: The relationship between the home range area of coral reef associated fishes and their body size, for all species with published data since 1958. Data is presented on a log scale with base 10.. 31.
(33) CHAPTER 2. Multiple correlates of home range size within and among species of coral reef fishes 2.1. Abstract. Comparative studies have played a major role in formulating and testing hypotheses in behavioural ecology, identifying the key role of body size, trophic status and habitat characteristics in explaining variation in home range size. However, few such studies have addressed the determinants of home range size in coral reef fishes, which tend to have much smaller ranges than terrestrial vertebrates. The aim of this study was to estimate diurnal home range sizes within and among 24 species from 10 commonly present families of coral reef fishes, representing different body sizes, trophic groups and local habitats at Lizard Island (Great Barrier Reef). Home range sizes varied from 0.5 m2 in the territorial damselfish Pomacentrus chrysurus to 350 m2 in the butterflyfish Chaetodon melannotus, with an overall average of ~60 m2. Home range sizes differed among the families studies, being highest in the butterflyfish (Chaetodontidae), emperors (Lethrinidae) and rabbitfishes (Siganidae), and lowest in the damselfishes (Pomacentridae). This appeared to reflect both trophic position (with home ranges largest in corallivores, macro-carnivores and roving herbivores, and smallest in planktivores) and body size (with home ranges larger for typically larger species). Within species, home ranges were commonly found to increase with body size and proximity to the substratum and to decrease with topographic complexity. However, there were no general rules and much of the variation in home range size among species and individuals was unexplained. The small home ranges of most reef fishes closely associated with complex reef habitats makes them particularly sensitive to habitat degradation, as they are likely to have limited ability to relocate following local disturbances. The extremely small home ranges of most species means that they will be effectively protected inside marine reserves of most sizes, provided habitat structure can be maintained.. 32.
(34) 2.2. Introduction. An individual’s home range, or the area it moves through every day, provides essential clues as to how it interacts with and responds to the local environment. Decisions as to the location and size of home ranges form a central component of modern behaviouralecological theory (Brown, 1975, Alcock, 1979, Krebs and Davies, 1981, Krebs and Davies, 1997). A home ranging individual gains familiarity with the location of critical resources such as food and shelter, and it can have a competitive edge over transient or nomadic individuals in terms of growth or survival and reproduction (Brown, 1964, 1970, Kramer and Chapman, 1999, Jones, 2005b). Home range sizes vary considerably throughout the animal kingdom (Kramer and Chapman, 1999, Parsons et al., 2003), from the Attwater's Pocket Gopher, Geomys attwateri, with a home range of 0.1 m2 (Swihart et al., 1988) to the Cassin’s Auklet (seabird), Ptychoramphus aleuticus, which roams 900 km2 of the North Pacific (Adams et al., 2004). Much attention has been given to finding explanations for variation in home range size, within and among species, particularly in birds and mammals, for which most of the theory has been developed. Empirical research and theory has linked variation in home range size to a number of life history traits and ecological factors. An almost universal positive relationship between home range size and body size (Storm, 1965, Urban, 1970, Bailey, 1974, Simon, 1975, Lindzey, 1978, Hornocker and Hash, 1981) is associated with the increasing metabolic demands associated with a larger body size (McNab, 1963, Schoener, 1968, Schoener, 1974, Schoener, 1983b, Schoener, 1987). Metabolic demands also vary with trophic status, and home ranges of predators are generally larger than herbivores (Harestad and Bunnell, 1979, Peters, 1983, Gaston, 1990). Home range size may also vary with habitat features and local resource availability. For example, animals living in more structurally complex forest habitats tend to have smaller ranges than their open savannah relatives (Crook and Gartlan, 1966, Jarman, 1974, Harestad and Bunnell, 1979, Minns, 1995). Moreover, individuals will tend to have smaller home ranges in areas of greater food availability or productivity (Sale, 1969, Nomura and Higashi, 2000, Rodrigues and Monteiro-Filho, 2000, Bellis et al., 2004). Many of these factors co-vary as a result of ontogenetic changes in body size, habitat use and diet, making the combination of factors determining home range size difficult to assess. However, comparative studies, in which home range sizes are compared within and among a range of species with different phylogenetic histories and body sizes, and species occupying different trophic positions and habitats, have proven to be the most powerful tool in detecting common processes across a range of 33.
Figure
+7
Related documents
Because of this rampant multilingualism, Tariana combines a number of features inherited from the proto language with properties diffused from neighbouring but
I acknowledge the support from all my postgraduate colleagues and friends in completing the study.. I thank all the patients for their participation &
Following epithelial differentiation, genome amplification and differentiation-dependent late gene expression were ob- served in mutant cell lines, but at a rate significantly
These results corre- lated with the in vitro binding assays, suggesting that while PCBP2 could interact with stem-loop IV RNA to form an RNP complex that was necessary to
As eye contact is one of the essential elements that affects a level of intimacy (Short, et al., 1976) in social presence, changes of camera angle from lower to a more
Data collection: SMART (Bruker, 1999); cell re®nement: SMART ; data reduction: SAINT-Plus (Bruker, 1999); program(s) used to solve structure: SHELXTL (Sheldrick, 2000); program(s)
URBAN RENEWAL AND MUTATION OF A SECONDARY CITY OF IVORY COAST: CASE OF
hypothesis differs from the so-called tired light , in which the velocity c is supposed to vary during the journey of photons in the empty space for some frictional mechanism.
