Numerical Modelling of Mining
Subsidence
A dissertation submitted by
Mr Kieran Robert. Seccombe
In fulfilment of the requirements of
ENG4111/4112 Research Project
Towards the degree of
Bachelor of Engineering (Civil)
Submitted: 30/10/2014
i Subsidence due to the implementation of underground mining has caused significant damage to the environment. Subsidence is an important issue in the mining community and is caused largely by the longwall mining techniques employed to extract coal. Subsidence has always been associated with longwall mining, and has become the predominate issue
Due to the high extraction rate surrounding the longwall method, it invariably causes rapid subsidence within the geological strata (Booth et al. 1998). The stress fractures that occur as a result of the collapsed goaf, propagates to the surface producing a depression or dip in the soil profile. A case study was completed on a Rio Tinto mine called Kestrel which is located near Emerald, QLD. Being provided some the required information allowed for a numerical model to be generated in FLAC 2D. This project aimed to develop a numerical model within FLAC to accurately measure and model subsidence. This is due to the fact that numerical models are extremely important when dealing with large complex problems. The department of mineral resources requires numerical models for subsidence to accurately assess the viability of mining in that associated area. Through the use of FLAC 2D it was possible to develop a methodology that was applicable to all single longwall scenarios. The geometry and material properties of the model are the only values required to be changed within the methodology to suit a new model. The graphical interface in FLAC was used as it is user friendly and more applicable for initial analysis of subsidence of soils. This methodology can be extended to the use of other geotechnical subsidence applications.
ii interface should be used as it has been found to model joints, discontinuities and bedding layers far more effectively.
In summary,
The results obtained were not of the magnitude as provided by published works and real time monitoring data.
The methodology was proved to be accurate with very similar subsidence and displacement profiles.
iii I certify that the ideas, designs and experimental work, results, analyses and conclusions set out in this dissertation are entirely my own effort, except where otherwise indicated and acknowledged.
I further certify that the work is original and has not been previously submitted for assessment in any other course or institution, except where specifically stated.
Kieran Seccombe 0061019527
iv The Council of the University of Southern Queensland, its Faculty of Health, Engineering & Sciences, and the staff of the University of Southern Queensland, do not accept any responsibility for the truth, accuracy or completeness of material contained within or associated with this dissertation.
v I would like to thank Dr Jim Shiau (Senior Lecturer, Geotechnical Engineering) for all his help and support with this project. His understanding of geotechnical engineering and numerical modelling has been paramount in the completion of this project.
I would like to thank Andrew Seccombe (Geotechnical Engineer – Rio Tinto) for all his advice and stern encouragement to get the job done.
Kestrel Mine has played a large part in my understanding of longwall mining. Their generosity permitted me to ask many dumb questions on the site visit to the mine. The information provided was very useful in the generation of the numerical model and for that I thank them very much.
vi
Abstract ... i
Candidates Certification... iii
Disclaimer ... iv
Acknowledgements ... v
Table of Contents ... vi
List of Figures ... xi
List of Tables ... xiii
List of Appendices ... xiv
Introduction ... 1
Chapter 1 1.1 Background Problem and Objective ... 1
1.1.1 Objectives ... 2
1.1.2 Available Resources... 3
1.1.3 Limitations of Numerical Modelling ... 3
1.2 Methodology ... 4
1.3 Potential Applications ... 5
1.4 Risk Management ... 5
Literature Review... 7
Chapter 2 2.1 Chapter Overview ... 7
2.2 Background of Underground Mining ... 7
2.2.1 Bord and Pillar ... 8
2.2.2 Longwall mining ... 9
2.3 Subsidence ... 10
2.3.1 Background ... 10
2.3.2 Impacts ... 11
vii
2.3.5 Extraction Area ... 15
2.3.6 Geological Strata ... 16
2.3.7 Subsidence Factor ... 17
2.3.8 Inflection Point ... 18
2.3.9 The Angle of Critical Deformation ... 18
2.4 Summary of literature ... 19
2.4.1 Keilich (2009) ... 19
2.4.2 Singh & Yadav (1994) ... 20
2.4.3 Peng, Luo & Zhang (1997) ... 20
2.4.4 Karmis & Aqioutantis (1999)... 20
2.4.5 Lloyd, Mohammad & Reddish (1997) ... 21
2.4.6 (Bell, Stacey & Genske 2000) ... 21
2.4.7 (Booth et al. 1998)... 22
2.4.8 Applications for Subsidence Management Approvals (2003) ... 22
2.4.9 Code of Practice: Ground Control for Underground Mines (2011) ... 23
2.4.10 Hawkes (2010) ... 24
2.4.11 Vakili, Albrecht & Gibson ... 24
2.5 Summary of Review ... 24
Kestrel Mine Case Study ... 26
Chapter 3 3.1 Chapter Overview ... 26
3.2 Kestrel Mine Geological Environment ... 26
3.2.1 Geological Background ... 26
3.2.2 Site Geology ... 26
3.3 Site Visit ... 27
Numerical Modelling of Longwall Panel ... 29
viii
4.2.1 Boundary Conditions ... 30
4.2.2 History Plots... 30
4.2.3 Model Development... 31
4.2.4 Material Properties and Geometry ... 31
4.2.5 Young’s Modulus... 31
4.2.6 Bulk Modulus... 32
4.2.7 Shear Modulus ... 33
4.2.8 Cohesion ... 34
4.2.9 Ultimate compressive strength ... 34
4.2.10 Tensile Strength (MPa) ... 34
4.2.11 Layer Thickness (m) ... 35
4.2.12 Bedding/Layer Discontinuities ... 38
4.3 Mechanics of Materials ... 38
4.3.1 Constitutive models ... 38
4.3.2 Elasticity analysis... 38
4.3.3 Plasticity analysis ... 39
4.4 FLAC Theory and its Application to Subsidence ... 39
4.4.1 Finite Difference ... 39
4.5 Developing the longwall in FLAC ... 40
4.5.1 Symmetry within the model ... 41
4.5.2 Assumptions ... 43
4.6 Modelling process ... 45
4.6.1 Grid Generation ... 45
4.6.2 Material Properties and layer dimensions ... 45
4.6.3 Boundary Conditions ... 49
ix
4.6.6 Solving for equilibrium ... 49
4.6.7 Parameter Study ... 49
4.7 The Final Model ... 50
Results and Discussion ... 53
Chapter 5 5.1 Chapter overview ... 53
5.2 Comparison of results ... 53
5.2.1 Vertical Displacement ... 54
5.3 Model Verification ... 58
5.4 Inputs and reasoning ... 58
5.4.1 Layer dimensions ... 58
5.4.2 Tensile Strength ... 59
5.4.3 Boundary conditions ... 59
5.4.4 Initial Conditions ... 59
5.4.5 Excavated null region ... 59
5.4.6 Coal Seam ... 60
5.5 Expected outcomes ... 60
5.6 Discussion of Results ... 63
5.7 FLAC properties – Model 1 ... 64
5.7.1 FLAC Material Properties and Depths ... 64
5.7.2 Vertical Displacement Profile – Model 1... 65
5.7.3 Subsidence Profile ... 66
5.7.4 Plasticity index and range ... 66
5.8 Literature/Published results – Model 2 ... 72
5.8.1 Material properties of Literature ... 72
5.8.2 Vertical Displacement Profile ... 72
x
5.9 Kestrel Results - Model 3 ... 79
5.9.1 Vertical Displacement Profile – Model 3 ... 79
5.9.2 Subsidence Profile ... 80
5.9.3 Plasticity index and range ... 80
5.10 Summary of Results ... 86
Conclusion, Recommendation and Future work ... 88
Chapter 6 6.1 Chapter Overview ... 88
6.1.1 Review of Problem ... 88
6.1.2 Numerical Modelling ... 89
6.2 Conclusions ... 91
6.3 Recommendations and Future Work ... 91
6.4 Summary ... 93
References ... 94
Bibliography ... 97
Appendix A – Project Specification ... 98
Appendix B – Symmetry Code ... 100
Appendix C – Generic Model ... 101
Appendix D – Output relationships ... 102
Appendix E – Kestrel Information ... 103
Appendix F – Final Geometry Script ... 106
Appendix G –Model 1 FLAC Script ... 107
Appendix H – Model 2 published work Script ... 108
xi
Figure 2.1 - Bord and pillar method extracting the coal seam (Paschedag 2014) ... 8
Figure 2.2 - The longwall mining technique extracting the coal seam (Hawkes 2010) ... 10
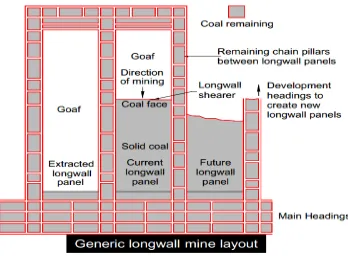
Figure 2.3 - Mine layout of multiple extracted longwall panels (The Longwall Mining Process 2014). ... 12
Figure 2.4 – Zones of the subsidence profile ('Potential Impacts from Underground Mining' 2006) ... 13
Figure 2.5 - Critical extraction area (Hawkes 2010) ... 16
Figure 2.6 - Super-critical extraction area Hawkes 2010 ... 16
Figure 2.7 - A representation of a geological strata (Singh & Yadav 1994) ... 17
Figure 2.8 - Relationship of Subsidence Parameters (Peng, Luo & Zhang 1997) ... 19
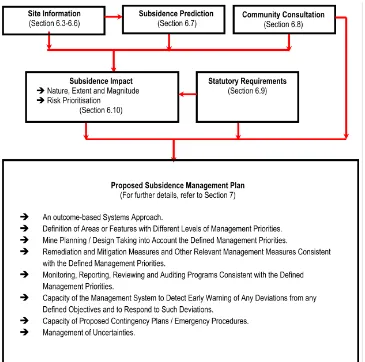
Figure 2.9 – Structure between elements of an SMP application ... 23
Figure 3.1 - Longwall Kestrel Mine (courtesy of Rio Tinto) ... 28
Figure 4.1 Vertical Displacement of Critical Element ... 30
Figure 4.2 – Single Panel Longwall Model Longitudinal Direction ... 35
Figure 4.3 - Vertical Displacement of Critical Element ... 36
Figure 4.4 - Subsidence Profile of generic model ... 37
Figure 4.5 - Basic explicit calculation cycle (FLAC 2005) ... 40
Figure 4.6 Vertical Displacement Contours in Symmetry ... 42
Figure 4.7 – Symmetry of the y stresses ... 42
Figure 4.8 - General solution procedure ... 44
Figure 4.9 - Summary of geological stratum ... 48
Figure 4.10 - Axis symmetry Model ... 51
Figure 4.11 - Excavated model ... 52
Figure 5.1 - Model displaying critical surface element ... 54
Figure 5.2 - Typical subsidence profile in FLAC ... 55
Figure 5.3 – Subsidence Profile ... 56
Figure 5.4 - Extrapolated subsidence profile ... 57
Figure 5.5 - Maximum vertical displacement profile sourced from (Keilich 2009). . 62
Figure 5.6 - General subsidence surface profile sourced from (Kratzsch 1983) ... 63
Figure 5.7 - FLAC element displacement profile ... 68
xii
Figure 5.11 - Vertical displacement from literature ... 75
Figure 5.12 -Subsidence profile from literature ... 76
Figure 5.13 - Plasticity Index from literature... 77
Figure 5.14 - Plasticity index literature ... 78
Figure 5.15 - Vertical Displacement Profile - Kestrel ... 82
Figure 5.16 - Subsidence Profile - Kestrel ... 83
Figure 5.17 - Plasticity indicator Kestrel ... 84
Figure 5.18 - Plasticity Range ... 85
Figure 5.19 - Comparison of Model displacements ... 86
xiii | P a g e
List of Tables
Table 4.1 - Young's modulus properties ... 32
Table 4.2 - Bulk Modulus ... 33
Table 4.3 – Shear modulus results ... 34
Table 4.4 - Geotechnical properties of Kestrel Mine ... 46
Table 4.5 - Corresponding layer depths ... 47
Table 5.1 - FLAC material properties ... 64
Table 5.2 - Displacements at cycle intervals ... 65
Table 5.3 - Properties of assigned materials from literature ... 72
Table 5.4 - Displacements at defined cycle steps ... 73
Table 5.5 - Kestrel data ... 79
xiv | P a g e
List of Appendices
1 | P a g e
Chapter 1
Introduction
1.1
Background Problem and Objective
The increasing demand on electricity has made way for more efficient ways of mining coal. Open cut mines can no longer be the only source of coal and as such underground techniques have been employed to extract coal from the coal seam with great efficiency. Longwall mining is currently the most efficient method of extracting the coal seam, but has also produced long term effects on the environment. Longwall mining produces a vertical displacement of the soil level called subsidence. In simple terms, subsidence is the referred to as the vertical displacement of a point from its original position (Introduction to Longwall Mining and Subsidence 2007). When considering the subsidence in the geological strata, we can consider the soil particle as the ‘point’ and the behaviour induced by the ‘vertical displacement’ as subsidence. The above stratum is under both compressive and tensile forces, depending on which zone. These forces cause impacts to structures and hydrological properties of underground water systems. It is important to be able to predict the subsidence of the longwall so as to determine mining viability and introduce contingency plans for the predicted subsidence.
2 | P a g e flow and also river catchments. The effects can cause major damage to infrastructure where primary structural members have shifted and even been removed by compressive and tensile force produced by the displacement of the natural level of the soil. Longwall coal mining has been a major cause of mining induced subsidence due primarily to the extraction method it employs. The longwall technique does not stop the roof from collapsing after the mined coal seam like the bord-and-pillar method. It is the roof collapsing that causes the cracks and stresses to propagate to the surface and cause a displacement in the soil profile known as subsidence.
The amount of damage caused by subsidence depends on the type rock strata (Uranowski & Mastrorocco), so it is necessary to develop an approach to modelling the subsidence based on the certain critical parameters. For this thesis a case study will provided on a mine site that uses the longwall mining technique. As part of the requirements for the thesis, Kestrel mine will be used as the case study to validate results. Kestrel mine is part of the Rio Tinto company and is currently using a longwall to extract the coal form the coal seam. It is important that the model developed for the use of application in subsidence, corresponds to actual data and real-time monitoring systems. It is the aim of this project to obtain this data from kestrel.
1.1.1 Objectives
3 | P a g e intervals defined as the new layer. It will be the aim of this project to determine whether the strength relaxation method can be used to accurately measure subsidence. The results obtained will be then verified by the subsidence results provided by Kestrel Mine if provided the information.
Throughout the course of this dissertation there will be site visits to Kestrel mine to witness how the longwall operates, obtain relevant field data, look at consultancy reports and make key observations on real time subsidence monitoring systems.
1.1.2 Available Resources
The Itasca FLAC modelling program will used due availability at the University of Southern Queensland (USQ) and being primarily developed for geotechnical applications. FLAC has been primarily used for analysis in the fields of mining, rock mechanics, underground engineering and research. The use of the explicit time step solution and the integration of motion equations into the program have made it ideal for the analysis of progressive failure and collapse (FLAC 2005). The FLAC programming language FISH will be used to develop a model to accurately represent subsidence incorporating the key input parameters.
1.1.3 Limitations of Numerical Modelling
There a some general limitations outlined in (Keilich 2009) for numerical modelling. The below is a summary of the current limitations in the predictive capabilities.
Elastic soil models are considered to be inaccurate to model due to the need to make unrealistic changes to the properties of the soil to align with observed subsidence profile.
4 | P a g e
FLAC has also been observed to produce jumps in subsidence at transition zones between subcritical and critical.
The use of Mohr-coulomb constitutive modelling is limited when considering the bedding joints associated with the different geological layers.
1.2
Methodology
There are 5 major parts that will be addressed in this project
The first part (Chapter 1) will provide a risk assessment and management on the project. It will highlight potential hazards and risks associated with this project. A literature review of articles relevant to the project will be summarised.
The second part (Chapter 2) will be to provide a background description of the longwall mining and the bord and pillar method. There will be a detailed discussion on subsidence theory and the impacts that are associated. The critical parameters will be identified and discussed.
The third part (Chapter 3) will focus on Kestrel mine and information provided such as the mine plan layout, geological data and existing subsidence models
The fourth part (Chapter 4) this will provide in detail the methodology used for the development of the numerical model in FLAC.
The fifth part (Chapter 5) will be a discussion of results and comparing results obtained with actual results. Conclusions and recommendations will be made in relation to future use of the model.
5 | P a g e
1.3
Potential Applications
It is expected that this project will provide a running model for subsidence in FLAC for future use.
Determine whether the force relaxation process for underground stability is an accurate technique for modelling mining induced subsidence
Have a physical interface for the model for future applications.
1.4
Risk Management
Risk management is considered as the logical and systematic approach to the uncertainty of hazards in the workplace. It is designed to change societies view on workplace health and safety (Fulcher 2010). Under the Workplace Health and Safety Act 2011 (QLD) the main objective is to provide a nationally consistent framework to secure the health and safety of workers and workplaces. It is used with diligence to protect workers and other persons against harm to their health, safety and welfare through elimination of risks.
For the purposes of this project there are requirements that need to be met to attend Kestrel mine in Emerald, Queensland for a site visit. It is important especially in a work environment to ensure compliance with all the safety regulations that are in place. To minimise the risk for harm, training was provided for all visitors and employees on site. Rio Tinto already has a comprehensive knowledge of all the risks associated with the mine site hazards and has taken detailed steps to prevent harm. No harm should occur on the mine site if all the procedures outlined in Rio Tinto’s risk management plan are followed.
7 | P a g e
Chapter 2
Literature Review
2.1
Chapter Overview
This chapter addresses background and theory into the mining induced subsidence. There are many scholarly articles that address the inherent complexities of modelling subsidence and provide simplistic approaches to solve numerically in a variety of programs. This chapter will discuss the impacts of subsidence on environmentally sensitive areas and provide a detailed analysis of the main parameters used in modelling subsidence. The FLAC program will be revised and a review of its capabilities for modelling the discontinuities inherent in subsidence will be addressed.
2.2
Background of Underground Mining
8 | P a g e
2.2.1 Bord and Pillar
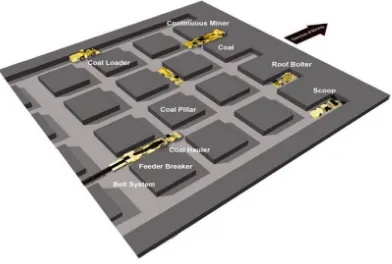
[image:23.595.75.467.393.657.2]The bord-and-pillar method is the oldest form of underground mining (NSW Mining Methods 2013). According to (University of Wollongong) the fundamental concept behind this technique is the division of the coal seam into blocks separated by what are known as cutthroughs. These cutthroughs are used to provide access to machinery and coal conveying to the surface. The method progressively cuts through the coal seam, whilst leaving behind pillars of coal to hold up the above overburden (NSW Mining Methods 2013). The pillars left behind to hold up the roof are made of coal, causing a reduction in coal extraction. Figure 2.1 shows the method of extracting coal with the use of the pillars. This method of extraction has been on the decline due to the more efficient longwall mining method.
9 | P a g e
2.2.2 Longwall mining
The longwall mining method is a relatively new and started to develop mechanically in the early 1970s. The longwall is now used predominately in the resource industry due to its efficiency at extracting the coal form the coal seam. Around 75-80% of coal is extracted from the coal seam using the longwall method (World Coal Association 2007). The longwall consists of a series of hydraulic roofs that are used to hold up the immediate rock strata to prevent collapsing. The longwall uses mechanical shearers to cut through and along the coal face (underground mining method). As the longwall progresses through the coal seam, the overburden immediately collapses behind the longwall. There is no attempt to stop this collapse from occurring. The longwall face is around 150-350m in length and the extracted seam length is usually kilometres long (World Coal Association 2007).
10 | P a g e Figure 2.2 - The longwall mining technique extracting the coal seam (Hawkes 2010)
2.3
Subsidence
2.3.1 Background
In simple terms, subsidence is the referred to as the vertical displacement of a point from its original position (Introduction to Longwall Mining and Subsidence 2007). When considering the subsidence in the geological strata, we can consider the soil particle as the ‘point’ and the behaviour induced by the ‘vertical displacement’ as subsidence. According to (Kay 2012) subsidence is defined gradual sinking of landform as a result of external forces. Longwall mining can be considered the external force that will induce subsidence.
11 | P a g e that when the void collapses from the overburden, ‘The mechanism progresses towards the surface and the affected width increases so that at the surface, an area somewhat larger than the extracted panel of coal undergoes settlement’ (Introduction to Longwall Mining and Subsidence 2007). There has been a consensus with the authors of subsidence papers that the extent of surface subsidence cannot be greater than the extracted coal seam.
2.3.2 Impacts
Due to the high extraction rate surrounding the longwall method, it invariably causes rapid subsidence within the geological strata (Booth et al. 1998). The stress fractures that occur as a result of the collapsed goaf, propagates to the surface producing a depression or dip in the soil profile. According to (Booth et al. 1998) the strata that is subjected to subsidence undergoes fracturing, expanding joints and separating of the bedding planes, causing an increase in porosity and permeability. As a result the rock stratum above the longwall has a reduction in hydraulic properties causing a change in hydraulic head and gradient. The resulting impacts can be serious, where there is complete loss of surface flow, reduction to reservoirs and water quality (McNally & Evans). The complex nature of subsidence occurring from longwall mining is explained as having a differential in displacements causing compression and tension sections in the same zone or layer causing large strains. It is the according to (Bell, Stacey & Genske 2000) that the induced strains cause the most damage to the infrastructure. Further investigations have been used using data gathering tools and positioning systems, primarily known as the Geographic Information Systems (GIS). The longwall subsidence causes both short and long term impacts to the environment. The amount of damaged caused by the longwall depends on the topography of the region (Uranowski & Mastrorocco). Many of the scholarly articles in relation to the impact of longwall subsidence focus on the hydrological effects.
12 | P a g e building being affected, such as the inability to open and shut doors. Structural damage refers to the situation where entire foundations are affected and key structural members are damaged. All three of these classifications have been applied to buildings subjected to longwall subsidence ('Potential Impacts from Underground Mining' 2006). Due to the forces surrounding the profile of the subsidence the damage to a structure depends on the position relative to the subsidence. For example the buildings above the maximum subsidence are subjected to compressive forces and the foundations have been known to buckle and shift. The structures that are situated in the inflection or tensile zone of the profile are subjected to cracks in the foundation of walls and separation of key structural elements.
The longwall extraction technique involves multiple panels progressing underground with a short distance of the old excavation. Many empirical results have shown that multiple longwalls amplify the subsidence profile. Figure 2.3 is a graphical depiction of the multiple extraction panel process.
[image:27.595.87.435.410.667.2]13 | P a g e
2.3.3 Theory
According to (Singh 1986) longwall subsidence is very complicated phenomenon to predict. The phenomenon can be understood by studying the behaviour of the overburden movement, the final subsidence profile, and the surface movements that occur ('Potential Impacts from Underground Mining' 2006).
[image:28.595.124.536.332.606.2]The subsidence profile shown in figure 2-3 provides a visual representation of the important zones that provide detailed look at the behaviour of the rock strata. The ground movements caused by the collapsed longwall have both vertical and horizontal movements. According to ('Potential Impacts from Underground Mining' 2006) the greatest vertical displacement occurs at the centre of the trough. The profile of subsidence continues to decrease until the natural layer of the top soil is undisturbed. The horizontal movement occurs also within the trough of the subsidence. As the soil particles become closer to the centre of the through the distance between the particles reduce and cause compressive nature at the surface as shown in Figure 2.4.
Figure 2.4 – Zones of the subsidence profile ('Potential Impacts from Underground Mining' 2006)
14 | P a g e and is the defining force that affects subsidence ('Potential Impacts from Underground Mining' 2006).
In the field of mining subsidence the accurate modelling and prediction of subsidence requires critical parameters. According to (Peng, Luo & Zhang 1997) the most commonly used parameters include: subsidence factor, angle of draw, critical width, offset distance of inflection, angle of full subsidence, angle of major influence and angle of critical deformation. This is confirmed in (Singh 1986), where the same parameters are considered necessary for the accurate modelling of subsidence.
Alternatively according to (Keilich 2009) there are three main input parameters that need to be considered for the accurate measurement of maximum subsidence. These parameters include the extracted seam thickness, depth of overburden and the width of the excavation. It was also stated in (Hawkes 2010) that the main influencing parameters are the coal seam thickness and the height of the strata between the coal seam and the surface, angle of draw and the subsidence factor.
A clear focus of parameters has been defined by the scholarly articles. The parameters that will be used are listed:
Angle of Draw
Extraction area ratio
Geological strata
Subsidence factor
Inflection point
Angle of critical deformation
2.3.4 Angle of Draw
The angle of draw is considered the most important parameter in the prediction of subsidence. The angle of draw is defined as:
15 | P a g e This means that the very edge of the coal seam has a line drawn towards the surface where the subsidence has ceased and the top soil is at its natural level before the mining began. Figure 2.3 shows the angle of draw clearly as the angle representative of the edge of the extracted coal seam to the point of no subsidence. The ‘point’ of no subsidence is almost impossible to locate. The angle of draw has many different documented values and varies by a large amount depending on which research article cited. 25-350 is usually the value of the angle of draw; however, it has also been recorded from ranges of 4 – 450 (Peng, Luo & Zhang 1997).
2.3.5 Extraction Area
The empirical relationship between the maximum subsidence and the extracted coal face or the width-to-depth ratio has been the bases of many of the calculations to obtain the profile of subsidence. According to (Karmis & Agioutantis 1999) there are two major parameters that rely on the width-to-depth ratio. The first is the maximum subsidence factor and the second is the inflection point. Both of these parameters are in themselves essential for the accurate modelling of subsidence.
In general there are three areas of extraction area classification that directly affect the subsidence profile. These three classification extraction areas are called:
Sub-critical extraction
Critical extraction
Super-critical extraction
16 | P a g e super-critical condition rather than just on maximum point. Figure 2.5 shows the critical
extraction area with only one point at maximum subsidence. Figure 2.6 shows the
maximum subsidence occurring along points across the plane. These two figures in essence represent the main difference in classifications.
Figure 2.5 - Critical extraction area (Hawkes 2010)
2.3.6 Geological Strata
17 | P a g e formation of sedimentary rocks. The parameter that is hardest to incorporate into the model is the rock strata. Due to the discontinuities inherent in the rock strata it is very hard to model in a continuum fashion. The disjointed non-homogenous layers provide varied results with current predicative models (Keilich 2009).
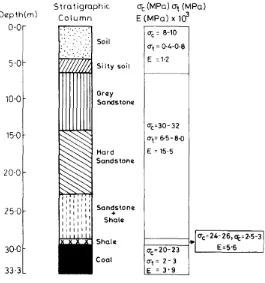
Figure 2.7 - A representation of a geological strata (Singh & Yadav 1994)
2.3.7 Subsidence Factor
18 | P a g e
2.3.8 Inflection Point
The inflection point is defined as the point where the concave shape of the subsidence profile turns to a convex shape. It is determined that the concave part of the profile represents the compressive forces that are associated with the stresses and strains. The further into the centre of the profile the greater the compressive force that is applied. At convex part of the profile shape the geological strata and the surface are under tensile forces. It has been assumed according to (Peng, Luo & Zhang 1997) that the inflection point is one half the possible maximum subsidence. They continue to state that the method of the one half the possible maximum subsidence is incorrect if it is in subcritical conditions. The inflection points are shown in Figure 2.8.
2.3.9 The Angle of Critical Deformation
19 | P a g e Figure 2.8 - Relationship of Subsidence Parameters (Peng, Luo & Zhang 1997)
2.4
Summary of literature
2.4.1 Keilich (2009)
20 | P a g e
2.4.2 Singh & Yadav (1994)
This is a journal article from the Indian Institute of Technology and it discusses the problems that occur due to longwall subsidence. The article states that the reason for the collapse of the coal mines in India have been due to the thickness of the coal seam at a shallow depth. This has promoted the development of subsidence modelling for cases of rigid and flexible overburdens. The journal article concluded the maximum subsidence could be very useful in locating the most critical zone affected by longwall mining. It was explained that the profile of subsidence did not match the model due to site factors not incorporated into the model.
2.4.3 Peng, Luo & Zhang (1997)
This is a journal article that explains the critical parameters that must be considered for the accurate modelling of mining subsidence. This paper has accumulated information for 110 cases of subsidence in the US coal fields. The empirical equations were attempted and the critical parameters were determined. Theses parameters include the critical width, subsidence factor, angle of Draw, infection point, angle of full subsidence, angle of major influence, and angle of critical deformation. The conclusion statement declared that the subsidence parameters have a strong relationship with the height of the overburden.
2.4.4 Karmis & Aqioutantis (1999)
21 | P a g e parameters are similar to those stated in Peng, Luo & Zhang (1997). In this case FLAC was used as the program to model and validate the subsidence results.
2.4.5 Lloyd, Mohammad & Reddish (1997)
This journal article conducted research on previous subsidence results to successfully simulate surface and sub-surface subsidence in UK Coal Measure rocks due to longwall mining. The results used in the model have been validated against the Subsidence Engineer’s Handbook (SEH) surface subsidence prediction method. The Rock Mass Classification Rating (RMR) has been used to determine the characteristics of the rock structure. Fast Lagrangian Analysis of Continua (FLAC) was used as the modelling program and the subsidence was modelled in longwall models that were 400 m in depth and a length of 200 m with a coal seam of 2 m. Analyses were conducted incorporating elastic and non-linear conditions. The results determined that FLAC was accurate model to use as it was confirmed against the (SEH) for depths between 100m to 800m.
2.4.6 (Bell, Stacey & Genske 2000)
22 | P a g e
2.4.7 (Booth et al. 1998)
This Journal article explains that subsidence due to longwall mining impacts on the environment by changing the hydraulic properties of the groundwater. A seven year study of a sandstone aquifer overlying an active longwall has provided evidence to the hydrological damage. It is believed that subsidence causes increase in permeability over the longwall panel causing a major decline in water levels. It was concluded that the longwall mine subsidence has significant impacts on area that contain shallow bedrock aquifers. The most prominent impact is the drop in water level from the fractures and cracking caused by the subsidence.
2.4.8 Applications for Subsidence Management Approvals (2003)
23 | P a g e Figure 2.9 – Structure between elements of an SMP application
2.4.9 Code of Practice: Ground Control for Underground Mines (2011)
24 | P a g e
2.4.10 Hawkes (2010)
This thesis seeks to apply a simplistic approach to the modelling of subsidence by determining the critical parameters and validating the results using Arc GIS. The thesis used a step by step algorithm incorporating the critical parameters. The case study presented was the Deer Creek Mine in central Utah. GIS was able to determine the displacement of the soil profile and validate the numerical model. It was concluded that the model was accurate for a single longwall but, decreased in accuracy as the more longwall panels where used.
2.4.11 Vakili, Albrecht & Gibson
This conference proceeding discussed the use of modelling subsidence using FLAC 3D, which is a three dimensional modelling program. The conference paper presents the comparison between modelling subsidence using FLAC 3D and an elastic BE code. Multiple longwalls were modelled against the subsidence profile to see the extent of increasing the longwalls to the maximum subsidence profile. It was concluded that the FLAC program was far more suited for modelling subsidence where there was less information about the behaviour of soil.
2.5
Summary of Review
Subsidence has become a major issue that surrounds longwall mining. There needs to be numerical techniques that can effectively solve or predict potential subsidence that will occur. There are now standards that regulate mining on the basis of numerical models which therefore means the accuracy of the model and confidence of the methodology is paramount to the safe implementation of mining techniques.
25 | P a g e at the projects disposal is FLAC. FLAC has been used to calculate subsidence and will used again in this project. It is quite accurate in results, but not as specialised as UDEC when dealing with layer discontinuities.
26 | P a g e
Chapter 3
Kestrel Mine Case Study
3.1
Chapter Overview
This chapter will provide geological background and site geology for the case study in the Bowen Basin. There will be a discussion of the site visit and the information that was obtained for the use in the numerical model.
3.2
Kestrel Mine Geological Environment
3.2.1 Geological Background
Kestrel Mine is located in a relatively undeformed part of the Bowen Basin. The mine lies on the western limb of the gently dipping Talagai Syncline which plunges gently southwest resulting in a regional dip that is generally south or southeast. The site is in seismic class B with a Hazard Factor of 0.045.
3.2.2 Site Geology
27 | P a g e cream coloured tuff-like material that is siliceous in parts, overlying extremely weak, green, very clayey, rock. Generally the altered rock can be readily remoulded to a very high plasticity puggy clay.
The Fairhill Formation is not present in the drift portal area
The MacMillan formation is a marine sequence consisting of siltstone and sandstone that does not contain any coal seams. It is defined as the strata between the base of the Fairhill formation and the top of the Pleiades Upper Seam.
The German Creek Formation starts at the top of the Pleiades Upper Seam. It consists mainly of quartz lithic sandstones, silty in parts and within the project area includes seven coal seams. The seams are:
Pleiades Upper;
Pleiades Lower;
Aquila;
Tieri 1;
Tieri 2;
Corvus; and
German Creek.
The German C reek Seam splits into the upper and lower seams. The immediate floor of the German Creek Lower Seam generally consists of interbedded to interlaminated carbonaceous mudstone, siltstone and sandstone below which sandstone predominates. In the vicinity of the drifts and shaft, the distance from German Creek Seam floor to the nearest underlying sandstone is approximately one metre.
3.3
Site Visit
28 | P a g e The site had very stringent workplace health and safety which is outlined in Chapter 1. The data that was required to validate the model was not provided however, due to the confidentiality issues that arise when providing information. The only information provided can be found in appendix D. This information provided material properties and the inclusion of layer thicknesses allowing a model development to begin. The two pictures below are taken from kestrel mine courtesy of Rio Tinto. The pictures are situated near the longwall
29 | P a g e
Chapter 4
Numerical Modelling of Longwall
Panel
4.1
Chapter Overview
The numerical modelling of subsidence has been continually fraught with difficulties and uncertainties that are associated with correct use of inputs and assumptions made. There is always a need to produce assumptions and values with proper justification otherwise the model will yield poor results. This chapter provides a detailed analysis of the literature that supports certain assumptions and values.
4.2
Important Modelling Principles
There has been extensive modelling conducted around subsidence to accurately measure and simulate the surface and sub-surface due to the extraction of the coal seam (Lloyd, Mohammad & Reddish 1997). It also states that the problem needs to be conceptualised and the material properties and the parameters are necessary for the investigation. Due to the nature of the investigation the only way to provide a certain accurate analysis is to hold real time monitoring data and cross reference the results to ensure confidence within the model.
30 | P a g e discrepancies with the subsidence profile that is observed. This process has been dismissed due to the shallow results found. As part of my early analysis of the problem, the model did show a shallow subsidence profile which did not match observations that had been made.
Figure 4.1 Vertical Displacement of Critical Element
Figure 4.1 depicts only a subsidence of 0.227 mm over a depth of 50m and a width of 200m. This shows that the subsidence occurring under the elastic state is not accurate enough to have the predictive capabilities required to analyse potential impacts.
4.2.1 Boundary Conditions
The boundary conditions of the model are extremely important to apply correctly. According to (Keilich 2009) the model was constrained in the x-direction on the sides and the y-direction on the bottom of the model. The top of the model was left free representing the ground surface.
4.2.2 History Plots
31 | P a g e associated with (Keilich 2009) model produced history plots in both the x-direction and the y-direction. This enabled calculations for the vertical subsidence and tilt of the model.
4.2.3 Model Development
The constitutive model that was introduced in the model was the standard Mohr – Coulomb model. (Lloyd, Mohammad & Reddish 1997)
4.2.4 Material Properties and Geometry
To model a non-homogenous model within FLAC there needs to be material defined properties for the input into the graphical interface. FLAC requires the following material properties to solve for the Mohr-Coulomb block model.
Density (kg/m3)
Modulus of Elasticity (GPa)
Bulk Modulus (GPa)
Friction Angle (°)
Cohesion (MPa)
Tensile Strength (MPa)
4.2.5 Young’s Modulus
32 | P a g e
Zones Modulus of
Elasticity (GPa)
Zone 1 300
Zone 2 500
Zone 3 1000
Zone 4 4600
Zone 4a 4000
From the provided kestrel information it was determined that the modulus of elasticity was quite high meaning that plastic deformation will be hard to achieve. The information for modulus is provided below.
The zones represent the different layers associated with each modulus of elasticity.
Zone 1: Weathered altered Basalt
Zone 2: Highly weathered MacMillan Formation
Zone 3: Fresh MacMillan Formation
Zone 4: Fresh German Creek Formation
Zone 4a: Coal Measures
4.2.6 Bulk Modulus
Bulk modulus, or commonly known as the modulus of compression is a term used to describe a materials ability to resist a change in volume from an applied pressure. Bulk modulus as mentioned previously is an essential property in Mohr-coulomb failure calculation and analysis.
33 | P a g e
Zones Bulk Modulus (GPa)
Zone 1 250
Zone 2 420
Zone 3 830
Zone 4 3800
Zone 4a 3300
4.2.7 Shear Modulus
The shear modulus is a materials ability to resist a response to shear parallel to its surface. This material experience exactly opposite forces on the surface directly opposite to each other, thus inducing the shear. The information provided by Kestrel meant that there was no shear modulus. This is not a major issue however, as there is a table of output relationships outlined in Appendix D – Output relationships that can determine the value of shear given the passion ratio and the modulus of elasticity. The relationship of shear modulus to Poisson’s ratio and modulus of elasticity is provided in the equation below.
( )
Where: E = Modulus of Elasticity
v = Poisson’s Ratio
Table 4.2 - Bulk Modulus
34 | P a g e Table 4.3 – Shear modulus results
4.2.8 Cohesion
The Cohesion of the material is basically the ability for the material to bond or stay together. Cohesion is an extremely important input into FLAC as the displacements change dramatically due the cohesive nature of the material. The more cohesive the material is the greater its ability to resist displacement.
4.2.9 Ultimate compressive strength
The ultimate compressive strength is defined in (Callister & Rethwisch 2007) as the point when the material is subject to the compressive loading that causes failure in the material. The UCS is not required in the Mohr-Coulomb model and it is therefore a limitation of the model.
4.2.10Tensile Strength (MPa)
Tensile strength is the materials ability to resist the failure of tensile forces. This is generally an important property when dealing with a continuous homogenous material. It does however, become negligible when dealing with bedding layer discontinuities according to (Brady & Brown 2006).
Zones Depth
(m) Modulus of Elasticity (GPa) Poisson’s ratio Shear Modulus (GPa)
Zone 1 0-23 300 0.3 115.38
Zone 2 23-45 500 0.3 192.31
Zone 3 45-90 1000 0.3 384.62
Zone 4 90-250 4600 0.3 1769.23
35 | P a g e
4.2.11Layer Thickness (m)
The thickness of each layer is required to be imported into the model as this defines the depth of the model. The longwall will be as a single panel and be modelled in the longitudinal and transverse direction. Figure 4.2 depicts the model in the longitudinal directions with the appropriate layer properties and thicknesses. This is a generic model to which all other models will be based. The FLAC code is provided in Appendix C – Generic Model.
[image:50.595.115.523.365.702.2]The size of the model in the horizontal direction was observed to be very important in the implementation of the numerical model. This is due to the excavated region shown in Figure 4.2 producing subsidence on the very outmost element. To acquire a result that depicts the surface profile starting at zero and extending down to maximum displacement a greater width from the edge of goaf is required.
36 | P a g e
Fi
g
u
re
4
.3
-
V
er
tic
a
l
Disp
la
ce
m
en
t
o
f
Cr
iti
c
a
l
Ele
m
e
n
37 | P a g e
Fi
g
u
re
4
.4
-
S
u
b
sid
en
ce
Pro
fil
e
o
f
g
en
er
ic
m
o
d
38 | P a g e
4.2.12Bedding/Layer Discontinuities
The modelling of discontinuities of layers within the strata is very difficult to do. It is very important to distinguish between the layers as a textural element and not just partings within the layer. There is usually limited information to distinguish the two, so the layers are considered to be laid immediately on top of each other. The discontinuous nature of the model allows for the features of the rock mass to have negligible tensile strength according to (Brady & Brown 2006).
4.3
Mechanics of Materials
Generally the geotechnical problem analysis is broken up into two distinct groups, which are the stability problems and the elasticity problems. These two problems are treated in two unrelated ways.
4.3.1 Constitutive models
There are no current available numerical programs that can reproduce all of the aspects of soil behaviour now or in the near future according to (Potts, Zdravkovic & Zdravković 2001). It is then important to decide on which soil features govern the particular geotechnical problem. This will allow for a constitutive model to be chosen to best analyse the problem.
4.3.2 Elasticity analysis
39 | P a g e relationship that connects stress and strain (Chen 2013). The linear elastic analysis provides results for problems that collapse or fail, or in other words, reach a plastic state where the element cannot return to its original state. The elastic approach to solving the model requires that there three inputs. The inputs for the materials are as follows:
Density;
Shear Modulus;
Bulk Modulus
4.3.3 Plasticity analysis
When dealing with problems of stability, the analysis acknowledges the condition of ultimate failure. In other words where the material has collapsed and cannot return to its previous state. Modelling Mohr in FLAC assigns Mohr-Coulomb plasticity to the behaviour of the structure. This plasticity analysis requires more inputs for the assigned material properties. The inputs for the material are as follows (FLAC 2005):
Density
Modulus of Elasticity
Bulk Modulus
Friction Angle
Cohesion
Tensile Strength
Shear Modulus;
Dilation Angle
4.4
FLAC Theory and its Application to Subsidence
4.4.1 Finite Difference
40 | P a g e is related to (e.g. stress, or displacement). It uses the conventional large stiffness matrix to solve for the displacements of discrete elements. The FLAC user guide has stated that ‘FLAC is not a black box that will give the solution” (FLAC 2005). The behaviour of the numerical must be interpreted correctly to acquire the required results.
Figure 4.5 - Basic explicit calculation cycle (FLAC 2005)
Figure 4.5 provides a graphical example of the elastic solution being solved explicitly.
4.5
Developing the longwall in FLAC
41 | P a g e
4.5.1 Symmetry within the model
Due to the relative size of the model being solved it is not possible with the computing power assessable to undertake computations that requires 450 m in length and 250 m in height. It is therefore necessary to develop a way to reduce the computing time, whilst keeping the desired results. It was discovered early on in smaller scaled models that the results are symmetrical in nature. Using symmetrical analysis it was possible within FLAC to solve the model with exactly half the elements. According to (Keilich 2009) the main aspects of modelling and field measurement of subsidence due longwalls is the asymmetry that occurs. It goes on by detailing the need to reduce computation time by utilising the use of symmetry. The assumption was that as the model provided symmetrical properties the results obtained on the first half could then be safely extrapolated to the second half with accurate results. As such the model was reduced from 450 m in the x-direction to 225 in the x-direction. The y-direction must stay the same due to the fact that depth of the different layers are important to the model and cutting down half the size of the layers would not correspond desirably.
42 | P a g e Figure 4.6 Vertical Displacement Contours in Symmetry
The vertical displacement contours shown in Figure 4.6 depicts quite clearly the symmetry that is largely defining the model. It is then necessary to develop the model around the axis of symmetry by cutting the model down the centre of the null region of the longwall.
Figure 4.7 – Symmetry of the y stresses
43 | P a g e provided enough evidence and also accordance to many scholarly articles to use symmetry as the basis to successfully reduce the calculation times.
4.5.2 Assumptions
Follows Mohr-coulomb properties and failure
Symmetry
Average of the properties of layers
Fixed conditions
The following is a detailed process on steps taken to produce an elastic model of a longwall in the heading transverse direction and the longitudinal direction (The direction of the longwall mining).
It is important to begin with an understanding of the process of how to solve a model within FLAC. There are certain solutions steps that must be undertaken in order to be confident that the results obtain from the solved model are in accordance with the correct procedure. The step process usually undertaken for Mohr-coulomb failure analysis is as follows.
Generate grid size and add desired shape
Define material properties and constitutive behaviour and material properties
Initialise boundary conditions and initial conditions
Solve for initial equilibrium as initial elastic model
Exam the response (make sure it makes sense )
Excavate the null material
45 | P a g e
4.6
Modelling process
The following methodology is a detailed analysis of the step by step process undertaken to produce a working longwall model. As stated previously, this model will follow the general solution procedure and follow all assumption made previously in this chapter under the ‘assumptions’ heading.
4.6.1 Grid Generation
To begin we generate a grid, or an area in which the analysis will be solved. The dimensions obtained curtesy of kestrel mine provides a grid area in the realms of 450 m in the x-direction and 250m in the y-direction. It is important to note that symmetry is prevalent in this model so we can reduce the grid size to i=225 j=250. This will yield results for all relevant data checks and critical elements.
4.6.2 Material Properties and layer dimensions
46 | P a g e
Ta
b
le
4
.4
G
eo
te
c
h
n
ic
a
l
p
ro
p
e
r
ties
o
f
K
estr
el
M
in
47 | P a g e
Ta
b
le
4
.5
Co
rr
es
p
o
n
d
in
g
la
y
er
d
ep
th
48 | P a g e Table 4.5 assigns parameters to each zone. It should be noted that where no testing parameters exist for the zones, estimations of the values will be made. Tensile strength was assumed be 10% of the UCS.
Figure 4.9 shows the geological stratigraphy of the Kestrel Mine site. It should be noted that for the purpose of modelling in FLAC the average value for the bulk, shear, cohesive and tensile strength was taken for each geographical formation rather than having each individual layers.
49 | P a g e
4.6.3 Boundary Conditions
The model was constrained in the x-direction on the right hand side. The left hand side was constrained the same as the right, but was constrained in symmetry. The bottom of the model was constrained in the vertical y-direction. Outside these boundary conditions there was no consideration to the subsidence. Trial and error occurred to make sure that the boundary conditions were such that they allowed the full profile of subsidence to occur, from minimum displacement of zero to maximum displacement.
4.6.4 Initial Conditions
The gravity of 9.81 m/s2 was introduced to the model and small stain scale was selected to increase the accuracy of results.
4.6.5 In-situ Stresses
The maximum horizontal in-situ stress has been assumed to be in the range of 2-3 times the Lithostatic overburden load of 2.5 MPa per 100m depth. (SCT, 2006). For design purposes the stress ratio has been taken as σH= 2σv.
4.6.6 Solving for equilibrium
The model was then solved for an initial equilibrium so as to provide an ‘at rest model’ to compute.
4.6.7 Parameter Study
50 | P a g e 2003) and the monitoring data provided by Kestrel Mine. This parameter study is very important in verifying the reliability of the model.
4.7
The Final Model
The model can now be developed from the above methodology. The model will be configured with:
Grid generation
Axis Symmetry
Boundary condition
Initial Conditions
Material Properties
In-situ stresses
51 | P a g e Figure 4.10 - Axis symmetry Model
53 | P a g e
Chapter 5
Results and Discussion
5.1
Chapter overview
This chapter will provide a detailed analysis of the results obtained by implementing the procedure outlined in Chapter 4 – A Numerical Modelling Analysis. The results will compare current peer reviewed literature with results obtained from FLAC and will also provide results from the data obtained from Kestrel Mine. Due to the time constraints of the project and the confidentiality issue that is associated with mining data, this project does not have any conclusive data to validate the model and will therefore endeavour to produce future work into which this model can be validated.
5.2
Comparison of results
54 | P a g e
5.2.1 Vertical Displacement
[image:69.595.106.425.293.641.2]It is important to consider the most critical element when trying to model subsidence. According to (Keilich 2009) the most critical element to consider is the surface element in the centre of the extracted zone. This produces the maximum displacement and will the critical element under consideration. Figure … below shows where the most critical element for this model, which is highlighted by the circle. It can be seen that it is situated in the centre of the upper most layer of the model (considering symmetry).
55 | P a g e
Fi
g
u
re
5
.2
-
Ty
p
ica
l
sub
sid
en
ce
p
r
o
fil
e
in
[image:70.595.145.525.120.721.2]56 | P a g e
Fi
g
u
re
5
.3
–
S
u
b
sid
e
n
ce
Pr
o
fil
[image:71.595.63.455.110.735.2]57 | P a g e
Fi
g
u
re
5
.4
-
E
x
tr
a
p
o
la
te
d
s
u
b
si
d
e
n
ce
p
r
o
fil
[image:72.595.138.505.118.723.2]58 | P a g e
5.3
Model Verification
Model verification is very important in numerical models to determine whether the model is indeed accurate and can be used for future analysis. The numerical models are very good in making engineering prediction with confidence. Confidence and methodology of the model is a large part of the predictive quality associated with numerical modelling (Thacker et al. 2004).
This model has no validation data to ensure its accuracy. It is possible, however as (Thacker et al. 2004) said to be confident with the model, which can be an indication of correct methodology. The purpose of the result section is to become confident with the results obtained from the numerical model by comparing the data with peer reviewed journal articles. Confidence will also arise from the knowledge of the program, by understanding limitations and strengths of the model.
5.4
Inputs and reasoning
Once confident with the methodology, the next step is to ensure that the inputs are clearly defined and are considered reliable, so there is no ‘garbage in garbage out’. The important inputs for the models are listed below and reasoned accordingly.
5.4.1 Layer dimensions
59 | P a g e based off the known Kestrel layer thicknesses as it provided real word data to put the material properties to.
5.4.2 Tensile Strength
The tensile strength of the material was considered negligible when considered in this model as (Brady & Brown 2006) stated that when considering discontinuities in the material bedding layers the tensile strength is negligible. If the material was homogenous then the strength would be required. It was discovered that putting the defined tensile strength for each property did little if anything to the final displacement result.
5.4.3 Boundary conditions
The boundary conditions were fixed in the x-direction along the vertical face of the model and the y-direction along the horizontal bottom face of the model. These boundary conditions exactly the same as those implemented in (Keilich 2009).
5.4.4 Initial Conditions
The maximum horizontal in-situ stress has been assumed to be in the range of 2-3 times the Lithostatic overburden load of 2.5 MPa per 100m depth. (SCT, 2006).
5.4.5 Excavated null region
60 | P a g e
5.4.6 Coal Seam
Due to the fact that FLAC has difficulty in modelling many different layers, it was determined that the coal seam layer be ignored as 85% of the layer would be extracted into the null region. The decision was made also due to the fact that no dimension for the coal seam thickness was provided from Kestrel mine.
5.5
Expected outcomes
The expected outcomes from the numerical model are to output similar vertical displacement and subsidence profiles to the peer reviewed journal articles. There are three cases that will be modelled to increase the confidence of the model. The three cases are:
A model with dimensions provided by Kestrel mine and use FLAC library material properties.
A model with dimensions provided by Kestrel mine and use material properties from (Keilich 2009).
A model with dimensions and material properties provided by Kestrel mine to be further validated in future work.
61 | P a g e For an initial analysis, the model was considered as arbitrary in the sense of the material used. Figure 2.7 was used as the basis for this model as it provided geological descriptions to input in FLAC (using the FLAC material library) allowing some confidence in this initial input stage.
As a result the profiles seen in Figure 4.3 and Figure 4.4 are the result of the methodology outlined in the previous chapter. The subsidence profile is similar to that of Figure 5.6 and the vertical displacement profile resembles that of Figure 5.5 which is from a peer reviewed journal article on ‘Numerical modelling of mining induced subsidence’ (Keilich 2009).
63 | P a g e
5.6
Discussion of Results
To begin, it was necessary to ensure that the model was producing the correct profiles for the vertical displacement of the critical element and the surface subsidence. Figure 5.6 provides reference to the subsidence profile that is the consideration for many scholarly articles. The subsidence trough can be seen to have the maximum displacement at the centre of the collapsed longwall workings (goaf).
Figure 5.6 - General subsidence surface profile sourced from (Kratzsch 1983)
According to (Kratzsch 1983) the material properties are essential for the correct subsidence prediction and profile results. It was therefore necessary to determine with literature common material properties and depths to obtain the desired results.
64 | P a g e
5.7
FLAC properties – Model 1
5.7.1 FLAC Material Properties and Depths
Material Description Shear Modulus (GPa) Bulk Modulus (GPa) Cohesion (MPa) Tension (MPa) Friction Angle (Degrees) Depth (m)
Basalt 6.99 26.8 27.2 0.0 27.8 23
Shale 4.3 8.81 38.4 0.0 14.4 22
Sandstone 13.2 32.3 66.2 0.0 31 45
Siltstone 10.8 15.7 34.7 0.0 32.1 160 Table 5.1 - FLAC material properties