University of Southern Queensland
Faculty of Health, Engineering & Sciences
Infant Transport Incubator Cold Performance
A dissertation submitted by
Anthony Vadalma
in fulfilment of the requirements of
ENG4112 Research Project
towards the degree of
Bachelor of (Electrical and Electronic Engineering)
Abstract
The Mansell Infant Retrieval System is designed to be used by clinical personnel to transport under intensive-care conditions, premature or critically-ill infants to a medical centre by using either a road ambulance, fixed wing or rotary wing aircraft. The key component of the Mansell Infant Retrieval system is the Neocot which is a controlled environment capsule to accommodate the infant. This capsule needs to maintain a relatively constant internal temperature of 36 degrees Celsius.
This project tests a newly designed heating element to determine if under certain envi-ronmental conditions, the Neocot will operate in a manner complying with the current Australian standard IEC.60601-2-20. In order to pass the standard requirements, the new heater in the Neocot needs to be set at 36◦C and be able to stay within a temper-ature range of ±3◦C when the ambient external temperature was at -5◦C for a total period of 15 minutes. Once 15 minutes have elapsed, the Neocot then needs to be placed in an external ambient temperature of between 20 to 25◦C for a total period of 30 minutes. This means that in order for the Neocot to pass these requirements the internal temperature should not go above 39◦C or below 33◦C.
University of Southern Queensland Faculty of Health, Engineering & Sciences
ENG4111/2 Research Project
Limitations of Use
The Council of the University of Southern Queensland, its Faculty of Health, Engineer-ing & Sciences, and the staff of the University of Southern Queensland, do not accept any responsibility for the truth, accuracy or completeness of material contained within or associated with this dissertation.
Persons using all or any part of this material do so at their own risk, and not at the risk of the Council of the University of Southern Queensland, its Faculty of Health, Engineering & Sciences or the staff of the University of Southern Queensland.
This dissertation reports an educational exercise and has no purpose or validity beyond this exercise. The sole purpose of the course pair entitled “Research Project” is to contribute to the overall education within the student’s chosen degree program. This document, the associated hardware, software, drawings, and other material set out in the associated appendices should not be used for any other purpose: if they are so used, it is entirely at the risk of the user.
Dean
Certification of Dissertation
I certify that the ideas, designs and experimental work, results, analyses and conclusions set out in this dissertation are entirely my own effort, except where otherwise indicated and acknowledged.
I further certify that the work is original and has not been previously submitted for assessment in any other course or institution, except where specifically stated.
Anthony Vadalma
0061019356
Signature
Acknowledgments
I would like to take this opportunity to show my appreciation to the colleagues, lec-turers and family members that provided me with support during the duration of this project. I would like to however give a special acknowledgement to the following peo-ple: Dr John Grant-Thomson, manager of Wenross Holdings Pty Ltd for providing me with the opportunity to undertake this project as well as providing help and support during the duration of the project, Mr Norman Watt managing director of Wenross Holdings Pty Ltd for providing funding for the project, Mr Paul Priebbenow Quality manager, training manager and electronics engineer at Wenross Holdings Pty Ltd for also providing help and support, Dr John Leis my on-campus supervisor for providing interfacing software for the Labjack as well as help and support, lastly I would like to acknowledge Bidvest for providing the use of a temperature controlled cold truck to conduct the tests.
With appreciation
Anthony Vadalma
Contents
Abstract i
Acknowledgments iv
List of Figures ix
List of Tables xii
Chapter 1 Introduction 1
1.1 Background . . . 1
1.2 Outline of Dissertation . . . 2
1.3 Objectives . . . 3
1.4 System Description . . . 4
1.5 Australian Standards and TGA Requirements . . . 6
1.5.1 Regulating Bodies TGA and NATA . . . 6
1.5.2 Australian Standard Extract . . . 6
1.5.3 Australian Standard Interpretation . . . 7
CONTENTS vi
Chapter 2 Project Devices Review 11
2.1 Chapter Overview . . . 11
2.2 Temperature Sensor Design . . . 11
2.3 Temperature Sensing Devices . . . 12
2.3.1 Thermistor . . . 12
2.3.2 Thermocouple . . . 13
2.3.3 Resistance Temperature Detectors (RTD’s) . . . 14
2.3.4 LM35 Precision Centigrade Temperature Sensors . . . 15
2.4 Voltage Amplifiers . . . 15
2.4.1 Differential Amplifier . . . 15
2.4.2 Instrumentation Amplifier . . . 16
2.5 Data Loggers . . . 17
2.6 Noise Filtering . . . 18
2.7 Testing Programs . . . 20
2.7.1 TeraTerm Software . . . 20
2.7.2 Automating Temperature Data Retrieval Program . . . 20
Chapter 3 Neocot Standard Conformance Check 22 Chapter 4 Design, Construction and Calibration Procedures 25 4.1 Selection of Components . . . 25
CONTENTS vii
4.1.2 Voltage Amplifiers Selection . . . 26
4.1.3 Noise Filter Selection . . . 27
4.2 Construction and Software . . . 27
4.2.1 Temperature Measurement Device . . . 27
4.2.2 Automating Temperature Data Retrieval Program Design . . . . 29
4.3 Calibration . . . 30
Chapter 5 Neocot Standard Conformance Recheck 35 5.1 First Cold Test . . . 35
5.2 Additional Cold Tests . . . 38
5.3 Comparison of results . . . 45
Chapter 6 Warm-up Time Results 46 6.1 Australian Standard Extract . . . 46
6.2 Interpretation of Australian Standard Extract . . . 47
6.3 Methodology . . . 48
6.3.1 New Heater Results . . . 48
6.3.2 Previous Heater Results . . . 50
6.3.3 Comparison Of Results . . . 51
Chapter 7 Automating Temperature Data Retrieval Program 53 7.1 Background . . . 53
CONTENTS viii
Chapter 8 Conclusions and Further Work 57
8.1 Achievement of Project Objectives . . . 57
8.2 Further Work . . . 59
References 60
Appendix A Project Specification 63
Appendix B MATLAB Code 66
B.1 Averaging Code: . . . 67
B.2 TeraTerm Plotting Code: . . . 70
Appendix C Automating Temperature Data Retrieval Program 72
Appendix D Original Cold Test Report 76
Appendix E NATA Mercury Thermometer Calibration Record 80
List of Figures
1.1 Image of the Mansell Infant Retrieval System with fitted medical
equip-ment. . . 2
1.2 View from top of prototype Neocot removable heater. . . 5
1.3 View from bottom of prototype Neocot removable heater. . . 5
1.4 Two of the four heating elements that are fibre glassed to a piece of foam and attached to an aluminium backing plate. . . 5
1.5 Risk level matrix. . . 9
1.6 Risk assessment for research task. . . 9
2.1 Points in space for measuring Neocot internal temperature . . . 12
2.2 A typical Differential Amplifier used for amplification of voltage signals. 16 2.3 Representation of an Instrumentation Amplifier . . . 17
2.4 Representation of an RC Filter . . . 19
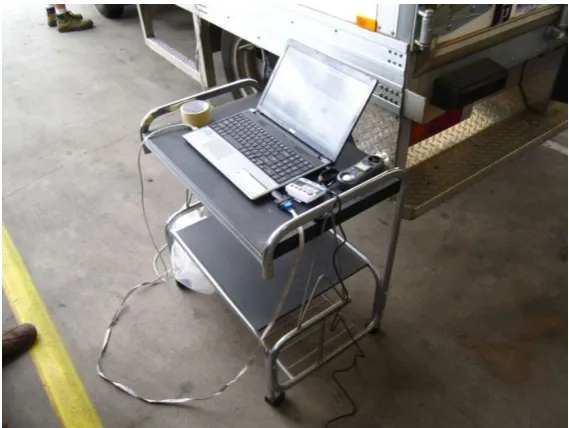
3.1 Laptop configuration for gathering of temperature data. . . 23
3.2 Neocot setup within the cold room. . . 23
LIST OF FIGURES x
4.1 Final temperature sensor prototype. . . 27
4.2 Circuit diagram of the completed temperature sensing device. . . 28
4.3 Probes placed together in plastic sleeve then submerged in salty ice water. 31
4.4 New calibration process, amplifier circuit and LabJack maintained in a temperature controlled environment. . . 31
4.5 Calibration curve of thermistor probes while LabJack and amplifier cir-cuit maintained at 36◦C. . . 32
4.6 Calibration curve of thermistor probes while LabJack and amplifier cir-cuit maintained at -2◦C. . . 32
4.7 Original calibration curve of thermistor probes . . . 33
5.1 The Neocot just before the start of the cold test. . . 36
5.2 The laptop used in logging of the data during the Cold Test duration. . 36
5.3 Graph indicating the results of the first cold test with the new temper-ature sensing device. . . 37
5.4 Temperature sensor hardware with LM35 chips and thermistors. . . 38
5.5 Final temperature sensor device with LM35 chips and thermistors. . . . 39
5.6 Calibration curve of first LM35 probe using the new calibration method. 39
5.7 Calibration curve of second LM35 probe using the new calibration method. 40
5.8 Temperature probe layouts within the cold truck. . . 40
5.9 Temperature probes positioning within the Neocot. . . 41
5.10 Stand used with the LM35 probe placed inside the cold truck. . . 42
LIST OF FIGURES xi
5.12 Neocot additional cold test results using the LM35 probes. . . 43
5.13 Location of the external ambient thermistor probe. . . 44
5.14 Neocot additional cold test results using the thermistor probes. . . 45
6.1 Variation of the internal temperature. . . 47
6.2 Five sensor array configuration within the Neocot. . . 48
6.3 Warm-up test using the new heater. . . 49
6.4 Warm-up test using the new heater time taken to increase by 11 degrees celsius. . . 49
6.5 Warm-up test using the previous heater. . . 50
6.6 Warm-up test using the previous heater time taken to increase by 11 degrees celsius. . . 50
7.1 Five sensor array used for temperature logging of Neocot. . . 53
7.2 Automation program user interface display. . . 55
List of Tables
Chapter 1
Introduction
1.1
Background
1.2 Outline of Dissertation 2
Figure 1.1: Image of the Mansell Infant Retrieval System with fitted medical equipment.
The Neocot is heated by an electric element fibreglassed into the floor; this was effective however if a fault was to occur with the heating element, the floor of the Neocot would need to be cut out, re-fibreglassed and re-painted. This was time consuming and costly which placed a crucial medical device out of action. Therefore Dr John Grant-Thomson developed a removable heater floor that houses the heating element. This allowed for ease of access should it become faulty the floor could just be unbolted and removed. For this new design to be accepted by the Therapeutic Goods Administration, the heating element and overall Neocot thermal performance, must be tested according to the IEC.60601-2-20 Australian standard.
1.2
Outline of Dissertation
1.3 Objectives 3
cold test in 2007. This section provides results obtained as well as images indicating how the instruments were setup and used. Chapter 4 provides a description on the methodology implemented during the latest set of cold tests undertaken in 2013 and 2014. Chapter 4 also provides reasons as to why certain electrical devices were selected over others for the final build of the temperature measuring device. Chapter 5 details the latest cold test results based on the requirements outlined in the IEC.60601-2-20 Australian standard. Also images and descriptions on the method in which the cold test was undertaken is included in this chapter. A comparison is also undertaken with the original cold test to the new cold test to determine the difference in outcomes between the two different heater designs. Chapter 6 provides a warm up test analysis based on the IEC.60601-2-20 Australian standard. This was undertaken for both the original heater design and the new heater design to determine the differences in the amount of time that is required for the heater to raise the Neocot temperature by a certain amount. Chapter 7 provides an explanation of the development of an automatic tem-perature data retrieval program to simplify the temtem-perature testing process of future Neocot’s. The final chapter provides a comparison between the outcomes that have been achieved in the project with the outcomes that have been stated to be achieved in the project specification.
1.3
Objectives
The objectives of the dissertation is to outline the results obtained from conducting a cold test as specified in the IEC.60601-2-20 Australian Standard. The requirements being that the Neocot must be able to stay at the normal operating temperature of 36◦C, while being placed in a cold room with an ambient temperature of -5◦C. During this period the internal temperature of the Neocot is not allowed to deviate by more than 3◦C. This must be maintained for a total period of 15 minutes after which the Neocot can be removed and placed into an environment with an ambient temperature of 25◦C. During this period the Neocot is not allowed to overshoot the normal operating temperature of 36◦C by more than 3 degrees celsius (IEC 2009).
1.4 System Description 4
• Research the requirements of the IEC.60601-2-20 Australian Standard.
• Research temperature sensing devices suitable for this application.
• Research how to properly design, construct and test an amplifier circuit.
• Design, construct and test an amplifier circuit for the required application.
• Research suitable A/D devices for the application.
• Design software to plot temperature measurement data.
• Determine the signal filter requirements for the measurements.
• Compare the results of the IEC.60601-2-20 Australian standard requirements.
As the dissertation progresses these above points will be met.
1.4
System Description
The Neocot is a temperature controlled chamber that regulates the internal chamber temperature to maintain a level suitable for an infant, with a temperature deviation of no more than ±1◦C. The average running temperature inside the Neocot is regulated at 36◦C but can be adjusted from 28◦C up to 39◦C if the Neonatal nurse wishes. The Neocot operates by calculating the average air temperature between two sensors which are situated with one at the top of the Neocot and one at the bottom. This provides temperature control information to the main board which adjusts the power output of the heating element. The heating element consists of four separate sections each of which are monitored by a heater temperature sensor. The heat from the element is transported around the Neocot by means of a fan situated under the removable floor. The fan circulates the air around the internal chamber of the Neocot.
1.4 System Description 5
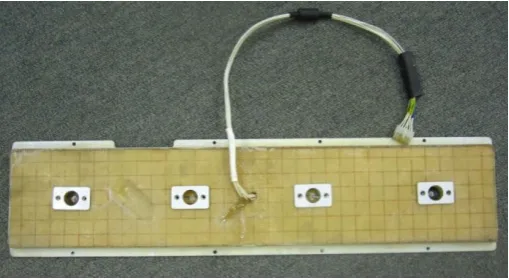
illustrates two of the four PCB heating elements that are fibre glassed to a piece of foam and attached to an aluminium plate which is then bolted into the floor of the Neocot. The construction of the heating element is as follows. Two heater element PCB boards as shown in Figure 1.4 are connected together and wired, this is then placed with a piece of foam on the back side of the heater element and the whole assembly is then fibreglassed and bonded to a piece of aluminium sheet.
[image:18.595.165.420.405.545.2]Figure 1.2: View from top of prototype Neocot removable heater.
Figure 1.3: View from bottom of prototype Neocot removable heater.
1.5 Australian Standards and TGA Requirements 6
1.5
Australian Standards and TGA Requirements
In this section the relevant Australian Standards and the requirements of the TGA (Therapeutic Goods Administration) will be analysed.
1.5.1 Regulating Bodies TGA and NATA
The TGA (Therapeutic Goods Administration) is the government body which certifies the use of medical equipment within Australia. In order for the new heating element to be approved, TGA needs to ensure that it is capable of complying with the relevant Australian standards. Other sections that need to be included are calibration certifi-cates on all the devices that had been used.
NATA (National Association of Testing Authorities) is an independent organisation that provides assurance of technical competence on device’s that require accuracy in testing, calibration and measurement (NATA 2014). An example of a NATA calibrated device is a mercury-in-glass thermometer with a calibration certificate indicating that the device has been properly calibrated according to the requirements of a standard (see appendix E).
1.5.2 Australian Standard Extract
The relevant Australian standard IEC.60601-2-20:2009 states:
1.5 Australian Standards and TGA Requirements 7
external supply and operated for a further 30 min. The transport incuba-tor temperature shall be moniincuba-tored throughout the whole test and at no time shall it go outside the specific limits. If the accompanying documents specify to meet this requirements at a lower ambient temperature then -5 (±2)◦C or for a longer period than 15 min the infant transport incubator shall be additionally tested for compliance with those claims as indicated.”
Source: Australian Standards IEC.60601-2-20:2009
1.5.3 Australian Standard Interpretation
The required standard IEC.60601-2-20:2009 indicates the requirements necessary to conduct a cold test on an infant incubator such as the Neocot (IEC 2009). The require-ments within the standard need to be met with evidence to support the conclusion and be approved by the TGA before the design can be implemented in the device. The following is an interpretation on the meaning of the standard and how the tests will be implemented.
1.6 Risk Assessment 8
increase above 39◦C.
Therefore evidence needs to be produced indicating that if a device is used to measure the temperature deviations in both the cold chamber and Neocot, the device needs to prove that it has been properly calibrated. In order to satisfy this a detailed explana-tion on how the calibraexplana-tion of the devices were undertaken will be included within this dissertation. The TGA approves calibration being completed using a NATA approved device.
1.6
Risk Assessment
1.6 Risk Assessment 9
Figure 1.5: Risk level matrix.
Source: http://www.usq.edu.au/hr/healthsafe/safetyproc/usqsafe
The matrix is used be determining firstly what the consequences of the risk would be. Next the probability in which the risk could occur is analysed. Once these two are known the intersection point between the consequence and probability produce the risk level. Using the risk level matrix Figure 1.6 was produced indicating the completed risk assessment on the task.
Figure 1.6: Risk assessment for research task.
1.6 Risk Assessment 10
Chapter 2
Project Devices Review
2.1
Chapter Overview
This chapter will undertake a literature review on the current technologies used in this project. The areas discussed are with relevance to temperature measurement with topics on different types of temperature measuring instruments such as thermistors and thermocouple’s. Due to the voltage signal being generated by these devices being extremely minute, amplifier circuits will be discussed as well as noise filtering which in the case of this project is extremely important. A brief look at Labjacks and TeraTerm software will also be undertaken.
2.2
Temperature Sensor Design
2.3 Temperature Sensing Devices 12
Figure 2.1: Points in space for measuring Neocot internal temperature
Source: Australian Standards IEC.60601-2-20:2009
The sensor point M is the crucial position for the temperature sensing as this is the point in space that is referred to in the IEC.60601-2-20 standard (IEC 2009). The other four points are air sensors which play a role in showing the distribution of temperature internally around the Neocot but are of no relevance to the section of standard focused on in this dissertation. In order for this to be achieved, the following devices were necessary to be researched: temperature sensors,data loggers,noise filters and voltage amplifiers.
The following sections provide a review on possible instruments that can be used to undertake the required temperature measurement task.
2.3
Temperature Sensing Devices
This section will discuss the different Temperature Sensing devices and determine which best suits the desired purpose in terms of accuracy and operating temperature ranges being the most crucial aspects.
2.3.1 Thermistor
2.3 Temperature Sensing Devices 13
(Ametherm 2013). Thermistors are manufactured in two different configurations. The first of which is being NTC (Negative Temperature Coefficient) and the second be-ing PTC (Positive Temperature Coefficient). The temperature coefficient refers to the manner in which the thermistor reacts to temperature, with a negative temperature co-efficient the internal resistance of the thermistor decreases as the temperature increases (Ametherm 2013) and opposite for a Positive Temperature coefficient. Thermistors are widely used in temperature measurement applications due to their compact size, cost and accuracy. A thermistor’s accuracy is generally within the range of 0.01 to 1◦C which is reasonable for most intended applications (Naik n.d.). Thermistors are also known for their extremely high sensitivity to changes in temperature (Sheingold 1980). This is very beneficial for the required application as even small changes in temperature need to be registered.
Thermistors are also non-linear in characteristics. Therefore if linearisation is required a linearising circuit needs to be used.
2.3.2 Thermocouple
2.3 Temperature Sensing Devices 14
to respond to temperature changes quickly (Sheingold 1980).
Thermocouples are very susceptible to what is termed ’parasitic junctions’. This is caused due to there being the two Thermocouple leads being of different materials then connected to a device to measure the voltage difference which consists of an again dif-ferent material. This then causes another temperature difference which is added to the original signal coming from the Thermocouple. In order to remedy this another tem-perature sensing device needs to be placed at the source and an accurate reading needs to be taken. The difference then can be subtracted and used as a base measurement (Instruments 2012a).
2.3.3 Resistance Temperature Detectors (RTD’s)
RTD’s (Resistance Temperature Detectors) are another popular form of temperature sensing devices. RTD’s operate in a very simple manner being that as the temperature increases the resistance inside the RTD increases as well. RTD’s are constructed using two different configurations being: wire wound or thin film, each with their own set of advantages and disadvantages. The most popular configuration for the RTD is the thin film construction. This is due to this configuration being less expensive, stronger and having smaller dimensions as well as being more accurate than the wirewound config-uration (Azom.com 2013).
2.4 Voltage Amplifiers 15
2.3.4 LM35 Precision Centigrade Temperature Sensors
The last temperature sensor to be analysed is the LM35 precision centigrade tem-perature sensor. The LM35 produces an linear output voltage which is proportional to the temperature being measured in degrees celsius (Instruments 2013b). LM35’s exhibit a very reasonable operating temperature range being between -55 to 150◦C. This makes it very practical to use in many temperature sensing situations. The LM35 is capable of measuring the temperature with an ensured accuracy of 0.5◦C (Instruments 2013b)which makes this temperature sensor one of the most accurate available. The main issue with an LM35 is that it contains a large amount of thermal mass similar to a thermocouple compared to for example a thermistor. This means that for an LM35 there is a longer amount of time required to reach the actual temperature. In most circumstances this lag in time is not of real concern as in this case.
One of the main benefits of using an LM35 is that the actual chip does not require calibration (Cuihong Liu n.d.). This makes it very user friendly.
2.4
Voltage Amplifiers
Most temperature sensing devices output a very low change in resistance, typically with an impact in the range of millivolts, this is quite difficult to work with and to adequately log from a data logger accurately. An amplifier circuit is then placed between the temperature sensing device and the data logger. This provides a significantly larger voltage scale to provide a more reasonable method of interpreting the data.
However there are multiple different configurations that can be used to design a voltage amplifier. While undertaking research on this topic a few configurations were detailed as being the best for the application. The following is a literature review on the configurations best suited to the application.
2.4.1 Differential Amplifier
2.4 Voltage Amplifiers 16
Figure 2.2: A typical Differential Amplifier used for amplification of voltage signals.
A differential amplifier is a simple yet effective device. A differential amplifier works by amplifying the voltage difference between the two input voltages. In the configuration indicated in Figure 2.2. The second leg acts as a preset voltage level that the first leg is then compared to, and the difference is amplified and this then becomes the output. Due to the voltage difference coming from the thermistor being extremely small compared to the preset voltage of the second leg the difference is minute. Therefore a gain is necessary to increase the voltage readings to a level so that the data logger is capable of reading and sensing the voltage.
K= Rf
R1 = R3
R2
(2.1)
HereKis the gain of the amplifier circuit. The gain is adjusted by adjusting the resistor values as specified in the equation (Circuits 2012a). The main disadvantage associated with a differential amplifier is being that in order to adjust the gain the resistors need to be continuously replaced (Circuits 2012a), for this application that is not an issue of real importance.
2.4.2 Instrumentation Amplifier
2.5 Data Loggers 17
Figure 2.3: Representation of an Instrumentation Amplifier
Instrumentation Amplifiers are just a build on from the differential amplifier configura-tion. The main difference with an instrumentation Amplifier is the adjustment of the gain value. With the previous differential amplifier resistors needed to be replaced, in this case for the Instrumentation amplifier only one resistor Rgain needs to be changed to adjust the gain of the circuit. These amplifier circuits have high accuracy and pre-cision regardless of the environment in which they are placed (Devices 2014).
When a temperature probe is connected to an amplifier circuit the output voltage that is produced needs to be calibrated to the temperature difference of the temperature probe.
2.5
Data Loggers
In order to successfully collate the measured data from the temperature sensing device a data logger is necessary. A data logger is an instrument that samples a channel every preset amount of time and collects the information (which is typically a voltage) on that channel and provides this information to another program which collates the data.
2.6 Noise Filtering 18
2.6
Noise Filtering
The use of an amplifier circuit to amplify the voltage signal from the temperature probe results in some inaccuracy. This being mainly from the fact that any noisy signal that is attached to the voltage signal coming from the temperature sensor, once it reaches the amplifier becomes amplified along with the required signal from the temperature probe. This is a problem due to the noisy signal corrupting the required signal and not producing accurate results. The noise experienced can be both generated internally in the op-amp as well as come from external sources. This is a very crucial element in the project as any noise may corrupt the signal and render the measured output data useless.
Breaking noise interference down, op-amps can experience noise interference externally from sources such as RF (radio frequency)signals and mains transmission line power. Op-amps can also generate noise internally such as Shot noise, Thermal noise, Flicker noise, Burst Noise and Avalanche noise (Instruments 2008). However these produced noises are insignificant and will not affect the output of the signal by a large amount.
There are multiple ways in which noise filtering can be achieved in this circumstance. The main types have been examined to determine which suits the requirements. Firstly due to the temperature probe needing to extend beyond the compartment of the Neocot, this means that the cable will act as an antenna for any stray RF signals. A simple way to minimise these affects is to use twisted pair cabling. When two cables are twisted together (signal and ground) and receive the same noise on each the difference between the two cables will become zero thus cancelling this signal out (INC 2001). The original signal does not become affected due to one lead having the signal while the other is grounded.
2.6 Noise Filtering 19
that is simple and effective is an RC filter.
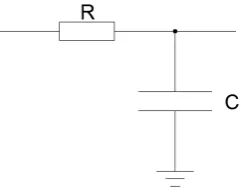
[image:32.595.231.352.288.384.2]RC filters consist of a resistor and capacitor. The resistor is connected in series with the input or output of the device and the capacitor follows shortly after connected between the resistor and the device to ground. Based on calculations for the RC filter a time delay can be calculated and adjusted depending on the requirements. For the case of this project a reasonable time delay is allowed. This is due to the rate at which the temperature being able to change inside the Neocot as well as outside the Neocot not being fast enough to warrant inaccuracies.
Figure 2.4: Representation of an RC Filter
The formula to calculate the time delay that will be experienced by this filter is:
T =RC (2.2)
High and lowpass filters can be constructed in a similar manner to an RC filter just with the placement of both R and C changing between the configurations. In a low pass configuration the resistor is placed in series with the connection to the input or output of the device and the capacitor between them to ground. Whereas with the high pass configuration the capacitor is placed in series with the input or output of the device and the resistor is connected between them to ground. If the two configurations are placed together this forms a pass band filter (Rashed 2013).
2.7 Testing Programs 20
2.7
Testing Programs
2.7.1 TeraTerm Software
In order to log the data that was being generated by the Neocot, a logging software was used. Wenross Holdings Pty Ltd had previously manufactured a temperature logger based on the 5 sensor array indicated in the IEC.60601-2-20 Australian Standard Figure 2.1. The sensor array data was processed by a program called Tera Term. TeraTerm is free to download and is designed to be an emulator on the host computer (Informer 2014). Tera Term collects the data that is being transmitted and saves this data to a file format. In this circumstance the file format is a text file. The data that is outputted from the hardware not only indicates the temperature measurements but also other aspects such as power consumed by the heater and temperature measurements from the Neocot’s internal temperature sensors.
2.7.2 Automating Temperature Data Retrieval Program
For the aid of future users a program will be developed to allow a quick and simple method of undertaking both warm and cold performance tests on Neocot’s. This will also provide a means of calibrating the temperature probes on the device. Due to time constraints a stand alone program is not practical to be developed therefore an excel visual basics for applications (VBA) program will be developed.
2.7 Testing Programs 21
with the Labjack and undertake a specific task on the data that is retrieved.
Chapter 3
Neocot Standard Conformance
Check
This chapter will outline the previous cold tests that were undertaken on the Neocot with the original heater design. These will then be compared to the Australian standard IEC.60601-2-20 (IEC 2009) and also compared to the new heater design to see the improvements.
The first cold test to be undertaken on a Neocot was on the 2nd of February 2007. The test was undertaken on Home Ice-creams premises using a supplied cold chamber. The original Neocot cold test was conducted using the original heating element. This being that the heater element was fibreglassed into the floor of the Neocot unlike the new heater element which is bolted into the floor of the Neocot.
23
[image:36.595.149.435.173.402.2]Neocot. This data was then logged using Tera Term on a laptop computer connected via an RS-232 connection. The images below illustrate the setup that was used for the original cold test:
Figure 3.1: Laptop configuration for gathering of temperature data.
[image:36.595.150.435.473.703.2]24
[image:37.595.95.488.222.424.2]Due to the cold chamber in which the cold test was undertaken not being capable of regulating a steady temperature the graph indicates a large deviation in external temperature. The reason for this was due to the cold chamber in which the Neocot was placed in was continuously heated and cooled due to the doors opening and closing. This could not be helped as the test was undertaken during work hours. The graph of the result can be seen in Figure 3.3:
Figure 3.3: Results from the first cold test undertaken at Home Ice-cream.
Chapter 4
Design, Construction and
Calibration Procedures
This section will detail the process undertaken to make decisions in order to complete the requirements of the project based on the IEC.60601-2-20 Australian standard. The device that already had been manufactured proved to not operate at the temperature range required. This being that the device was not capable of measuring temperatures below 0◦C thus was not able to be used in the cold test. This is why a new temperature sensor was required to be constructed.
4.1
Selection of Components
4.1.1 Temperature Probe Selection
4.1 Selection of Components 26
and possibly hardware to overcome this effect thus taking more time to produce the final product (Instruments 2012a). RTD’s were not chosen due to mainly their cost requirements for a suitable probe for the required application, as well as the effects of internal heating that RTD’s are susceptible to (Naik n.d.). The next best temperature sensor was the LM35 precision centigrade sensors. These were also examined but were not selected due to their cost being fairly high as well. This is why the Thermistor was selected as being the most ideal temperature probe having an excellent sensitivity and range (Naik n.d.), for the given task.
The issue with all the temperature probes apart from the RTD is that they all require the use of additional hardware such as amplifier circuits. This adds in an extra level of complexity but however with the addition of an amplifier circuit the cost effectiveness will still be better off than using an RTD.
4.1.2 Voltage Amplifiers Selection
4.2 Construction and Software 27
4.1.3 Noise Filter Selection
All the noise filters researched worked for the required task. Each was constructed and tested to determine which provided the better noise filtering ability. The simple RC filter was selected in its low pass configuration. This provided the greatest amount of noise cancellation in the area in which the tests were being undertaken. This was also proven when the device was used for its intended application at the site of testing, in which the noise filter successfully eliminated all noise inputs. Also the use of large capacitors allowed for greater noise filtering capabilities due to noise being present of a high frequency.
4.2
Construction and Software
4.2.1 Temperature Measurement Device
[image:40.595.150.436.517.736.2]After completion of research, a working prototype was built using a standard bread-board, to ensure that the selected devices operated as required. This proved successful so a final model was constructed to be used for testing the Neocot as shown in Figure 4.1.
Figure 4.1: Final temperature sensor prototype.
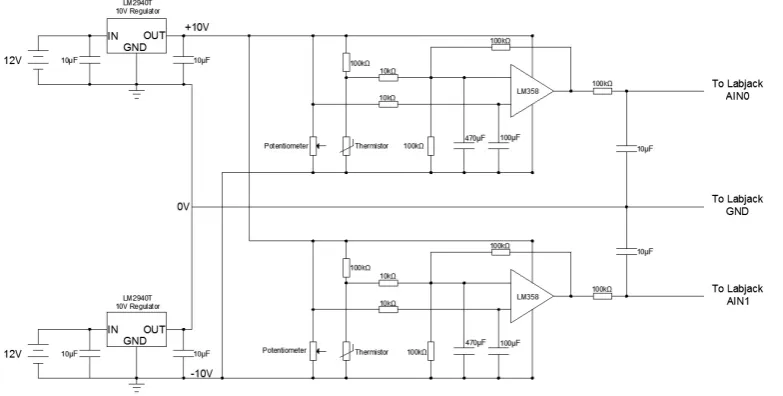
temper-4.2 Construction and Software 28
[image:41.595.98.490.139.337.2]ature sensing device.
Figure 4.2: Circuit diagram of the completed temperature sensing device.
The black box situated on top of the LabJack houses the prototyping board that con-tains the amplifier circuit. The temperature sensing device works by when the tempera-ture changes on the thermistor probe the difference in voltage signal becomes amplified in the amplifier circuit which passes that voltage signal through to the Labjack inputs. The Labjack then supplies this voltage level to a program generously supplied by Dr John Leis which logs the data and places it in an excel spread sheet.
Ter-4.2 Construction and Software 29
aTerm to graphs although averaging of the data was not required due to TeraTerm already logging data at around 0.5Hz (see Appendix B).
4.2.2 Automating Temperature Data Retrieval Program Design
The process of setting up and calibrating the device was time consuming. It was proposed that these procedures could be simplified by creating a program that au-tomatically logs the data and generates accurate plots. This would remove the need for extra steps such as running the results through a MATLAB averaging script. The automation program can sample data at a selected rate with an adequate rate for tem-perature measurement being around 0.5Hz per channel so as to minimise the amount of data being collected as temperature deviation is not that apparent.
The automation program was created from VBA programming language. This meant that as long as the computer has a Microsoft Office program (preferably Microsoft Ex-cel) this automation program will operate.
The program was required to communicate directly to the LabJack and at certain time intervals collect the temperature voltage signals coming from each channel on the Lab-Jack. In order to successfully communicate with the LabJack some VBA library code was downloaded to provide a communication connection between the LabJack and Ex-cel. This however did not work, the VBA communication code provided by LabJack did not support the UD library required therefore the LabJack could not communicate directly with Excel.
4.3 Calibration 30
for the second channel and reads the voltage. This provides a sample period of once every 2 seconds on each channel or 0.5Hz. The process is halted when the stop button is pressed.
In order to simplify the process of calibrating the temperature sensor, a calibrate button has also been included. Upon pressing this button, message boxes appear indicating steps and materials required to correctly calibrate the temperature sensing device.
4.3
Calibration
Before the temperature device can be used in testing the IEC.60601-2-20 Australian standard against the new Neocot heater the device needed to be properly calibrated using a NATA approved temperature sensor. A mercury in glass thermometer was used that had this proper calibration certificate (see appendix E). This calibration process was crucial as this provided the data that was used to generate the formulas for converting the voltage value to an equivalent temperature.
During the cold test it was decided that an additional meter should be used to provide a real time temperature read out, outside of the cold truck. Due to this device not having a NATA calibration certificate it was decided that it should be calibrated as well along with the temperature probes. In order to properly calibrate the devices at negative temperature salty ice water was used. The salt in the water reduced the freezing point of the water which meant that temperatures well below zero could be obtained. After some calculations a ratio of salt to water was calculated to provide a reasonable negative temperature.
4.3 Calibration 31
Figure 4.3: Probes placed together in plastic sleeve then submerged in salty ice water.
The minimum temperature that was capable of being obtained with the salty ice water was approximately -9◦C. This was more than adequate for the calibration process as the Neocot would only be placed in an environment of approximately -5◦C.
It was discovered that temperature fluctuations were crucially affecting the performance of the amplifier circuit. This was mainly noticeable with the thermistor probes. This meant that readings taken at different periods of the day as the ambient temperature changed would adjust the voltage signal value that was produced. In order to combat this the amplifier circuit and LabJack were placed inside the Neocot at 36◦C and left over night so as all the components were at the same steady temperature. This provided a more accurate means of calibrating the devices. Figure 4.4 illustrates the setup for the new calibration process.
4.3 Calibration 32
[image:45.595.130.452.185.385.2]A comparison was then undertaken with the LabJack and amplifier placed at different temperatures to see what the true effects were on the probes. Figure 4.5 illustrates the calibration curve produced when the LabJack was maintained in a steady stable temperature of 36◦C which is experienced during the cold test.
Figure 4.5: Calibration curve of thermistor probes while LabJack and amplifier circuit maintained at 36◦C.
When the LabJack and instrumentation amplifier were placed in a much colder envi-ronment the results can be seen to drastically change. This is illustrated in Figure 4.6.
[image:45.595.130.453.528.731.2]4.3 Calibration 33
This meant that in order to have an accurate calibration the device needed to be main-tained at the average operating temperature of 36◦C. Figures 4.5 and 4.6 contain a calculated trendline that best matches the data distribution. As can be seen by the formulas the best fit is provided from a 6th order polynomial function. With this knowledge the calibration process could begin.
With the probes placed in the salty ice water readings were conducted on the voltage signals at increments of 1◦C for the duration from approximately -6◦C to the maximum temperature required of 40◦C. The extra meter that was calibrated had its temperature readout compared to the temperature readout of the mercury thermometer which was placed in the plastic sleeve along with the probes. From this a table was produced containing offset values for certain temperatures to provide a means of quickly deter-mining what the average temperature was within the environment (see appendix F).
With the new calibration process undertaken formulas could then be produced for both of the thermistor probes. Thermistor probes exhibit a non-linearity nature which meant that a much more complex formula was obtained around the sixth order. These formu-las were used in MATLAB to generate the temperature graphs for each of the probes during the testing.
Figure 4.7 indicates the calibration graph for the thermistor probes. Due to the re-sponse of the thermistors being fairly similar and due to the thermistors not being the main testing probes just one formula was developed.
4.3 Calibration 34
Chapter 5
Neocot Standard Conformance
Recheck
This chapter will detail the method in which the cold tests were undertaken as well as the results obtained and the instruments used.
5.1
First Cold Test
5.1 First Cold Test 36
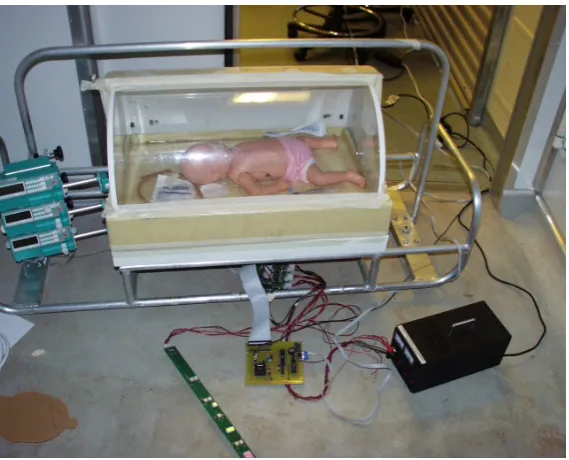
Figure 5.1: The Neocot just before the start of the cold test.
Figure 5.2: The laptop used in logging of the data during the Cold Test duration.
Figure 5.1 illustrates the Neocot setup just prior to being placed in the cold truck with all the testing equipment placed inside the Neocot and the data beginning to log. The Neosled was then slid off of the power lifter and placed inside the cold truck while at a set ambient temperature of -5◦C where it stayed for 15 minutes. Figure 5.2 illustrates the Laptop that was used in logging the data inputs from both TeraTerm and the newly developed temperature sensing device.
[image:49.595.149.434.343.557.2]5.1 First Cold Test 37
The other temperature probe was placed outside the Neocot and taped to a piece of conduit to indicate the ambient temperature inside the cold truck without temperature interference coming from the Neocot.
[image:50.595.96.487.344.543.2]The cold test was executed according to the IEC.60601-2-20 Australian standard. This being that the Neocot remained in the cold truck at -5◦C for the 15 minute duration. Upon completion of the 15 minutes the Neocot was removed from the cold truck and placed in an environment with a temperature of approximately 25◦C. The Neocot had to remain in this environment for a further 30 minutes upon which the data logging was completed (IEC 2009). Figure 5.3 shows the produced graph of data once the collected data was run through the MATLAB average code and plotted.
Figure 5.3: Graph indicating the results of the first cold test with the new temperature sensing device.
The results indicate the temperatures that were experienced both inside the Neocot during the cold test as well as the external environmental temperature. The temper-ature inside the cold truck stayed within the allowable tempertemper-ature range being -5◦C with a deviation of no more than ±2◦C for a duration of 15 minutes. Therefore this cold test can be used to justify to the TGA that the Neocot heating element has passed the requirements.
5.2 Additional Cold Tests 38
temperature for a further 30 minutes was to ensure that the temperature inside the Neocot did not overshoot the maximum allowable temperature of 39◦C.
5.2
Additional Cold Tests
Additional cold tests were undertaken on the 23rdof July 2014 using a Bidvest provided cold truck. After analysing the results from the first cold test it was decided that a more linear temperature sensor should be used to reduce the calibration equations and simplify the task of converting the voltage to a temperature. Looking back at the literature review the next best linear temperature sensor was the LM35 precision centigrade sensor. To avoid having to remove the previous functioning thermistor probes an additional section of hardware was placed on the same board using the new LM35 chips. This now meant that during the cold test four probes could be used to help produce a better understanding of the temperature within and outside the Neocot, as well as providing some redundancy should a fault occur. The calibration was then redone in the exact same manner as that indicated in the previous chapter. The difference now is that the LM35 probes being linear produce a much smaller equation. Figure 5.4 illustrates the new hardware prototyping board used with the thermistors and LM35 chips attached.
Figure 5.4: Temperature sensor hardware with LM35 chips and thermistors.
5.2 Additional Cold Tests 39
Figure 5.5: Final temperature sensor device with LM35 chips and thermistors.
Figures 5.6 and 5.7 indicate the calibration graphs for the LM35 probes. Due to each probe not being identically the same the response is marginally different. Therefore to ensure as much accuracy as possible as these probes will be the main probes during the test, a calibration graph and formula were developed for each probe. The formulas that were produced by these graphs are the exact formulas that are contained within the MATLAB code in appendix B.
Figure 5.6: Calibration curve of first LM35 probe using the new calibration method.
5.2 Additional Cold Tests 40
Figure 5.7: Calibration curve of second LM35 probe using the new calibration method.
Using these calibration graphs during the cold test also provided a means of visually comparing the voltage being displayed on the computer to a temperature on the graphs.
[image:53.595.135.455.98.278.2]During planning for the second cold test it was discovered that the placement of the original external ambient temperature sensor was not adequately measuring the tem-perature within the cold truck. It was decided that a probe should be placed well away from the Neocot out in the open were it could measure an accurate ambient tempera-ture without the effects of warm air coming from the Neocot. This meant that one of the LM35 probes were placed towards the back of the cold truck to produce a better reading of the environmental temperature. Figure 5.8 illustrates the new layout within the cold truck that would be used to produce better temperature readings.
5.2 Additional Cold Tests 41
[image:54.595.149.435.215.403.2]In total seven probes were used during the cold test, two thermistor probes and two LM35 probes. Inside the Neocot one of each of the probes were placed along with additional sensors from equipment such as a Propaq monitor, mercury thermometer and a TeraTerm probe to produce a visible display upon removing the Neocot from inside the cold truck. Figure 5.9 illustrates the positioning of the probes within the Neocot.
Figure 5.9: Temperature probes positioning within the Neocot.
The probes from left to right are Propaq thermocouple probe, LM35 probe, thermistor probe, TeraTerm probe and the mercury thermometer.
5.2 Additional Cold Tests 42
Figure 5.10: Stand used with the LM35 probe placed inside the cold truck.
This probe was placed first into the cold truck with the LabJack running. This provided a voltage that was capable of being converted to a temperature via a calculation. This provided a means of knowing what the ambient temperature was within the cold truck before placing the Neocot inside.
Figure 5.11: Neocot just prior to placing in cold truck with the LM35 external temperature probe placed inside.
[image:55.595.149.435.415.604.2]5.2 Additional Cold Tests 43
[image:56.595.97.487.182.383.2]internal temperature dropping below 33◦C. Due to this the Neocot was left within the chamber for a further period of time to prove that the Neocot was capable of exceeding the requirements of the IEC.60601-2-20 Australian Standard. The results that were obtained are shown in figure 5.10.
Figure 5.12: Neocot additional cold test results using the LM35 probes.
In total the Neocot remained in the cold truck for a period of approximately 22 minutes before being removed and placed in an ambient temperature being between 20 and 25◦C. The levelling off of the temperature between the 24 to 28 minute mark is due to the external ambient temperature of that day being only around 14◦C. This is below what is required in the IEC.60601-2-20 Australian standard and therefore the Neocot needed to be moved to a more suitable environment. The Neocot was taken back to Wenross Holdings and as can be seen upon entering the building the ambient temperature rose to a suitable level. The oscillation that is observed is as an effect of the air-conditioning unit.
5.2 Additional Cold Tests 44
standard also specifies that the Neocot must be then left in an environment of between 20 and 25◦C for a period of 30 minutes (IEC 2009). During this period the Neocot is to at no point exceed 3◦C above the normal operating temperature. This means that the Neocot is not allowed to exceed 39◦C. After analysing the results the maximum temperature that the Neocot warmed up to was 37.5◦C. This means that the Neocot has successfully passed the second requirement of the IEC.60601-2-20 Australian standard.
[image:57.595.149.435.441.630.2]During the cold test, thermistor probes were also included in the test to ensure that the results obtained by using the LM35 probes were correct. As shown in Figure 5.8 two thermistor probes were used. One of the probes were placed inside the Neocot while the other was situated on the Neosled just outside of the Neocot. The location of the external thermistor temperature probe was changed from the first cold test. Previously the probe was placed on a piece of conduit above the Neocot. It is believed that this was not providing an accurate measurement of the external temperature due to the heat from the Neocot rising. In this test the probe was placed at the same level as the Neocot and a small distance away as to prevent escaping heat from corrupting the reading as seen in Figure 5.13.
Figure 5.13: Location of the external ambient thermistor probe.
5.3 Comparison of results 45
Figure 5.14: Neocot additional cold test results using the thermistor probes.
Analysing the results obtained using the two different probes it can be seen that the response time of the thermistor was far quicker than the response time of the LM35 probe. This is due to thermistors having less thermal mass than what the LM35 probe contains thus making the changes in temperature appear far more quickly for a thermistor than for an LM35. However due to the LM35 producing a linear output the calibration of this is far simpler and can be done with far more accuracy making the results obtained from the LM35 probes more reliable.
5.3
Comparison of results
This section will compare the results taken from the two cold tests undertaken with the new heater element with the previous cold test undertaken with the original heater.
Chapter 6
Warm-up Time Results
This chapter will detail the results obtained while undertaking warm up tests on a set of Neocot’s. The warm up test needs to comply with the IEC.60601-2-20 Australian Standard.
6.1
Australian Standard Extract
The relevant Australian standard IEC.60601-2-20:2009 states:
6.2 Interpretation of Australian Standard Extract 47
Source: Australian Standards IEC.60601-2-20:2009
6.2
Interpretation of Australian Standard Extract
The IEC.60601-2-20 Australian Standard extract on the warm up test requirements is shown in the previous section. This section will interpret that extract to determine how the test can be undertaken and the requirements involved.
[image:60.595.138.451.432.575.2]The requirements of a warm up test is to ensure that the Neocot is capable of increasing in temperature by a certain amount over a period of time. This period being that the Neocot must be a able to increase by 11◦C from a starting ambient condition (IEC 2009). This time period is then compared to the amount of time stated in the user manual for the Neocot to increase in temperature from its cold state to the operating temperature. The difference between the amounts should be no more that 20 percent (IEC 2009).
Figure 6.1: Variation of the internal temperature.
Source: Australian Standards IEC.60601-2-20:2009
6.3 Methodology 48
6.3
Methodology
[image:61.595.150.434.323.536.2]Two Neocot’s will be used to conduct this warm up test. One Neocot will contain the original heater and the second Neocot will contain the newly designed heating element. The results of the comparison will be compared to determine if there is an improvement with the new heater design compared to the original. Both Neocot’s will be connected to mains power, with the PSU switched to AC during the duration of the test. Both Neocot’s will also have there temperature settings placed on 36◦C so as during the duration of the test the Neocot is continuously heating up. For this test TeraTerm will be used to log the temperature data within both of the Neocot’s. The five sensor array configuration will be used as shown in Figure 6.2:
Figure 6.2: Five sensor array configuration within the Neocot.
6.3.1 New Heater Results
This section details the results obtained by undertaking a warm up test on a Neocot with the newly designed heating element in place compared to the requirements of the IEC.60601-2-20 Australian Standard for a warm up test.
6.3 Methodology 49
Figure 6.3: Warm-up test using the new heater.
[image:62.595.96.487.497.694.2]The Neocot was started up from a cold condition as per the IEC.60601-2-20 Australian Standard requirement, it was then left to run for a period of just over one hour to ensure that the Neocot had reached its steady state temperature of 36◦C. It can be seen that after analysing the data the amount of time that was required to increase the temperature inside the Neocot by 11◦C was approximately 31 minutes. The point at which the internal temperature of the Neocot reached the 11◦C point is shown in Figure 6.4:
6.3 Methodology 50
6.3.2 Previous Heater Results
This section details the results obtained by undertaking a warm up test on a Neocot with the previous heating element in place compared to the requirements of the IEC.60601-2-20 Australian Standard for a warm up test.
[image:63.595.97.489.276.478.2]The following test was carried out according to the requirements of the IEC.60601-2-20 Australian Standard. Figure 6.5 illustrates the results after undertaking a warm-up test.
Figure 6.5: Warm-up test using the previous heater.
[image:63.595.97.487.533.732.2]6.3 Methodology 51
The test was carried out using the same procedure used for the new heater and com-pared to the requirements of the IEC.60601-2-20 Australian standard. This meant that the Neocot was started from a cold condition and had its internal temperature set to 36◦C. The Neocot was then left to run for a period of time until the internal tempera-ture of the Neocot had reached its steady state level of 36◦C. From this the data could then be analysed and compared to the standard. Figure 6.5 indicates the results that were obtained during this warm up test. Since the standard specifies that the heat up time being the amount of time the Neocot requires to increase its internal temperature by 11◦C. Figure 6.6 shows the result. The original heater was capable of increasing its internal temperature by 11◦C in a period of 27.77 minutes.
6.3.3 Comparison Of Results
This section will compare the results between the two different heating elements and an analysis will be undertaken to determine if there is any improvements to the new heater design compared to the previous for the warm up test.
The user manual for the Mansell Infant Retrieval System states that the average time for the Neocot to increase in temperature from a cold condition by 11◦C is around 45 minutes. The IEC.60601-2-20 Australian standard for a warm-up test specifies that the warm up time should not differ by more than 20 percent of the time specified in the user manual.
6.3 Methodology 52
Chapter 7
Automating Temperature Data
Retrieval Program
This chapter will outline the process undertaken to create a program that could auto-mate the process of logging and plotting the temperature data being collected from the Neocot.
7.1
Background
[image:66.595.170.416.576.761.2]The previous method for logging temperature performance data from a Neocot consisted of using a five sensor array connected through TeraTerm on a computer.
7.2 Automating Temperature Data Retrieval Program Design 54
The issue with this method was in order to plot the collected data the file needed to be opened in excel, edited and then a plot could be generated. This extra process was the reason for trying to develop a program that any user could use without the knowledge or expertise on how the data logger operated. Figure 7.1 above is the current instrument used to log the temperature data from a Neocot. Before a Neocot can be given to a customer certain temperature tests need to be undertaken to ensure that the Neocot is capable of operating as required. Some of these tests include a warm up test to ensure that the time that the Neocot requires to reach its operating temperature is within a certain limit, also a calibration test to ensure that the temperature that is being displayed on the LED readout on the front of the Neocot does not differ greatly from the actual temperature being measured within the Neocot. This temperature difference can be no more than±1◦C. The five sensor array illustrated in Figure 7.1 would be used for these tests. The data being collected by the five sensor array would feed its information in real time back to a computer running TeraTerm. Upon completion of the testing the TeraTerm data would automatically be stored as a text file on the host computer. This meant that in order to plot the data the text file would need to be opened in excel, formatted in a way so that the information stored within each column is known and then generate plots of the data. This is the reason behind wanting to generate a program that could automatically do all of the above processes without the user needing to do anything apart from starting the program. However the developed automation program would only be able to be used with the newly developed temperature sensor hardware.
7.2
Automating Temperature Data Retrieval Program
De-sign
7.2 Automating Temperature Data Retrieval Program Design 55
automation program could be directly stored into an excel page without the need of opening the created file separately after completion of the testing.
[image:68.595.92.493.338.565.2]The program therefore required a start and stop button to begin the testing process and to end it. Another crucial aspect of a temperature logging device is the need for calibration. Therefore it was decided that an additional button should be placed in the program which would allow the use of calibration. Because calibration requires physically adjusting potentiometers inside the temperature testing device this could not be done automatically. The calibration process in the automation program therefore is a set of steps that the user would follow that indicates the process that needs to be undertaken to properly calibrate the device. The Figure 7.2 shows the user interface section of the VBA automation program hosted in excel:
Figure 7.2: Automation program user interface display.
7.2 Automating Temperature Data Retrieval Program Design 56
[image:69.595.92.491.132.359.2]procedures for calibrating the device properly is displayed as shown in Figure 7.3:
Figure 7.3: Automation program calibration process example of step by step procedure.
Chapter 8
Conclusions and Further Work
This chapter outlines the results obtained from the project and any further work that needs to be completed.
8.1
Achievement of Project Objectives
The following objectives have been addressed as set out in the project specification:
Research the requirements of the IEC.60601-2-20 Australian standard Chapter
1 provided a breakdown of what the IEC.60601-2-20 Australian standard was stating, also an interpretation of what the standard was asking is provided.
Research temperature sensing devices suitable for this application Chapter 2
provided a detailed analysis of the many forms of temperature sensing hardware and devices that are currently on the market for the required project specifica-tion. The main forms of temperature measurement devices that were analysed were Thermocouples, Thermistors, RTD’s and LM35’s. This chapter detailed the strengths and weaknesses of each of the different forms to make a choice for this application easier.
Research how to properly design, construct and test an amplifier circuit Chapter
8.1 Achievement of Project Objectives 58
analysed were differential and instrumentation amplifiers and the strengths and weaknesses of each were analysed.
Design, Construct and test an amplifier circuit for the required application
Chapter 4 provides a description on what instruments were chosen for the con-struction of the amplifier circuit. Reasons are also detailed as to why certain devices were chosen over others. The devices that were chosen to produce the final product are as follows: a differential amplifier was chosen along with ther-mistors and LM35 probes. The noise filtering used was constructed from a simple RC circuit composing of a resistor and a capacitor to filter out noise above a cal-culated frequency. Testing of the amplifier circuit was also detailed in chapter 4 with the process consisting of placing the probes within a salty ice water solution to ensure that the device was capable of measuring negative temperatures with a reasonable amount of accuracy. This setup was also used to calibrate the device before use.
Research a suitable A/D device for the application Chapter 2 provides a liter-ature review on the type of A/D to be used for the project. Only one A/D was analysed due to the ease of access of this device. The chosen A/D for the appli-cation was a LabJack which would communicate with the amplifier circuit and provide a data output to the logging program.
Design Software to plot temperature measurement data Chapter 4 provides a
description as to how the data was plotted from the LabJack. Due to the supplied logging program having a minimum logging frequency of 500Hz a program needed to be developed to reduce the amount of samples per second being taken. There-fore a MATLAB averaging program was developed to take the first 250 samples and average them so as the amount of data being stored did not exceed a realistic amount. Before the averaging code with 500Hz this would imply 500 data points per second. The test duration is typically between 45 and 60 minutes. Therefore there would be by the end over 1 million data points. Temperature cannot change that quickly therefore it was beneficial to average the number of samples collected before plotting.
Determine the signal filter requirements for the measurements Chapter 2
8.2 Further Work 59
pass. Each were examined and in chapter 4 the best filter for the application was chosen. This turned out to be the RC filter due to its ease of application. The other filters were considered but not implemented due to them requiring the interfering signal frequency to be known. In this circumstance the interference frequency was not known therefore an RC filter was used.
Compare results to the IEC.60601-2-20 Australian Standard requirements
Chapter 5 illustrates the results that were obtained from the two conducted cold tests on two separate Neocot’s. The tests that were conducted were based on the IEC.60601-2-20 Australian standard for a cold test. This meant that the Neocot was placed in a environment of -5◦C for a duration of 15 minutes before being removed and placed in an environment of between 20 and 25◦C for a further 30 minutes (IEC 2009). The results that were obtained from the cold tests were then compared to the requirements of the IEC.60601-2-20 Australian standard to ensure that the cold test did pass. Chapter 5 also provides a comparison of the first original cold test results to the results obtained from the new heater cold tests.
In conclusion, the research project has been a success. It has proven the successful operation of the new heater design for the Mansell Infant Retrieval System. The design has far exceeded the requirements outlined in the IEC.60601-2-20 Australian standard in both the cold test results and the warm-up time results. The developed temperature logging device operated in a manner that was well in excess of what the previous expectations were for its operation. If more time was permitted removal of the LabJack would have been the next stage and replaced with a microcontroller.
8.2
Further Work
References
Ametherm (2013), ‘What is an ntc thermistor’, http://www.ametherm.com/ thermistor/what-is-an-ntc-thermistor. [Online; accessed February-2014].
Azom.com (2013), ‘Resistance temperature detector (rtd) - principle of oeration, materials, configuration and benefits by innovative sensor technology’, http: //www.azom.com/article.aspx?ArticleID=5573. [Online; accessed April-2014].
Circuits, A. A. (2012a), ‘Building a differential amplifier’, http://www. allaboutcircuits.com/vol_3/chpt_8/9.html. [Online; accessed April-2014].
Circuits, A. A. (2012b), ‘The instrumentation amplifier’, http://www. allaboutcircuits.com/vol_3/chpt_8/10.html. [Online; accessed April-2014].
Cuihong Liu, Wentao Ren, B. Z. C. L. (n.d.), ‘The application of soil temperature measurement by lm35 temperature sensors’,IEEExplore 1, 1825–1828.
Devices, A. (2014), ‘Instrumentation amplifiers’, http://www.analog.com/en/ specialty-amplifiers/instrumentation-amplifiers/products/index.html. [Online; accessed April-2014].
D.Parsons & N.Hancock (2014), ELE3506 - Electronic Measurement, University of Southern Queensland.
Grant-Thomson, J. (1997),Cost-effective Intensive-care Transportation of the Critically Ill, 10th World Congress on Emergency and Disaster Medicine. Mainz, Germany, September, pp 1-9.
REFERENCES 61
IEC (2009), Medical Electrical Equipment – Particular requirements for the basic safety and essential performance of infant transport incubators, Standard IEC.60601-2-20:2009, International Electrotechnical Commission.
INC, C. S. (2001), ‘Preventing and attacking measurement noise problems’, http:// www.s.campbellsci.com/documents/ca/technical-papers/mnoise.pdf. [On-line; accessed May-2014].
info, T. (2011), ‘Types of thermocouples’, http://www.thermocoupleinfo.com. [On-line; accessed April-2014].
Informer, S. (2014), ‘Tera term 3.1’, http://www.tera-term.software.informer.