0022-538X/10/$12.00 doi:10.1128/JVI.01521-10
Copyright © 2010, American Society for Microbiology. All Rights Reserved.
Quantitative and Qualitative RNA-Seq-Based Evaluation of
Epstein-Barr Virus Transcription in Type I Latency
Burkitt’s Lymphoma Cells
䌤
†
Zhen Lin,
1‡ Guorong Xu,
2‡ Nan Deng,
2Christopher Taylor,
2,3Dongxiao Zhu,
2,3* and Erik K. Flemington
1*
Department of Pathology, Tulane University Health Sciences Center and Tulane Cancer Center, 1430 Tulane Avenue, New Orleans,
Louisiana 701121; Department of Computer Science, University of New Orleans, Lakefront, 2000 Lakeshore Drive,
New Orleans, Louisiana 701482; Research Institute for Children, Children’s Hospital, New Orleans,
200 Henry Clay Avenue, New Orleans, Louisiana 701183
Received 21 July 2010/Accepted 30 September 2010
RNA-seq provides a rich source of transcriptome information with high qualitative and quantitative value. Here, we provide a pipeline for Epstein-Barr virus (EBV) transcriptome analysis using RNA-seq and we apply it to two type I latency cell lines, Mutu I and Akata. This analysis revealed substantial average expression levels of many lytic genes in predominantly latent cell populations. The lytic tran-scripts BHLF1 and LF3 were expressed at levels greater than those for 98% of all cellular polyadenylated transcripts. Exon junction mapping accurately identified the Qp-derived EBNA1 splicing pattern, lytic gene splicing, and a complex splicing pattern within the BamHI A region.
Microarrays have been used to assess the levels of Epstein-Barr virus (EBV) gene expression in experimental and clin-ical settings (1, 7, 16–18). Nevertheless, this analysis typi-cally requires the use of custom arrays with user-specified probes against each EBV gene of interest. Despite their utility, microarrays have a limited dynamic range, being limited at the low end by the level of background and limited at the high end by signal saturation. Further, the accuracy of microarray data can be a concern because of chip defects, cross hybridization, and the analog nature of the approach. Accordingly, back-to-back comparisons of microarray and RNA-seq data have demonstrated the enhanced perfor-mance of RNA-seq in the quantitative assessment of cellular transcripts (8, 9, 14). With RNA-seq, transcript structure information can also be deduced from a relatively unbiased data set, whereas transcript structure information derived from tiling microarrays is dependent on the probe design and is therefore subject to investigator biases.
Due to the perceived potential of RNA-seq in transcrip-tome analysis, there has been intense interest in the devel-opment of informatics approaches to analyze cellular tran-scriptomes (2). For the most part, these approaches should be directly applicable to the analysis of viral transcriptomes. Nevertheless, the appropriately formatted annotation files
for viruses or other ectopic organisms and the incorporation of this annotation information into existing pipelines have been lacking. We have created the necessary annotation files for EBV and merged them with annotation files for the human cellular genome so that EBV-specific transcript data can be generated in the context of cellular data. This pipe-line allows for the simultaneous analysis of cellular and viral transcriptomes, the digital quantification of EBV tran-scripts, and the visualization of EBV-specific reads and splice junctions with a genome browser (see file S1 in the supplemental data for pipeline details). Using this ap-proach, we have analyzed EBV transcriptomes for the EBV-positive Burkitt’s lymphoma type I latency cell lines Mutu I and Akata.
Analysis of EBV gene expression in Mutu I and Akata cells. Sequencing data used for the Mutu I cell analysis were control samples from a previous study in which we assessed microRNA miR-155-mediated cellular transcriptome changes (14) (National Center for Biotechnology Informa-tion [NCBI] Sequence Read Archive accession no. SRA011001). For this study, two separate control RNA preparations were generated, and single-end 50-base tech-nical replicates were run for each poly(A)⫹-selected RNA. Akata cell sequencing data were generated anew from whole-cell RNA prepared using an miRNeasy kit (Qiagen) according to the vendor’s protocol. Akata cell sequencing libraries were generated using an Illumina RNA-seq kit (part no. 1004898) and run on a GA2x machine for single-end 74-base extensions. Sequences were simultaneously aligned to all human chromosomes plus the EBV genome (strain AG876 [3]; GenBank accession no. DQ279927) (see file S1 in the supplemental data for general and detailed pipeline information). Reads per kilobase of exon per mil-lion mapped reads (RPKM; a measure of relative gene
ex-* Corresponding author. Mailing address for E. Flemington: De-partment of Pathology, Tulane University Health Sciences Center and Tulane Cancer Center, 1430 Tulane Ave., New Orleans, LA 70112. Phone: (504) 988-1167. Fax: (504) 588-5516. E-mail: eflemin@tulane .edu. Mailing address for D. Zhu: 2000 Lakeshore Dr., Math 312, Dept. of Computer Science, University of New Orleans, New Orleans, LA 70148. Phone: (504) 280-2406. Fax: (504) 280-7228. E-mail: dzhu @cs.uno.edu.
† Supplemental material for this article may be found at http://jvi .asm.org/.
‡ Z.L. and G.X. are co-first authors.
䌤Published ahead of print on 13 October 2010.
13053
on November 8, 2019 by guest
http://jvi.asm.org/
pression) for all genes were calculated using SAMMate (http://sammate.sourceforge.net).
Figure 1A shows the sequence read distribution across the entire EBV genome for Mutu I and Akata cell RNAs (for an expanded/high-resolution view, see file S2 in the supplemen-tal data). Ample read evidence is observed across the ma-jority of the EBV genome. Despite this observation, how-ever, the relatively few intergenic regions that exist within the EBV genome tend to lack reads (for an example, see
Fig. 1B), supporting the contention that possible contami-nating DNA does not represent a major source of read evidence. The abundances of reads across all latency genes were relatively low, and consistent with these cell lines ex-hibiting type I latency, no reads mapped to the EBNA2 open reading frame (Fig. 1C and Fig. 2).
We were surprised by the robust levels of many of the lytic genes in both Mutu I and Akata cells (Fig. 1 and 2), in contrast to the low levels of latency gene expression
ob-FIG. 1. Visualization of RNA-seq coverage across the EBV genome. Coverage (Wiggle) files generated from SAMMate and the EBV annotation file were loaded onto the Integrated Genome Viewer (IGV [http://www.broadinstitute.org/igv/], developed at the Broad Institute). The
yaxis shows the number of reads mapping to each location of the genome. (A) Whole-genome view; (B) zoomed view of the intergenic region between the BMRF2 and BSLF2 genes; (C) lack of reads corresponding to the EBNA2 locus. The data range for coverage data was set to 20 (for Mutu I cells) or 30 (for Akata cells), meaning that maximal peaks represent genomic positions where there were at least 20 or 30 reads that crossed that position.
13054 NOTES J. VIROL.
on November 8, 2019 by guest
http://jvi.asm.org/
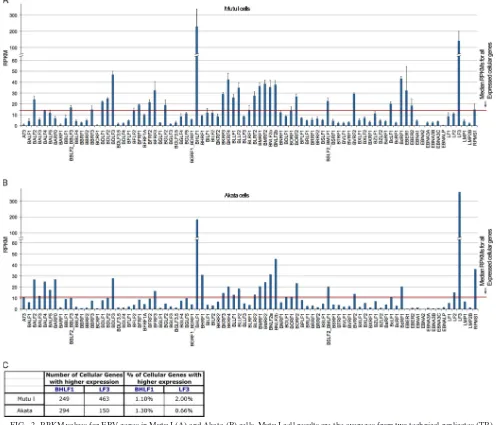
[image:2.585.43.541.70.537.2]served. Many of these lytic genes show expression that is well above the median for all expressed cellular genes (me-dian RPKM, 14.1 [Mutu I] and 10.9 [Akata], calculated as the median RPKM of genes with greater than 1 RPKM; 1 RPKM typically represents approximately 1 transcript per cell [6]) (Fig. 2A and B). Strikingly, the BHLF1 and LF3 transcripts are represented at such high levels that only between 0.66 and 2% of all annotated poly(A)⫹ cellular genes are expressed at higher levels in Mutu I and Akata cells (Fig. 2C). The expression values observed here for EBV genes are not due to background, since we ran RNA-seq data from the EBV-negative cell lines A549 (10) and MCF7 (13) through our pipeline and obtained no align-ments to the EBV genome (Fig. 3). The substantial average expression levels observed here for some lytic genes could
arise from their expression in latency and/or from their very high expression in a small proportion of cells that are ac-tively undergoing lytic replication. The latter scenario most likely explains sequences obtained for most of these lytic genes. Nevertheless, it is intriguing to speculate that the former scenario may account for at least some of these genes. For example, BHLF1 and LF3 transcripts have been shown to be derived from multiple promoters, some of which are induced upon reactivation and others of which are constitutive (5, 15). The high transcript levels that we ob-served under noninduced conditions suggest that these genes may play a role in the latent phase of the EBV life cycle. Overall, these data illustrate the sensitivity of RNA-seq for assessing transcript levels. Further, the BHLF1 and LF3 examples described here illustrate how the digital
na-FIG. 2. RPKM values for EBV genes in Mutu I (A) and Akata (B) cells. Mutu I cell results are the averages from two technical replicates (TR) from each of two separate RNA preparations. Error bars indicate the standard deviation for each gene. (C) The number and percentage of genes showing higher RPKM values than those for BHLF1 and LF3 in Mutu I and Akata cells out of a total of 22,803 annotated cellular and viral genes.
on November 8, 2019 by guest
http://jvi.asm.org/
[image:3.585.40.542.73.498.2]ture of RNA-seq allows the user to compare the abundance of transcripts from one gene with the abundance of tran-scripts of other genes within the transcriptome.
Notably, despite carrying out poly(A)⫹ RNA selection prior to sequencing, we still detect the expression of non-polyadenylated transcripts, such as the EBV-encoded RNAs (EBERs) in Mutu I cells (Fig. 2). However, we note that the errors for nonpolyadenylated transcripts tend to be high, probably due to differences in the efficacies of poly(A)⫹ RNA selection between the two biological replicates in Mutu I cells. Only low levels of EBERs were detected in
Akata cells, indicating that the poly(A)⫹RNA selection was more effective in our newest RNA-seq experiment.
Splicing evidence in Mutu I and Akata cells.While
RNA-seq can provide digital quantification of gene expression, reads that span exon junctions can provide information about gene isoform usage. We used the junction mapper TopHat (12) to identify junction-mapped reads throughout the EBV genome (see file S1 in the supplemental data) for Mutu I and Akata cells. While no evidence of Cp- or Wp-derived EBNA1 transcripts was found, evidence for Qp-derived EBNA1 splice junctions was observed for both Mutu I and Akata cells (Fig. 4A). Junction reads were also de-tected for EBV lytic genes in both Mutu I and Akata cells, including junction reads for both BZLF1 (Fig. 4B) and BSLF2/BMLF1 genes (see file S3 in the supplemental data). Further, evidence for multiple isoform expression (i.e., al-ternative splicing events) was detected for many genes, such as BLLF1/BLLF2 genes (Fig. 4C), as well as for the complex BamHI A region (4, 11) (see file S4 in the supplemental data). Within the BamHI A region (see file S4), for example, there is evidence for alternative splicing at the A73 gene in both Akata and Mutu I cells, with JUNC00000180 from Mutu I cells providing evidence of exon skipping (skipping of exons 2 and 3). Within the genomic regions spanning the two BART microRNA clusters, there are very few reads, consistent with these microRNAs being produced from ex-cised introns that are presumably unstable and nonpolyade-nylated [and therefore not enriched during our poly(A)⫹ selection procedure]. In both Mutu I and Akata cells, there is evidence for two large introns that span the entire region of both of these clusters of microRNAs (JUNC00000094 and JUNC00000178 in Mutu I cells and JUNC00000053 and JUNC00000084 in Akata cells). Consistent with this junc-tion evidence, there are pronounced read spikes in Akata cells immediately upstream from the first junction (centered at position 139,270), between these two junctions (centered at position 147,770), and immediately downstream from the second junction (centered at position 151,115) (see file S4 in the supplemental data), supporting the idea that a stable, poly(A)⫹spliced transcript is generated from this transcrip-tion unit. The two introns excised from this transcript can conceivably give rise to all BART microRNAs within these two clusters.
Conclusions.Our results show robust detection of
[image:4.585.44.283.70.505.2]EBV-derived transcripts by RNA-seq using the pipeline outlined here (see file S1 in the supplemental data). From a quanti-tative standpoint, several studies have shown this approach to outperform microarrays, since it is more accurate (8, 9, 14) and since there is an inherently broad dynamic range. For example, a previous report (1) documented the difficulty in attaining confidence in detecting most EBV-derived tran-scripts using microarrays because of low signal-to-noise ra-tios. Here, we show excellent coverage of the bulk of EBV genes (including lytic genes) in predominantly latently in-fected cell lines while at the same time detecting no EBV-specific reads in two EBV-negative cell lines. The digital nature of RNA-seq allows the user to better compare the relative expression of distinct genes through the calculation of RPKM. This allowed us to determine that BHLF1 and LF3 are among the most abundant genes expressed even in
FIG. 3. Illustration of specificity for RNA-seq in assessing EBV transcriptomes. The total number of reads that mapped to the EBV genome per 10 million mapped reads from the EBV-positive cell lines, Akata and Mutu I, and the EBV-negative cell lines, A549 and MCF7. No EBV-specific reads in either of the EBV-negative cell lines were identified. RNA1 and RNA2 refer to biological replicate RNA samples from Mutu I cells. TR1 and TR2 refer to technical sequencing replicates.
13056 NOTES J. VIROL.
on November 8, 2019 by guest
http://jvi.asm.org/
predominantly latently infected cell populations. Last, RNA-seq inherently contains splice junction information that can be readily exploited to garner viral isoform expres-sion patterns.
[image:5.585.44.538.69.637.2]Our approach can also be readily applied to other viruses by manual conversion of the respective annotation informa-tion (generally available in the NCBI database) to the ap-propriate format and its subsequent conjugation to cellular
FIG. 4. Visualization of junction evidence for EBNA1 (A), BZLF1 (B), and BLLF1/BLLF2 (C) genes. Junction (browser extensible data [BED]) files were generated by the junction mapper TopHat as outlined in file S1 in the supplemental data.
on November 8, 2019 by guest
http://jvi.asm.org/
annotation files. This should result in an improvement over microarrays in the analysis of virus-associated transcrip-tomes not only for EBV but also for other viruses.
Online data repository accession number. Sequence read
data from this study have been deposited in the NCBI Se-quence Read Archive under accession number SRA024500.1.
This work was supported by NIH grants CA124311, CA130752, and CA138268 to E.K.F., grant LM010137 to D.Z., an NIH ARRA admin-istrative supplement providing summer research experiences for stu-dents and science educators (CA130752-S1 to E.K.F.), and an NIH COBRE grant (P20 RR020152 to the program director, Prescott Dein-inger).
REFERENCES
1.Bernasconi, M., C. Berger, J. A. Sigrist, A. Bonanomi, J. Sobek, F. K. Niggli, and D. Nadal.2006. Quantitative profiling of housekeeping and Epstein-Barr virus gene transcription in Burkitt lymphoma cell lines using an oligo-nucleotide microarray. Virol. J.3:43.
2.Costa, V., C. Angelini, I. De Feis, and A. Ciccodicola.2010. Uncovering the complexity of transcriptomes with RNA-Seq. J. Biomed Biotechnol.2010: 853916.
3.Dolan, A., C. Addison, D. Gatherer, A. J. Davison, and D. J. McGeoch.2006. The genome of Epstein-Barr virus type 2 strain AG876. Virology350:164– 170.
4.Edwards, R. H., A. R. Marquitz, and N. Raab-Traub.2008. Epstein-Barr virus BART microRNAs are produced from a large intron prior to splicing. J. Virol.82:9094–9106.
5.Gao, Y., P. R. Smith, L. Karran, Q. L. Lu, and B. E. Griffin.1997. Induction of an exceptionally high-level, nontranslated, Epstein-Barr virus-encoded polyadenylated transcript in the Burkitt’s lymphoma line Daudi. J. Virol. 71:84–94.
6.Li, B., V. Ruotti, R. M. Stewart, J. A. Thomson, and C. N. Dewey.2010. RNA-Seq gene expression estimation with read mapping uncertainty. Bioin-formatics26:493–500.
7.Li, C., R. S. Chen, S. K. Hung, Y. T. Lee, C. Y. Yen, Y. W. Lai, R. H. Teng,
J. Y. Huang, Y. C. Tang, C. P. Tung, T. T. Wei, B. Shieh, and S. T. Liu.2006. Detection of Epstein-Barr virus infection and gene expression in human tumors by microarray analysis. J. Virol. Methods133:158–166.
8.Marioni, J. C., C. E. Mason, S. M. Mane, M. Stephens, and Y. Gilad.2008. RNA-seq: an assessment of technical reproducibility and comparison with gene expression arrays. Genome Res.18:1509–1517.
9.Mortazavi, A., B. A. Williams, K. McCue, L. Schaeffer, and B. Wold.2008. Mapping and quantifying mammalian transcriptomes by RNA-Seq. Nat. Methods5:621–628.
10.Reddy, T. E., F. Pauli, R. O. Sprouse, N. F. Neff, K. M. Newberry, M. J. Garabedian, and R. M. Myers.2009. Genomic determination of the glu-cocorticoid response reveals unexpected mechanisms of gene regulation. Genome Res.19:2163–2171.
11.Smith, P. R., O. de Jesus, D. Turner, M. Hollyoake, C. E. Karstegl, B. E. Griffin, L. Karran, Y. Wang, S. D. Hayward, and P. J. Farrell.2000. Struc-ture and coding content of CST (BART) family RNAs of Epstein-Barr virus. J. Virol.74:3082–3092.
12.Trapnell, C., L. Pachter, and S. L. Salzberg.2009. TopHat: discovering splice junctions with RNA-Seq. Bioinformatics25:1105–1111.
13.Wang, E. T., R. Sandberg, S. Luo, I. Khrebtukova, L. Zhang, C. Mayr, S. F. Kingsmore, G. P. Schroth, and C. B. Burge.2008. Alternative isoform reg-ulation in human tissue transcriptomes. Nature456:470–476.
14.Xu, G., C. Fewell, C. Taylor, N. Deng, D. Hedges, X. Wang, K. Zhang, M. Lacey, H. Zhang, Q. Yin, J. Cameron, Z. Lin, D. Zhu, and E. K. Flemington. 2010. Transcriptome and targetome analysis in MIR155 expressing cells using RNA-seq. RNA16:1610–1622.
15.Xue, S. A., and B. E. Griffin.2007. Complexities associated with expression of Epstein-Barr virus (EBV) lytic origins of DNA replication. Nucleic Acids Res.35:3391–3406.
16.Yuan, J., E. Cahir-McFarland, B. Zhao, and E. Kieff.2006. Virus and cell RNAs expressed during Epstein-Barr virus replication. J. Virol.80:2548– 2565.
17.Zhang, Y., J. H. Ohyashiki, T. Takaku, N. Shimizu, and K. Ohyashiki.2006. Transcriptional profiling of Epstein-Barr virus (EBV) genes and host cellular genes in nasal NK/T-cell lymphoma and chronic active EBV infection. Br. J. Cancer94:599–608.
18.Zheng, Z. B., Y. D. Wu, X. L. Yu, and S. Q. Shang.2008. DNA microarray technology for simultaneous detection and species identification of seven human herpes viruses. J. Med. Virol.80:1042–1050.
13058 NOTES J. VIROL.
![FIG. 1. Visualization of RNA-seq coverage across the EBV genome. Coverage (Wiggle) files generated from SAMMate and the EBVannotation file were loaded onto the Integrated Genome Viewer (IGV [http://www.broadinstitute.org/igv/], developed at the Broad Institu](https://thumb-us.123doks.com/thumbv2/123dok_us/157004.34148/2.585.43.541.70.537/visualization-coverage-generated-ebvannotation-integrated-broadinstitute-developed-institu.webp)