University of Southern Queensland
Faculty of Health, Engineering and Sciences
Arc Flash Protection of a Low Voltage
Motor Control Centre
A dissertation submitted by
Paul Nicholas Dugdale
In fulfilment of the requirements of
Courses ENG4111 and 4112 Research Project
Towards the degree of
Bachelor of Engineering (Electrical & Electronic)
Abstract
This dissertation seeks to investigate the arc flash hazard incident energy levels throughout the section of the power network that includes the Low Voltage Motor Control Centre (MCC) P6512 at Cristal Pigment Australia’s Kemerton Plant, in Western Australia. It involved researching common industry practice for arc flash hazard studies, and following the requirements set out in the NFPA 70E (2012) and IEEE 1584 (2002) standards.
An audit of all associated plant and equipment was carried out. The power network of the plant was modelled, and a short-circuit evaluation conducted. The network’s protection was studied to establish whether it provided the necessary protection/coordination between devices. Finally, with the aid of arc flash analysis calculation software (‘Power Tools for Windows’), the arc flash study was conducted.
The result of this research has shown that the most dangerous location within the power network is the wiring (and connections) between the low voltage terminals of the MCC 22kV/415VAC supply transformer and the main Air Circuit Breaker (ACB) of the MCC. This is due to the location and type of the upstream protective device in use (i.e. a 22kV fuse upstream of the HV termination of the transformer). When calculated, the clearing time of this fuse was found to be greater than 14 seconds, by which time life could be lost and irreparable damage would occur.
Disclaimer
University of Southern Queensland
Faculty of Health, Engineering and Sciences
ENG4111 & ENG4112
Research Project
Limitations of Use
The council of the University of Southern Queensland, its Faculty of Health, Engineering and Sciences, and the staff of the University of Southern Queensland, do not accept any responsibility for the truth, accuracy or completeness of material contained within or associated with this dissertation.
Persons using all or any part of this material do so at their own risk, and not at the risk of the council of the University of Southern Queensland, its Faculty of Health, Engineering and Sciences or the staff of the University of Southern Queensland.
Certification
I certify that the ideas, designs and experimental work, results, analyses and conclusions set out in this dissertation are entirely my own effort, except where otherwise indicated and acknowledged.
I further certify that the work is original and has not been previously submitted for assessment in any other course or institution, except where specifically stated.
Paul Nicholas Dugdale
Student Number: 0050049546
__________________________ (Signature)
30th October 2014 (Date)
Acknowledgements
I would like to acknowledge several people for their guidance, support, and sponsorship during my dissertation preparation. I specifically want to make a special mention to the following people, without their assistance would have made my dissertation impossible to complete:
Tim Mace and Cristal Pigment Australia for providing the project and access to the plant and various internal documentation;
Murray Newman for offering guidance from his wealth of experience and
for his many hours of personal time training me in the use of the “Power Tools for Windows” arc flash calculation software;
Archer Electrical Engineering for permitting the use of their “Power Tools for Windows” software (and licence) for my studies;
Andreas Helwig for your guidance and support;
My family, including my wife Helen and daughter Kate, who have always
been supportive, even though they may feel that they have been placed second for the last 9 years.
Lastly, I would like to thank my extended family, various friends, fellow students and lecturers from USQ, and colleagues, who have assisted me in many different ways, during my journey throughout my University studies.
Contents
Abstract
... i
Disclaimer
... ii
Certification
... iii
Acknowledgements
... iv
Contents
... v
Figures
... x
Tables
... xiii
1.
Introduction
... 1
1.1 Statement of Task ... 1
1.2 Objectives ... 2
1.3 Abbreviations ... 3
1.4 Definitions ... 3
2.
Background
... 5
2.1 Arc Flash ... 5
2.1.1 What is arc flash? ... 6
2.1.2 Common causes of arc flash ... 9
2.1.3 Arc flash hazards ... 10
2.1.4 Properties of an arc flash ... 13
2.1.6 The personal consequence of an arc flash occurrence ... 17
2.2 Arc Flash Hazard Studies – Codes and Standards ... 18
2.2.1 Australian industry and Arc flash standards ... 19
2.2.2 The difference between the standards IEEE 1584 and NFPA 70E ... 22
2.3 Arc Flash Hazard Study deliverables ... 24
2.4 Cristal Pigment Australia, Kemerton ... 25
2.4.1 Company profile ... 25
2.4.2 Arc flash protection study of a motor control centre ... 26
3.
Methodologies
... 28
3.1 Modelling of the Power System ... 28
3.1.1 Data collection and system modelling ... 29
3.1.2 Power System Single Line Diagram (SLD) ... 32
3.2 Short-Circuit Analysis ... 33
3.2.1 Data required for short-circuit study ... 33
3.2.2 Determine the possible modes of operation ... 34
3.2.3 Determine the bolted fault currents ... 35
3.3 Protection System Study ... 35
3.4 Arc Flash Analysis ... 38
3.4.1 Non-linear nature of arcing short-circuit current ... 38
3.4.2 Why use a three phase model ... 39
3.4.3 Determine the arcing currents ... 39
3.4.4 Determine of arc flash duration ... 41
3.4.5 Limitation of damage of a switchboard to an arcing fault ... 43
3.5 Determining Incident Energy ... 44
3.5.2 Select the working distances ... 44
3.5.3 Determine the incident energy (≤ 15 kV) ... 46
3.5.4 Determine the arc flash-protection boundary (≤ 15 kV) ... 48
3.5.5 Determine the arc flash hazard/risk category and PPE selection ... 51
3.5.6 Arc flash warning labels ... 56
3.6 Assumptions for the Arc Flash Hazard Study ... 56
3.7 Power Tools for Windows (PTW) software ... 58
4.
Research Results and Recommendations
... 59
4.1 Research Component ... 59
4.1.1 Power Tools for Windows (PTW) software Arc Flash settings and assumptions ... 59
4.1.2 Data collection ... 61
4.1.3 Presentation of arc flash analysis results ... 62
4.1.4 Protection device phase overcurrent grading ... 68
4.1.5 Short-circuit Analysis ... 70
4.2 Arc Flash Analysis results and recommendations ... 71
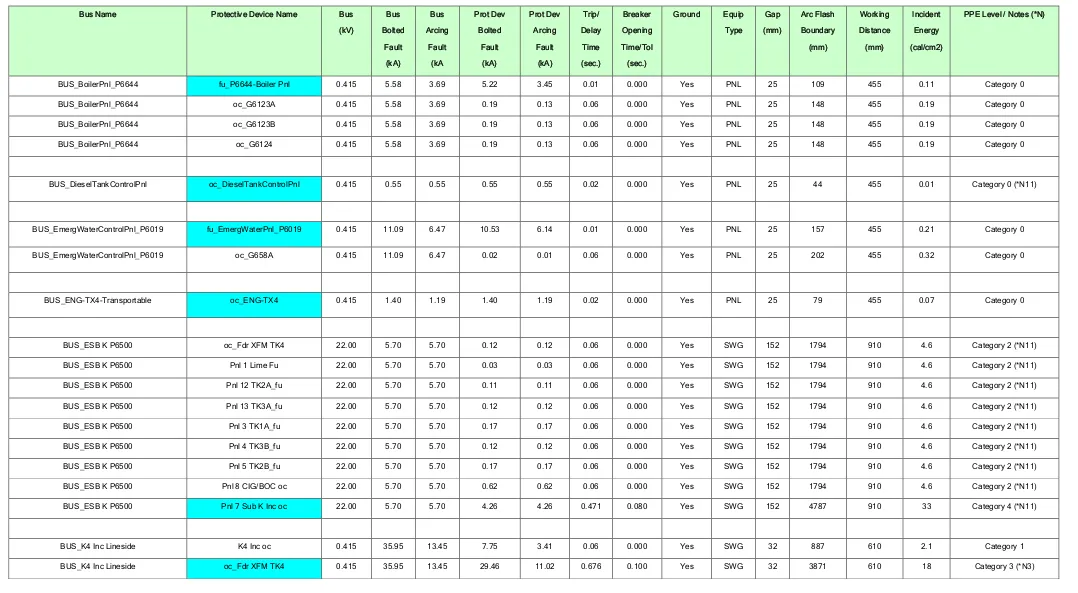
4.2.1 Arc Flash Analysis results ... 71
4.2.2 Switchboards/MCCs where the Incident Energy exceeds 8 cal/cm2 (for the existing installation) ... 71
4.2.3 Existing arc flash result at incoming tier of the LV Motor Control Centre P6512 ... 72
4.2.4 Limitation of damage of MCC P6512 to an arcing fault ... 74
4.2.5 Proposed replacement of the 22kV supply fuse with an ACB & Relay .... 75
4.2.6 VAMP Optical Arc Protection Scheme ... 77
4.3 Arc Flash Warning Labelling ... 81
4.4 Critical Risks/Issues and Hazardous Area investigation ... 82
5.
Conclusions and Further Work
... 86
5.1 Further Work ... 88
6.
References
... 90
6.1 IEEE Journal Article ... 90
6.2 Cristal Pigment Documentation ... 93
6.3 Online Article ... 94
6.4 Online Books ... 96
6.5 Online Cable Technical Specification Datasheets ... 96
6.6 Printed Texts ... 101
6.7 Standards ... 102
6.8 Web Sites ... 104
Appendix A
Project Specification
... 105
Appendix B
Drawings
... 106
Appendix C
Risk Assessment
... 110
Appendix D
Data Collection
... 113
Appendix E
Utility Fault Level Request
... 128
Appendix G
Arc Flash Results and PTW Models
... 141
Appendix H
Time-Current Characteristic (TCC) Curves
... 175
Appendix I
Arc Flash Labels
... 189
Figures
Figure 2-1: Arc Flash (Jennings 2014) ... 8
Figure 2-2: Electric Arc Model (Cooper Bussmann 2014, p. 117) ... 14
Figure 2-3: MCC P6512 – Located in EDC K4 ... 27
Figure 3-1: Working out arc duration (Phillips 2011, p. 126) ... 42
Figure 4-1: PTW Single Line Diagram and Arc Flash Analysis results for the existing power network (up to MCC P6512) ... 63
Figure 4-2: Grading of existing network to largest drive on Sub K4 MCC (P6512) ... 69
Figure 4-3: Existing Sub K4 MCC (P6512) Feeder TCC ... 73
Figure 4-4: MiCom P122 Relay (Schneider Electric 2014) ... 75
Figure 4-5: Proposed Sub K4 MCC (P6512) Feeder TCC ... 76
Figure 4-6: Typical installation of the VAMP 221 Arc Flash Protection System (Schneider Electric 2013) ... 77
Figure 4-7: Arc Flash Label for Incoming Supply Tier of MCC K4 (P6512) ... 81
Figure 4-8: Hazardous Area Location Detail Drawing 000A2143 (Cristal 2012)84 Figure 4-9: Extract of Hazardous Area Drawing 000A2143 (Cristal 2012) ... 84
Figure B-1: Kemerton HV/MV Power Distribution Main Single Line Diagram 600P1500 (Cristal 2013) ... 106
Figure B-2: P6512 – 415VAC Motor Control Centre K4 Single Line Diagram 600P1524 – Sheet 1 of 3 (Cristal 2011) ... 107
Figure B-3: P6512 – 415VAC Motor Control Centre K4 Single Line Diagram 600P1525 – Sheet 2 of 3 (Cristal 2011) ... 108
Figure B-4: P6512 – 415VAC Motor Control Centre K4 Single Line Diagram 600P1526 – Sheet 3 of 3 (Cristal 2012) ... 109
Figure F-1: Time-current characteristics for NIT fuses – 2 to 20 A (Cooper Bussmann 2014) ... 130
Figure F-3: Time-current characteristics for TIA, and TCP32 (Cooper Bussmann 2014) ... 132 Figure F-4: Time-current characteristics for TCP80 to TCP100, TFP125 to TFP200, TKF250 to TKF315, TMF355 to TMF400, and TTM450 (Cooper Bussmann 2014) ... 133 Figure F-5: Time-current characteristics for TIS63M, TCP100M, and TFP200M (Cooper Bussmann 2014) ... 134 Figure F-6: Time-current characteristics for BS88 Fuse Links – type gG (Ferraz Shawmut 2014) ... 135 Figure F-7: Time-current characteristics for BS88 Fuse Links – type gM (Ferraz Shawmut 2014) ... 136 Figure F-8: Time-current characteristics for Telemecanique LR1F105 to F1000 (C&S Electric Ltd 2014) ... 137 Figure F-9: Time-current characteristics for Telemecanique GV7 R Thermal Magnetic Motor Circuit Breaker (Schneider Electric 2014) ... 138 Figure F-10: Time-current characteristics for Merlin Gerin Multi 9 – C60 (C curve) Circuit Breaker (Schneider Electric 2014) ... 139 Figure F-11: Time-current characteristics for Merlin Gerin Multi 9 – NC100H (C curve) Circuit Breaker (Square D 1998) ... 140 Figure H-1: Existing Sub K4 MCC (P6512) Feeder TCC ... 175 Figure H-2: Proposed Sub K4 MCC (P6512) Feeder TCC ... 176 Figure H-3: Grading of existing network to largest drive on Sub K4 MCC (P6512) ... 177
Figure H-4: Grading of proposed network to largest drive on Sub K4 MCC (P6512) ... 178 Figure H-5: Existing Sub K4 MCC (P6512) Feeder TCC and SLD ... 179 Figure H-6: Proposed Sub K4 MCC (P6512) Feeder TCC and SLD ... 180 Figure H-7: Grading of existing network to largest drive on Sub K4 MCC (P6512) ... 181
Figure H-9: Grading of proposed network from MCC K4 (P6512) to 1.1kW G658A
Emergency Jacking Water Pump ... 183
Figure H-10: Grading of proposed network from MCC K4 (P6512) to 22kW G691 Blower Motor ... 184
Figure H-11: Grading of proposed network from MCC K4 (P6512) to P6557 Socket Outlet ... 185
Figure H-12: Grading of proposed network from MCC K4 (P6512) to Feeder to ENG-TX4 Transportable ... 186
Figure H-13: Grading of proposed network from MCC K4 (P6512) to 1.5kW Boiler house Roller Door Motor ... 187
Figure H-14: Grading of proposed network from MCC K4 (P6512) to 15kW G6123A Boiler Feed Pump ... 188
Figure I-1: Arc Flash Label for Incoming Supply Tier of MCC K4 (P6512) ... 189
Figure I-2: Arc Flash Label for MCC K4 (P6512) ... 190
Figure I-3: Arc Flash Label for P6019 Emergency Water Control Panel ... 191
Figure I-4: Arc Flash Label for P6612 Boiler F690 Control Panel ... 192
Figure I-5: Arc Flash Label for P6557 415VAC Electrical Distribution Board .. 193
Figure I-6: Arc Flash Label for P6557 Socket Outlet ... 194
Figure I-7: Arc Flash Label for 415VAC Primary winding terminations of 110VAC Instrumentation Distribution Board Feed Transformer ... 195
Figure I-8: Arc Flash Label for P6446 415VAC Electrical Distribution Board .. 196
Figure I-9: Arc Flash Label for P6711 415VAC Electrical Distribution Board .. 197
Figure I-10: Arc Flash Label for ENG-TX4 Transportable 415VAC Electrical Distribution Board ... 198
Figure I-11: Arc Flash Label for P6594 415VAC Electrical Distribution Board 199 Figure I-12: Arc Flash Label for Diesel Tank Control Panel ... 200
Tables
Table 1-1: Abbreviations ... 3
Table 1-2: Definitions ... 3
Table 2-1: Statistics of Arc Flash Incidents (Das 2012, p. 28) ... 16
Table 2-2: Limitation of calculation methods (NFPA 70E 2012, p. 63) ... 23
Table 3-1: Protective device data (IDC Technologies 2013, p. 107) ... 31
Table 3-2: Classes of equipment and typical bus gaps as given in Table 2 of IEEE 1584 (2002, p. 9) ... 41
Table 3-3: Classes of equipment and typical working distances as given in Table 3 of IEEE 1584 (2002, p. 9) ... 45
Table 3-4: Factors for equipment and voltage classes as given in Table 4 of IEEE 1584 (2002, p. 12) ... 47
Table 3-5: Arc Flash Hazard/Risk Category Table ... 52
Table 3-6: Protective Clothing and Personal Protective Equipment (PPE), Table 130.7(C)(16), NFPA 70E (2002) ... 52
Table 4-1: Arc Flash Analysis results for the existing power network (up to MCC P6512) ... 66
Table 4-2: Arc Flash Analysis results for the existing power network (up to the incoming tier of MCC P6512) ... 79
Table 4-3: Arc Flash Analysis results for the existing power network (up to the remaining tiers of MCC P6512) ... 80
Table C-1: Electrocution hazard ... 110
Table C-2: Arc Flash incident ... 111
Table C-3: Muscle injury ... 112
Table G-1: Arc Flash Results for the existing network (minimum utility fault level scenario) ... 148
1.
Introduction
Arcing faults occur when electric current passes through vapour between two conducting materials. The resulting high arc temperatures can cause fatal burns, even when standing several metres from the arc. The electric arc also can shower droplets of molten metal in the surrounding area, causing a further hazard. The arcing fault current is smaller than a bolted short-circuit because the vapour acts as an impedance between the conducting materials. This effect is generally more significant at a low voltage (e.g. 415VAC) level than at the higher voltages, and may substantially increase the protective device operating times when compared to bolted faults. The concussive effect of the accompanying arc-blast presents an additional hazard.
1.1
Statement of Task
1.2
Objectives
Key objectives of the research are as follows:
Choose the most appropriate “potentially at risk”
switchroom/MCC.
Research relevant standards, codes, and legislation.
Paper review of the description and physics of low voltage arc formation and quenching; and correlate and compare to standards, codes and legislative requirements.
Carry out power and quality surveys to provide a basis for the determination of arc flash values, and hazard assessment for equipment, hazardous area/s and plant in general.
Carry out a risk and criticality assessment of the equipment and related hazardous zone/s.
Determine fault levels and arc flash significance.
Review site switching procedures and user PPE requirements.
Review whether it may be best to upgrade or replace equipment by carrying an out technical and safety cost benefit analysis between upgrading current equipment against the replacement with the latest equipment (MCCs) on the market.
1.3
Abbreviations
The following abbreviations are used in this document:
Table 1-1: Abbreviations
Abbreviation Term Description
AFB Arc Flash Boundary
HV High Voltage
IE Incident Energy (Arc Flash)
MV Medium Voltage
MCC Motor Control Centre
LV Low Voltage
SLD Single Line Diagram
PPE Personal Protective Equipment
TCC Time-current Characteristic Curves
WD Working distance
1.4
Definitions
Table 1-2: Definitions
Term Definition
Arc Flash Hazard A dangerous condition related to the potential release of energy
due to an electric arc.
Bolted Fault Current Initial symmetrical three phase rms short-circuit current
(including motor contributions).
Term Definition
Arc Flash Boundary An approach distance to live exposed conductors where the
incident energy falls to 1.2 cal/cm2, which corresponds to the onset of second degree burns.
An alternative definition is:
The distance from live conductors within which a person could receive a second degree burn or greater.
Arc Flash Incident Energy The amount of energy normal to a surface at a specified distance from the arc source, usually the working distance.
Working Distance The distance between the arc source and the workers chest or
face.
Gap The spacing between bus bars or conductors at the arc
location.
Personal Protective Equipment
2.
Background
Incidents and accidents within industry often place a massive burden on a company’s profitability. A death at work creates many issues (beside the obvious), including a low morale within the workforce, and a massive rise in insurance premiums, while also opening up a company for litigation. An Arc Flash Protection assessment is increasingly being recognised as a safety priority in Australian manufacturing, and also generally within the electrical industry. It forms one proactive way of assisting in the reduction of incidents and accidents, which can cause plant downtime and/or, in a worst case, employee injury or death.
2.1
Arc Flash
As more study and literature has been carried out, it has now become incumbent, as electrical workers, to consider the potential hazard of arc flash, and avoiding it has become one of the main challenges to be confronted within the electrical industry. The emotional and financial cost of an arc flash event can be extensive, and thus arc flash should be considered in conjunction with any current, or future, power network design.
2.1.1 What is arc flash?
To fully appreciate the origin of an electric arc, it is worthwhile looking at what occurs when a circuit breaker is opened. As the circuit breaker’s contacts part, the resistance at the contact point increases. This in turn generates heat. The heat assists the air between the contacts to ionise, allowing the current to be maintained (in the form of a plasma discharge). The arc is extinguished when the voltage level at the ends of the arc contain enough energy to counteract the amount of heat that is being dissipated, while also having the capability to maintain appropriate temperature. One way of extinguishing the arc earlier is by elongating and cooling the arc (ABB SACE 2013).
The term “arc flash” is given to the event where an unpredicted arc is generated. This arc can have the potential to cause external burns and injuries to people, as well as the subsequent potential damage to surrounding infrastructure. The intense temperature that can be generated by an arc, can cause fatal burns to a person within a distance of 5 feet (1.52 m), and major burns up to 10 feet (3.05 m) (Lee 1982). The arc can produce temperatures and pressures that can vaporise metal and shower the immediate area around the arc with droplets of the molten material.
Figure 2-1 shows an example of an arc flash.
2.1.2 Common causes of arc flash
Arc flash can quite often be inadvertently caused as a result of a human error (i.e. by a worker working on or near the vicinity of live equipment). This can be due to a mistake, such as accidently dropping a non-insulated spanner (or other tool) across live bus bars, or by closing a live isolation switch onto an earthed cable.
However, arc flash can also occur when safe clearances are compromised. There are several other common reasons why arc flash occur.
In their reference manual “Practical Arc Flash Protection for Electrical Safety Engineers & Technicians”, IDC Technologies (2013) lists several common reasons for arc flash. Some of these include:
Dust or other impurity build up on insulators may provide a path for a current. This can cause an arc discharge path across the surface and can quite often be the cause of fires.
Corrosion can be the cause of impurities or oxidation of materials, which can cause increases in the resistance of the contacts of conductor terminations (e.g. corrosion of switch contacts).
Contamination can occur within switching mechanisms, which can cause the air gap to be compromised, leading to arcing.
Vapour condensation or water ingress can result in current tracking across insulators or between air gaps.
Poorly designed and maintained equipment, incorrect work practices and structural failure of insulating materials can also cause arcing.
2.1.3 Arc flash hazards
There are a number of hazards that are directly related to an arc flash event. These include:
Electric shock
Thermal burns
Projectiles
Blast and pressure waves
Intense light
Intense sound
Fire
Effects due to powerful magnetic fields and plasma
Toxic gases and vapours
The extent to which these hazards are dangerous is dependent on a few different factors:
1. The amount of the arc current
2. The length of time that the arc exists
2.1.3.1 Arc current
The arc current is governed by the amount of impedance at the point at which the arc flash occurs. That is, the fault (arc) current is considerably less at the end of a distribution network than it is nearer to the source. This is due to the extent of the circuit’s impedance at the fault’s location. Therefore, a short-circuit fault at the end of circuit is much less dangerous than it would be at its supply.
It should be noted that although arc energy is related to the short-circuit bolted fault level at a given point, the arc fault current will be less in value due to the arc’s own impedance.
2.1.3.2 Arc time
It should be noted that although it has previously been stated (in 2.1.3.1 above) that the arc current value of a fault will be less due to the distance from its source (which is true), this situation may still have a significant impact on the damage that can occur. The reason for this is that the circuit’s protective device is also likely to be a fair distance from the fault location. In this case, this lower fault current could cause a delay in the operation of the protective device, allowing the arc flash event to continue for longer than that of a fault closer to the protective device. Thus, there can be a significant increase in damage even though the arc current is lower.
2.1.3.3 Hazardous materials
Another important factor is the housekeeping of the immediate vicinity of a possible a possible arc flash event. This is especially important in locations such as switchrooms, where storage (or placement) of flammable and explosive materials could exasperate the damage caused by the arc flash event itself.
2.1.4 Properties of an arc flash
When an arc is initiated by a fault, it is never static. Powerful electromagnetic fields are created due to the fault current, which causes the arc to shift away from the supply point. As previously stated, the arc causes a rapid heating of the surrounding air, which triggers the air to vehemently expand. This, in turn, can result in parts being propelled outward from the fault location, which can cause subsequent damage to adjacent workers and/or infrastructure.
To provide some perspective of the danger of an arc flash event, the following describes some of the effects that occur (IDC Technologies 2013):
The temperature produced by the arc can be in the region of 20,000°C (35,000°F). This is as much as 4 times that expected on the surface of the sun.
The pressure created by the intense heating effect of the arc can result in a blast of hot air, much like that experienced in an explosion. It can cause a rapid expansion in any surrounding uncontained gas, which may cause parts and other equipment to be forced outward at high speed, causing significant damage to the adjacent area.
Further to the vapour spread of the copper residue that is stated above, if not contained this has the potential to cause other creepage infringements. This can include, but not be limited to, initiating arc flash events on other nearby infrastructure.
It should be noted that the temperature and pressures produced by an arc are dependent on the arc voltage, and on the current and duration of the arc. However, in the case of a low voltage fault, once an arc of a length of 75-100mm is stable, it can remain active for a prolonged time (IDC Technologies 2013).
Figure 2-2 illustrates he effects that can occur when an arc flash takes place.
2.1.4.1 The effect of an arc fault within an enclosure
When the arc flash takes place within a panel or enclosure (such as in a Motor Control Centre or Switchboard), the effects described above are magnified. This can be best described in the following four phases (Das 2012):
Phase 1 – Compression
The air surrounding the arc overheats, which in turn heats up the rest of the air within the closed-in cabinet (due to convection and radiation). Rapidly the internal pressure increases.
Phase 2 – Expansion
Eventually the pressure becomes too great to be contained within the enclosure. A component (or part) will give way causing a rapid release of the superheated air, vapour and shrapnel. If there is not a possible release path for this pressure (for example, where “explosion vents/ducting are employed), potentially the cabinet could blow apart. After the initial explosion, the pressure will subside.
Phase 3 – Emission
The pressure of the superheated air will continue at a constant level while the arc still persists.
Phase 4 – Thermal
If work was being carried out on an enclosure, such as a Motor Control Centre (MCC) or switchboard, one would expect that either a panel door or side panel will be open. If a fault were then to occur in this enclosure, the effects described above will be concentrated toward the open side of the enclosure, thus inflicting maximum injury and damage. To assist in limiting this type of result, quite often new MCCs are now designed and fitted with ducting to divert any potential arc flash (pressure and temperature) away from these access points.
It should be noted that past statistical data shows that most arc flash incidents occur when an operator or worker is working on a piece of equipment with its doors open (see Table 2-1).
Table 2-1: Statistics of Arc Flash Incidents (Das 2012, p. 28)
Accident Occurrence Percentage
When the operator or worker is working with equipment doors open 65
When the operator or worker happens to be in front of a closed door
and the equipment is not arc resistant 10
When the operator or worker is not present at all and the equipment is
2.1.5 How location affects the hazard
The outcome of an arc flash incident can be greatly affected by its location. As previously stated, an incident involving an enclosure can be more severe when compared to an incident in an open area. In an open area the incident energy of the arc flash is allowed to disperse evenly in all directions, thus reducing the severity of the effect at any one point. This is vastly different to that resulting from a small enclosed space (such as a MCC or switchboard); where the resultant arc flash incident energy will be concentrated toward the open, or weakest, side. In this case, the personal exposure of a worker located in front of this opening can be perilous.
It should be noted that it is quite normal for a worker/operator to perform switching or fault finding on an MCC while it is still energised. In this scenario, the worker could possibly be within a ruler length of a potential arc flash. Therefore, it is vital that a risk assessment has been carried out on the work before starting. It is also important that any written procedures/instructions are followed, the correct tools (meters, leads etc.) for the work are used, and are used correctly, and that the necessary personal protective equipment (PPE) is worn, to reduce any possible exposure to an incident.
2.1.6 The personal consequence of an arc flash occurrence
Some of the direct costs of an arc flash incident include:
Casualty treatment costs that may exceed $1,000,000/case (IDC Technologies 2013)
Litigation fees
Production losses from downtime
Equipment replacement cost and/or repair
Fines
Accident investigation cost
Increase in insurance premiums
The total cost of an arc flash event can be between $8-10M US (Weigel 2014). However, the emotional and/or psychological impact can be much more.
2.2
Arc Flash Hazard Studies – Codes and Standards
Codes and standards are produced to ensure products and installations comply with a certain level of functionality, and ultimately, safety. They are a massive collection of accumulated knowledge and expertise and are a guide to safe practice. They are the tools used to establish the norms in management procedures and they underpin a consumers expectations that goods and services will be safe, reliable and fit-for-purpose. In the electrical industry, this is usually provided by the Australian Standards, which are usually consistent with the IEC standards. These standards provide a way of ensuring that engineering results remain consistent. Unfortunately, at present, Australia does not yet have its own standard to cover the mitigation of the impact of arc flash event.
2.2.1 Australian industry and Arc flash standards
However, as previously pointed out, Australia does not have a standard directly concerning the potential personal impact of an arc flash, but it does have a guideline that concerns the selection, use and maintenance of personal protective equipment for electrical hazards (Energy Networks Association (ENA) – NENS 09−2006). This guideline contains formulae for calculating the Heat Flux value (in cal/cm2) of single phase and three phase faults, and a table for determining the minimum PPE that should be used. However, it does not consider the actual arcing current, and it assumes that all faults only have a fault duration of 0.1 seconds (Energy Networks Association 2006).
It should also be noted that the Australian Wiring Rules Standard AS/NZS3000: 2007 does consider and has provision for determining the fault duration of an arcing fault. This is primarily for the purpose of limiting the damage that can potentially occur to a switchboard, in the advent of potential internal arcing faults (Clause 2.5.5). However, the calculations involved are based on an assumption that the arcing current is normally between 30 and 60% of the prospective short-circuit current (Standards Australia 2007). This not only does not consider the actual arcing current, but also does not consider the personal impact of a fault.
In his presentation to the 2010 Electrical Arc Flash Forum, Peter Willis (2010) explains that with regards to arc flash hazard studies, the challenges that the Australian end-user face include:
Working with the foreign standards in the Australian workplace and working through their inconsistencies. This relies on the user taking the international standard and trying to apply it to their own situation. In doing so, the user will be required to make some of their own assumptions.
Working without access to any recognised Australian or IEC Standard. Obviously, if guided by an Australian Standard, the user will feel confident that the work is within the guidelines set out solely for the Australian industry.
Trying to limit the concerns with the problems associated within the IEEE 1584 and NFPA 70E.
It should be noted that in conjunction with the standards IEEE 1584 and NFPA 70E, a range of arc flash software tools are available. These programs enable simple design checks for arc flash, and are very useful in conjunction with any arc flash hazard study. However, these software packages still do not consider some of the problems that are encountered within the IEEE 1584 standard, with some basic engineering principles having been neglected. Peter Willis (2010) notes that these include:
The relationship of switchgear segregation with arc propagation and the identification of protection clearing locations
The risk assessment process to match various activities with the appropriate hazard controls
The treatment of multiple sources, staged protection clearing and motor contribution
The correct application of the hierarchy of controls
2.2.2 The difference between the standards IEEE 1584 and NFPA 70E
As it has been pointed out, the standards are a guide on performing arc flash calculations and implementing appropriate safety requirements.
The NFPA 70E standard was primarily established for use by employees, employers and the US Occupational Safety and Health Administration (OSHA). Contained within this standard is a section which relates to the potential dangers of workers working on or near to energised equipment. This standard provides a method of calculating the incident energy at a point in a circuit through the use of “a theoretical value of power dissipated by arcing faults” (IDC Technologies 2013). This results in a generally conservative figure and is based on work carried out by Ralph Lee.
However, to calculate incident energy, the IEEE 1584 standard uses empirical equations, which have been derived from actual laboratory testing. This method results in a much more realistic value and helps to restrict the working limitations that would be put in place if the NFPA 70E result were to be used. However, one should be aware that the equations used are a result of laboratory testing, which may differ to the conditions one might be presented with in the field.
Unfortunately, both standards do not adequately address the hazards of arc flash. However, they do provide a model from which these hazards can then be addressed (e.g. PPE requirements etc.).
Table 2-2: Limitation of calculation methods (NFPA 70E 2012, p. 63)
Section Source Limitations/Parameters
D.2, D.3, D.4 Ralph Lee Paper Calculates arc flash boundary for an arc in open air;
conservative over 600 V and becomes more
conservative as voltage increases
D.5 Doughty/Neal
Paper
Calculates incident energy for three-phase arc on
systems rated 600 V and below; applies to short-circuit
currents between 16 kA and 50 kA
D.6 Ralph Lee Paper Calculates incident energy for three-phase arc in open
air on systems rated above 600 V; becomes more
conservative as voltage increases
D.7 IEEE Std. 1584 Calculates incident energy and arc flash boundary for:
208 V to 15 kV;
Three-phase;
50 Hz to 60 Hz;
700 A to 106,000 A short-circuit current; and
13 mm to 152 mm conductor gaps
D.8 ANSI/IEEE C2
NESC, Section 410
and Table 410.2
Calculates incident energy for open air
2.3
Arc Flash Hazard Study deliverables
Once completed, an arc flash hazard study should provide an insight into the potential damage that may occur in the event of an incident. This should provide direction to what precautions should be taken to assist in mitigating the risk of exposing people to injury. Using this information, work procedures can be developed to ensure the safety of plant equipment and the personnel who work on them.
Some of the deliverables that should be expected from an arc flash hazard study should include:
An accurate Single Line Diagram (SLD) of the sites electrical distribution
A review of the sites protection system, and any updating as required
A value for the fault level at the point within the network being studied
An estimated value for the arcing current and the incident energy
A figure for the flash protection boundary
A determination of the hazard/risk category at the point studied
2.4
Cristal Pigment Australia, Kemerton
2.4.1 Company profile
Cristal is the second largest producer of Titanium Dioxide (TiO2) in the world. Cristal operates eight TiO2 manufacturing plants across five continents, with locations in Ashtabula, Ohio; Baltimore, Maryland; Salvador, Bahia; Stallingborough, UK; Thann, France; Yanbu, Saudi Arabia; Bunbury, Australia; and a mine site in Paraiba, Brazil (Cristal 2014).
TiO2 is a bright white powder, which is made from titanium ore and has the ability to pigment virtually any material. Its opacity, brightness and durability have made it a vital addition to paint formulas. Although this is its primary function, TiO2 is also used is diverse products, such as printing inks, paper, ceramics, glass, leather, synthetic fibres and colour formulated art paints (Cristal Pigments Australia 2014).
Cristal has several sites in Western Australia. These include a Mineral Sands Mine in Wonnerup, a Heavy Mineral Separation Plant in Bunbury, a TiO2 Manufacturing Plant in Kemerton Industrial Park, Wellesley, a TiO2 Finishing and Packaging Plant in Australind, and a Warehouse in Henderson. The three latter sites comprise Cristal Pigments Australia. Of these, the two facilities at Kemerton and Australind form the Cristal Pigments “Bunbury Operations”, which are used to produce and package TiO2 for Cristal.
2.4.2 Arc flash protection study of a motor control centre
The Kemerton plant is a manufacturing plant, while the Australind plant is a packaging plant. The manufacturing plant is 25 years old, while the packaging plant is over 50 years. The motor control centres (MCCs) in both plants have had limited arc flash assessment carried out, and they are unlikely to provide the necessary arc flash protection. As such, there is an internal company drive to conduct a survey of the site’s switchrooms (and operation methods), to assess their potential arc flash fault levels, and to make recommendations to reduce the risk of damage and injury to equipment and personnel.
As it is a very large commitment to perform an arc flash study on the plant as a whole, it was proposed that in this project the study would be confined to one switchroom (Electrical Distribution Centre - EDC). The chosen MCC is located in a switch room at the Kemerton facility. The switch room has the identifier of EDC K4, while the LV MCC’s tag reference is P6512. This particular MCC was selected as its layout is not too complex, thus hopefully permitting the completion of this study to occur within the time frame that has been allowed.
3.
Methodologies
From the outset, it should be noted that for this particular study, it will be accepted that the arc flash calculations will be conducted in-line with the analysis method of the IEEE 1584 (IEEE Guide for performing Arc-Flash Hazard) Standard. This decision was formed by the perception of a more accurate result, while also considering the limitations of the look-up tables provided in the NFPA 70E (USA National Electrical Code) Standard. If used, the NFPA 70E would be based around a more generous value for fault current. This would likely make any study recommendation prohibitive, especially where work is carried out near energised equipment. That is, the result would likely mean that there would be more obstructions that would need to be in place to conduct one’s work. In some cases, it would prevent work from being carried out at all. Therefore, a level of common sense has been taken in making the decision to use IEEE1584 Standard.
3.1
Modelling of the Power System
The first step in any arc flash hazard study is to produce a model of the power system. The power system model is important to aid in the calculation of the prospective fault levels at the different locations within the power network. This model also becomes a useful tool in the design, planning, maintenance and operations of the power system.
3.1.1 Data collection and system modelling
Data collection is one of the most important aspects of the arc flash study. It also forms one of the more time consuming elements of the study. However, if the data collected is not accurate, the study will not reflect the actual installation, which will subsequently affect the results of the following arc flash hazard analysis.
Much of the data required for an arc flash hazard study is also comparable to that required when performing a short-circuit and protection coordination study. These studies require having up-to-date information about the plant, and its electrical equipment, to assist in creating an accurate single line diagram (SLD) of the network.
It should be noted that the accuracy of this information is of the upmost importance, as arc flash energies may be worse at lower fault currents, especially as the clearing times for the current protective devices may be significantly long.
3.1.1.1 Power system modelling data
The following items need to be addressed to successfully complete the Power System modelling:
i. The location of equipment within the power system need to be
identified.
ii. All equipment data needs to be collected, including:
Voltage rating, size (in MVA), impedance, X/R ratio
Protective device features, including the type of device, the existing settings for relays, circuit breakers and trip units, the current rating, their time-current curve (TCC) characteristics, and their clearing time
Conductor and cable data is required to calculate its impedance. The cable route and support method needs to be verified as well as the cables length
Other data on subsidiary power system equipment,
including the type of equipment, the grounding type, and the number of phases
The current power system connections, and consideration of any possible alternatives
iii. The supply authority (or network provider) is required to be contacted to request the fault MVA and power angle or X/R ratio at the point of supply (see application form in Appendix E).
Table 3-1: Protective device data (IDC Technologies 2013, p. 107)
Protective Device Description
Data to gather
Relay Type, CT ratio, pickup setting, delay time and setting time
Fuse Type, amp rating, voltage, peak up through current
Breaker Type, fault clearing time, pickup setting, delay curve, delay
setting
3.1.1.2 Arc flash study data
For the completion of the Arc Flash study itself, other information will also be required. This information may include:
i. The type of enclosure in which the equipment is installed ii. The gap distance between any live conductors, or bus bars iii. The approximate working distance for the equipment
iv. The location in which the equipment is placed (e.g. whether it is in or adjacent to a hazardous area)
3.1.2 Power System Single Line Diagram (SLD)
A SLD is a simplified representation of the three-phase power system. It is used for documenting and communicating information about the power system.
Once all the power system data has been collected, a SLD of the power network can be prepared. The single line diagram will show the power distribution arrangement of the network, with the relative placement of all the electrical equipment in the network.
The SLD will display all equipment belonging to the power network. These can include:
Transformers
Transmission lines
Distribution circuit
Electrical system grounding
Current limiting devices
Voltage correction or stabilization capacitors
Switchgear
Motor control centres (MCC’s)
Switchboards
Protective devices
Feeders or bus bars
Motors down to 400V level
3.2
Short-Circuit Analysis
3.2.1 Data required for short-circuit study
The next step is to perform a short-circuit study on the network. Once all the information has been collated, the equipment data is added to the SLD. Using this “combined” information, the designer should now be able to determine the bolted fault current level.
The data required to carry out a short-circuit analysis includes information on the equipment type, voltage, MVA/kVA, impedance, X/R Ratio, and phase/connection (IDC Technologies 2013).
When calculating for maximum and minimum short-circuit currents, the following is also required:
The maximum and minimum Utility three-phase short-circuit contribution an R/X to a short-circuit at the PCC (Point of Common Coupling).
The value of the voltage factor ‘c’ used to calculate the Utility contribution to be able to determine the short-circuit currents. Note that for this particular project, the Utility contribution voltage factor “c” was not used.
The Initial symmetrical rms short-circuit current (I”k3). The calculation of short-circuit currents should be in-line with that presented in AS3851 (1991) – The calculation of short-circuit currents in three-phase a.c. systems.
Consideration of all potential sources. These may include utilities, generators and motors greater than 37 kW (due to a motors ability to store energy in their magnetic circuit).
Note: Some equipment in the network may not require an arc flash hazard assessment, but their data will still likely be required to perform the short-circuit study.
3.2.2 Determine the possible modes of operation
The next step is to review the system to ensure an understanding of all its possible modes of operation. That is, it may be possible to change the configuration of the network by introducing new supplies. It is imperative that both the maximum and minimum short-circuit current levels are calculated for all operating modes. These figures are likely to be different when two different modes are utilised.
IEEE 1584 (2002, p. 7) lists the following example modes of operation:
One or more utility feeders in service
Utility interface substation secondary bus tie breaker open or closed
Unit substation with one or two primary feeders
Unit substation with two transformers with secondary tie opened or closed
MCC with one or two feeders, one or both energised
3.2.3 Determine the bolted fault currents
Once all information is available, the initial bolted symmetrical rms short-circuit current (I”k3) for each point of interest can be determined. This calculation should be in-line with that presented in AS3851 (1991). There is commercially available software to calculate the bolted fault current. In fact, for a simple radial system for up to 600V, suitable software is available with the purchase of the IEEE 1584. However, for a simple system, it can be just as easy to do the calculations by hand.
NOTE: Fault studies examine prospective system current levels under various fault conditions. These studies will typically look at a maximum and a minimum fault level for the protective equipment selection, to ensure that equipment protection settings will operate. The study will also typically look at the bolted three-phase and single-phase to ground fault levels as these are required for various protection devices.
3.3
Protection System Study
The function of a protection device involves three pivotal requirements. These include safeguarding the power network to maintain continuity of supply, minimising the damage that may happen if a fault occurs, and adequately protecting the safety of personnel. To provide this, the protective device needs to be able to display the following attributes (IDC Technologies 2013):
Selectivity – To only isolate the equipment that is under fault.
Stability – To operate in such a manner that its operation does not contribute to expanding the loss of supply to other “healthy” circuits.
Speed – To ensure is operation is quick enough to limit damage to the equipment and to personnel.
Reliability – To ensure that it does operate when a fault occurs.
Economical – To provide maximum protection at minimal cost.
With respect to the arc flash hazard analysis, the protection of the power network has a substantial impact on the potential incident energy at any given point of the installation. Incorrect protective devices, or devices with incorrectly settings, can not only cause issues with coordination, but also has a major influence on the disconnection (clearing) time of the circuit’s supply. This can have a significant impact on the damage that may occur due to an arc flash incident.
To carry out a phase overcurrent coordination study of the protection system, information is required on all of the phase overcurrent protective devices (e.g. fuses, circuit breakers etc.) within the network. The make, model and device settings are required so technical information can be sourced for their Time-Current Characteristic Curves (TCC). Armed with this information the study can commence.
The TCCs of all of the interconnected devices should be modelled on a common graph and common scale (at a common voltage base) to consider coordination. After considering the existing protection settings, proposals should be made where there are opportunities to optimise the protection settings of the network’s protective devices (to provide improved circuit protection). Mal-grading of the devices with upstream protection should also be considered and if found, rectified where possible.
3.4
Arc Flash Analysis
The first actual step of the arc flash analysis study is to calculate the arcing short-circuit current. The value of the arcing short-circuit current is generally substantially different to that of the bolted short-circuit current due to the impedance at the fault location. That is, a bolted short-circuit infers that the short is the result of a solid connection, where as an arcing short is the result of plasma crossing a gap.
3.4.1 Non-linear nature of arcing short-circuit current
It should be noted that the arcing short-circuit current cannot be easily derived from the bolted short-circuit current. One would expect that it could easily be calculated as a percentage of the bolted current, but this is not the case, due to the variations that can occur in the value of the impedance of the fault.
3.4.2 Why use a three phase model
The main reason the IEEE 1584 standard is based on a three-phase model is due to the fact that although many faults begin as a single-phase to ground fault, the resulting flash event usually propagates to three-phase fault. Thus, as a three-phase fault is generally likely, and that its calculation result is more conservative, the three-phase model has been subsequently adopted by the IEEE.
3.4.3 Determine the arcing currents
As previously discussed, the amount of damage that is the result of an arc flash can be decreased by limiting the arcing current and the time taken to operate a circuit’s protective device. IEEE 1584 (2002) calculates the predicted three-phase arcing current using two different equations, one where the system voltage is < 1 kV and another where this voltage is > 1 kV.
Note: If the system voltage is > 15 kV, the Lee equations are required.
For system voltages < 1 kV, use:
𝑙𝑜𝑔𝐼𝑎 = 𝐾 + 0.662(𝑙𝑜𝑔𝐼𝑏𝑓) + 0.0966𝑉 + 0.000526𝐺 + 0.5588𝑉(𝑙𝑜𝑔𝐼𝑏𝑓)
− 0.00304𝐺(𝑙𝑜𝑔𝐼𝑏𝑓)
where;
𝑙𝑎 is the arcing current (kA)
𝐼𝑏𝑓 is the bolted fault current for the three-phase fault (symmetrical RMS; kA)
𝑉 is the system voltage (kV)
𝐺 is the gap between the conductors (or bus bars; mm)
In instances where the system voltage is ≥ 1 kV (but less than 15 kV), the following formula is used instead:
𝑙𝑜𝑔𝐼𝑎 = 0.00402 + 0.983𝑙𝑜𝑔𝐼𝑏𝑓
Note: The open and box configurations are not required in this case.
Once the value for 𝑙𝑜𝑔𝐼𝑎 has been found 𝐼𝑎 is easily found by using the formula:
𝐼𝑎 = 10𝑙𝑜𝑔𝐼𝑎
The IEEE 1584 (2002) indicates that two arcing current values should be determined. The first value is based on the figure for 100% of the arcing current. However, a second value of 85% of the arcing current is also required. These values are crucial when investigating the arc flash duration.
Table 2 from the IEEE 1584 (2002) standard has been replicated below in Table 3-2:
Table 3-2: Classes of equipment and typical bus gaps as given in Table 2 of IEEE 1584 (2002, p. 9)
Classes of equipment Typical bus gaps (mm)
15 kV switchgear 152
5 kV switchgear 104
Low-voltage switchgear 32
Low-voltage MCC’s and panelboards 25
Cable 13
Other Not required
3.4.4 Determine of arc flash duration
To determine the clearing time of the protection device, the device’s TCC is used. The two estimated arcing current values (85% and 100%) are superimposed onto the TCC as vertical lines. The arc flash duration is simply read from the TCC, where the “worst case” estimation for the arcing current (shown as a vertical line) crosses the clearing (upper) line of the protection time-current curve (i.e. the crossing with the greatest duration in time). It is important to note that fuse manufacturers don’t always give the clearing time on their TCC. Quite often they only give their pre-melt time. In these cases, the total clearing time curve will need to be calculated and added to the TCC.
3.4.5 Limitation of damage of a switchboard to an arcing fault
Clause 2.5.5.3 in the Wiring Rules standard – AS3000 (2007) states that “Protective devices shall be provided to limit, as far as practicable, the harmful effects of a switchboard internal arcing fault by automatic disconnection”. AS3000 (2007) suggests that the arcing fault should be considered as between 30 and 60% of the expected short-circuit current, and to limit the potential damage to the switchboard, a calculated clearing time (based on the 30% value of the prospective fault current) shall not be exceeded.
The calculated clearing time is given in AS3000 (2007) as:
Clearing time
𝑡 =
𝑘𝑒×𝐼𝑟 𝐼𝑓1.5where;
𝑡 is the clearing time (seconds)
𝐼𝑓 is 30% of the prospective fault current (A)
𝐼𝑟 is the current rating of the switchboard (A)
𝑘𝑒 is a constant of 250, based on acceptable volume damage
3.5
Determining Incident Energy
To determine the appropriate level of personal protective equipment (PPE) required to perform a certain task (work) within the arc flash protection boundary, the incident energy of a potential fault first needs to be calculated. The incident energy value is the most critical element of the arc flash study procedure, as it defines what can be done and how.
3.5.1 Incident energy
The IEEE 1584 (2002) defines in clause 3.14 the incident energy as “The amount of energy impressed on a surface, a certain distance from the source, generated during an electrical arc event”. In general terms, the incident energy is the thermal energy that is experienced at a pre-determined distance (known as working distance). It is expressed in joules per square centimetre (J/cm2), but as the NFPA 70E look-up tables use calories per square centimetre (cal/cm2) to quantify the Hazard Risk Category, it is common to convert this to cal/cm2 by dividing the J/cm2 value by 4.148.
3.5.2 Select the working distances
The working distances from equipment at different voltage classes are given in the IEEE 1584 (2002) standard, in Table 3. This table has been replicated on the below in Table 3-3:
Table 3-3: Classes of equipment and typical working distances as given in Table 3 of IEEE 1584 (2002, p. 9)
Classes of equipment Typical working distancea
(mm)
15 kV switchgear 910
5 kV switchgear 910
Low-voltage switchgear 610
Low-voltage MCC’s and panelboards 455
Cable 455
Other To be determined in the field
a Typical working distance is the sum of the distance between the worker standing
in front of the equipment, and from the front of the equipment to the potential arc
3.5.3 Determine the incident energy (≤ 15 kV)
Clause 5.3 in IEEE 1584 (2002) shows how the incident energy can be calculated. The first step is to calculate the log of the normalised incident energy at a normalised working distance of 610mm and arc time of 0.2 seconds using the following formula:
𝑙𝑜𝑔𝐸𝑛 = 𝐾1+ 𝐾2+ 1.081(𝑙𝑜𝑔𝐼𝑎) + 0.0011𝐺
where;
𝐸𝑛 is the normalised incident energy (J/cm2)
𝑙𝑎 is the arcing current (kA)
𝐺 is the gap between the conductors (or bus bars; mm)
𝐾1 is -0.792 for open configurations (no enclosure), or -0.555 for box
configurations (enclosed equipment)
𝐾2 is 0 for ungrounded and high-resistance grounded systems, or
-0.113 for grounded systems
To find the normalised incident energy use the formula:
𝐸𝑛 = 10𝑙𝑜𝑔𝐸𝑛
Table 3-4: Factors for equipment and voltage classes as given in Table 4 of IEEE 1584 (2002, p. 12)
System voltage (kV)
Equipment type Typical gap between conductors
(mm)
Distance x factor
0.208 to 1 Open air 10 to 40 2.000
Switchgear 32 1.473
MCC and Panels 25 1.641
Cable 13 2.000
> 1 to 5 Open air 102 2.000
Switchgear 13 to 102 0.973
Cable 13 2.000
> 5 to 15 Open air 13 to 153 2.000
Switchgear 153 0.973
Cable 13 2.000
Finally, to find the actual incident energy use the formula:
𝐸 = 4.184𝐶𝑓𝐸𝑛(
𝑡
0.2) (
610𝑥
𝐷𝑥 )
where;
𝐸 is the incident energy (J/cm2)
𝐶𝑓 is a calculation constant (1.0 for voltages above 1 kV, and 1.5 for voltages at or below 1 kV)
𝐸𝑛 is the normalised incident energy (J/cm2)
𝐷 is the distance from the possible arc point to the person (mm)
𝑥 is the distance exponent from Table 3-4
Note: As previously stated, to change the incident energy value above from J/cm2 to cal/cm2, divide the result by 4.184.
The calculations that are given in IEEE1584 are based on the use of protective devices that are not current limiting. Current limiting devices are designed to begin to interrupt the short-circuit current within the first quarter of a cycle, which will limit the peak value of the short-circuit current. This also impacts the value of the potential arc flash incident energy. Therefore, the IEEE1584 base their results on a more generous (conservative) figure, to ensure that the maximum possible incident energy is evaluated.
3.5.4 Determine the arc flash-protection boundary (≤ 15 kV)
The arc flash-protection boundary is defined in Article 100 (Definitions) of NFPA 70E (2012) as “an approach limit at a distance from a prospective arc source within which a person could receive a second degree burn if an electrical arc flash were to occur”. NFPA goes on further to give this as an incident energy value of 5 J/cm2 (1.2 cal/cm2).
There are a few methods for calculating the arc flash-protection boundary. These include:
4 Foot Rule (NFPA 70 E 2012) – This is based on a boundary
distance of 4 feet, where a calculation has not been performed. It is assumed the available bolted short-circuit fault current is greater than 50kA and that the protective device will clear within 2 cycles.
Lee Equations – These two equations were published by Ralph
Lee in 1982. One is determined using the transformer MVA, while the other uses the short-circuit MVA value. The difference between the two equations is due to the difference in value of the constant multiplier:
Transformer MVA method
𝐷𝐶 = (53 × 𝑀𝑉𝐴𝑡𝑟× 𝑡)0.5
Short-circuit MVA method
𝐷𝐶 = (2.65 × 𝑀𝑉𝐴𝑏𝑓 × 𝑡)0.5
IEEE1584 – This equation provides the most detailed calculation method of the arc flash-protection boundary as it is based on the prospective incident energy previously calculated. Unlike the two methods previously discussed, this method considers the arcing short-circuit current and not the bolted short-circuit, hence providing a more accurate result.
After considering the three methods discussed above, this dissertation will employ the IEEE1584 procedure as it is the most comprehensive. In a similar fashion to those equations for determining the incident energy, it uses the normalised incident energy value. In doing so, it therefore allows for all of the arc flash considerations.
From Clause 5.5 in the IEEE1584 (2002), the arc flash-protection boundary formula is given as:
𝐷𝐵 = [4.184𝐶𝑓𝐸𝑛( 𝑡
0.2) (
610𝑥
𝐸𝐵 )]
1 𝑥
where;
𝐷𝐵 is the distance of the boundary from the arcing point (mm)
𝐶𝑓 is a calculation constant (1.0 for voltages above 1 kV, and 1.5 for voltages at or below 1 kV)
𝐸𝑛 is the normalised incident energy (J/cm2)
𝐸𝐵 is the incident energy at the boundary distance (J/cm2)
𝑡 is the arcing time (seconds)
NOTE: As previously discussed, the incident energy at the arc flash-protection boundary should be 5.0 J/cm2 (1.2 cal/cm2), therefore 𝐸
𝐵
should be set at this value.
3.5.5 Determine the arc flash hazard/risk category and PPE selection
One of the final requirements of the arc flash study is to use the look-up tables in the NFPA 70E standard to determine the arc flash category level at the work location (that is, at the working distance from the potential arc flash), and subsequently decide on the Personal Protective Equipment (PPE) necessary. This requirement is generally the main reason why a study is completed in the first case.
The NFPA 70E standard uses two methods of deciding upon the arc flash level. One is based on the Analysis method, which is the calculation method performed using the formulae in the IEEE 1584, the other is based on the Study method, which uses the Hazard Risk Category Classification Table in the NFPA 70E. As this dissertation employs the Analysis method, this will be the one that is followed.
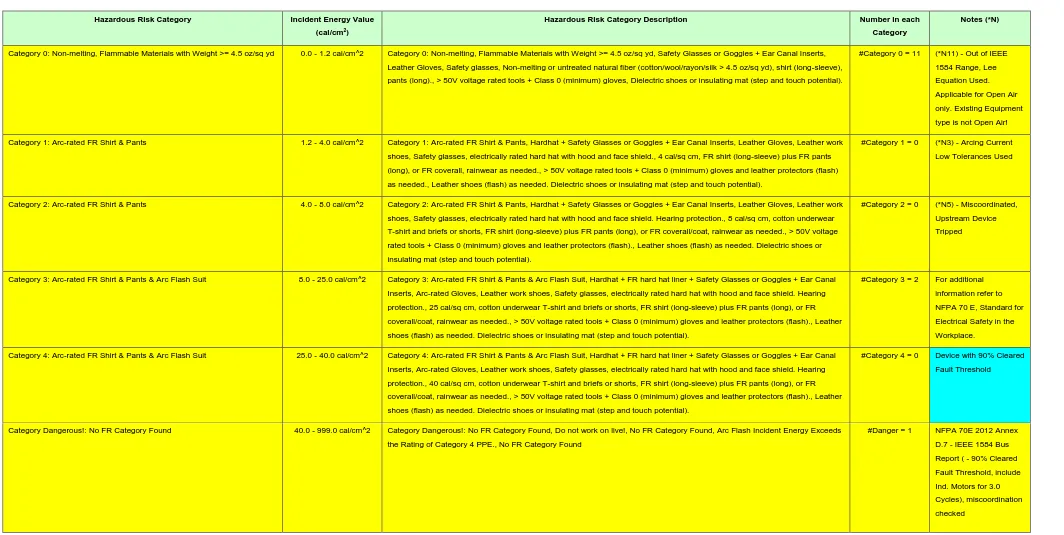
The following Arc Flash Hazard/Risk Category table shows the relationship between the incident energy value and the arc flash category:
Table 3-5: Arc Flash Hazard/Risk Category Table
Hazardous Risk Category Incident Energy Value (cal/cm2)
0 0.0 to 1.2
1 1.2 to 4.0
2 4.0 to 8.0
3 8.0 to 25.0
4 25.0 to 40.0
Not categorized - Dangerous 40.0 to 999.0
Once the hazard risk category has been decided, Table 130.7(C)(16) in NFPA 70E is used to determine the requirement for PPE. This table has been replicated below:
Table 3-6: Protective Clothing and Personal Protective Equipment (PPE), Table 130.7(C)(16), NFPA 70E (2002)
Hazardous Risk Category
Incident Energy Value (cal/cm2)
0 Protective Clothing, Nonmelting or Untreated Natural Fiber (i.e., untreated cotton, wool, rayon, or silk, or blends of these
materials) with a Fabric Weight of at Least 4.5 oz/yd2
Shirt (long sleeve)
Pants (long)
Protective Equipment
Safety glasses or safety goggles (SR)
Hearing protection (ear canal inserts)
Hazardous Risk Category
Incident Energy Value (cal/cm2)
1 Arc-Rated Clothing, Minimum Arc Rating of 4 cal/cm2
(See Note 3.)
Arc-rated long-sleeve shirt and pants or arc-rated coverall
Arc-rated face shield or arc flash suit hood
Arc-rated jacket, parka, rainwear, or hard hat liner (AN)
Protective Equipment
Hard Hat
Safety glasses or safety goggles (SR)
Hearing protection (ear canal inserts)
Heavy duty leather gloves (See Note 1.)
Leather work shoes (AN)
2 Arc-Rated Clothing, Minimum Arc Rating of 8 cal/cm2
(See Note 3.)
Arc-rated long-sleeve shirt and pants or arc-rated coverall
Arc-rated flash suit hood (See Note 2.) or rated face shield and
arc-rated balaclava