DESIGN AND DEVELOPMENT SENSOR BASED ELECTRONICS SYSTEM OF WATER QUALITY DETECTOR
SYAMSUL BAHRAIN BIN NAZRI
This Report Is Submitted in Partial Fulfilment of Requirements for The Bachelor Degree of Electronic Engineering (Computer Electronics)
Faculty of Electronics and Computer Engineering Universiti Teknikal Malaysia Melaka
ii
UNIVERSTI TEKNIKAL MALAYSIA MELAKA
FAKULTI KEJURUTERAAN ELEKTRONIK DAN KEJURUTERAAN KOMPUTER
BORANG PENGESAHAN STATUS LAPORAN
PROJEK SARJANA MUDA II
Tajuk Projek : D DESIGN AND DEVELOPMENT SENSOR BASED ELECTRONICS SYSTEM OF WATER QUALITY DETECTOR
Sesi Pengajian
: 1 6 / 1 7
Saya SYAMSUL BAHRAIN BIN NAZRI, mengaku membenarkan Laporan Projek Sarjana Muda ini disimpan di Perpustakaan dengan syarat-syarat kegunaan seperti berikut:
1. Laporan adalah hakmilik Universiti Teknikal Malaysia Melaka.
2. Perpustakaan dibenarkan membuat salinan untuk tujuan pengajian sahaja.
3. Perpustakaan dibenarkan membuat salinan laporan ini sebagai bahan pertukaran antara institusi pengajian tinggi.
4. Sila tandakan ( √ ) :
SULIT*
*(Mengandungi maklumat yang berdarjah keselamatan atau kepentingan Malaysia seperti yang termaktub di dalam AKTA RAHSIA RASMI 1972)
TERHAD**
**(Mengandungi maklumat terhad yang telah ditentukan oleh organisasi/badan di mana penyelidikan dijalankan)
TIDAK TERHAD
Disahkan oleh:
__ ________________________ ___________________________________
(SYAMSUL BAHRAIN BIN NAZRI) (DR SHARATUL IZAH BINTI SAMSUDIN)
Tarikh: ……….. Tarikh: ………..
iii
“I hereby declare that the work in this project is my own except for summaries and quotations which have been duly acknowledge.”
Signature : ...
Author : SYAMSUL BAHRAIN BIN NAZRI
iv
“I acknowledge that I have read this report and in my opinion this report is sufficient in term of scope and quality for the award of Bachelor of Electronic Engineering
Electronic Telecommunication with Honour’s.”
Signature : ...
Supervisor’s Name : DR. SHARATUL IZAH BINTI SAMSUDIN
v
ABSTRACT
vi
ABSTRAK
Air adalah satu keperluan dalam kehidupan seharian kita. Walau
vii
TABLE OF CONTENT
CHAPTER CONTENT
PAGE PROJECT TITLE .
PROJECT STATUS DECLARATION ii
STUDENT’S DECLARATION iii
SUPERVISOR’S DECLARATION iv
ABSTRACT v
ABSTRAK vi
TABLE OF CONTENT vii
LIST OF FIGURES ix
LIST OF TABLES x
1 INTRODUCTION. 1.1 Introduction 1 1.2 Problem statement 2 1.3 Objective of Project 2 1.4 Project Scopes 3 1.5 Research interest 3 1.6 Report Guidance 4 2 LITERATURE REVIEW. 2.1 Previous Water Quality System Studies and Projects 5 2.1.1 Water Quality Monitoring System Using Zigbee
Based Wireless Sensor Network 6
2.1.2 Design and Development of A Portable Low-Cost COTS-based Water Quality Monitoring System 6 2.1.3 A Low Cost Nephelometric Turbidity Sensor for
Continual Domestic Water Quality Monitoring
System 7
2.1.4 Smart Water Quality Monitoring System 7 2.1.5 Wireless Acquisition System For Water Quality
Monitoring 8
viii 2.1.7 Guidelines for Drinking-water Quality Fourth
Edition 9
2.1.8 Drinking Water Quality Surveillance Programme -
Ministry of Health 9
2.1.9 Guidelines for Drinking-water Quality - World Health Organization - Google Books 10
2.2 Arduino UNO Overview 10
2.3 ESP8266-01 Overview 12
2.4 pH Sensor Overview 12
2.5 Turbidity Sensor Overview 13
2.6 LCD2004 I2C Overview 14
2.7 Summary 15
3 METHODOLOGY.
3.1 Introduction 17
3.2 Flowchart 17
3.3 Block Diagram 19
4 RESULTS AND ANALYSIS.
4.1 Water Condition 21
4.2 Test on Water 22
4.3 Reading on Thingspeak 24
5 CONCLUSION AND FUTURE WORK
5.1 Discussion 26
5.2 Conclusion 27
5.3 Future Work 27
ix
LIST OF FIGURES
FIGURE TITLE PAGES
2.1 Overall block diagram of system operation 7
2.2 Flow chart of the system 8
2.3 Water specification 9
2.4 ATmega pin mapping 10
2.5 Arduino UNO R3 pinout 11
2.6 3 main part of Arduino UNO 11
2.7 ESP8266 graphical datasheet 12
2.8 Schematic diagram of pH sensor 13
2.9 Top of the sensor 14
2.10 Schematic diagram of the sensor 14
2.11 Example connection of the LCD 15
3.1 Flowchart of project 18
3.2 Block Diagram of the Project 19
3.3 Complete Project 20
3.1 Water Tested 20
4.1 When in good condition 21
4.2 When not in good condition 22
4.3 pH reading at Thingspeak 24
x
LIST OF TABLES
TABLE TITLE PAGES
4.1 Test on pipe water 22
4.2 Test on toothpaste water 23
1
CHAPTER I
INTRODUCTION
This chapter will discuss the introduction, scope and methodology of this project.
1.1 Introduction
Water is one of the important things in our daily life. Therefore, the quality of water is very important to take care. As we can see water around us, it was polluted and not in good condition. Like what happened in early 2017, at the Selangor has an issue that the water is polluted and some area the water supply has to be stopped for a while to clean it. As the industrial is growing up year by year, our water also exposed to a threat of pollution, especially from the industrial activities.
2 There are several conditions of water that needs to consider such as pH level, chlorine, turbidity, temperature and the other. In this project, it will check the pH level value and the turbidity. The normal range for the pH value is 6.7 until 7.3 meanwhile for the turbidity is 5.
1.2 Problem Statement
The presence of professional tools that can check many types of the condition is good but the price is too expensive. It may burden the people that just want to monitor the water. It also needs the manpower go to the site to test and check water quality.
This project provides an alternative way to monitor the water in the more efficient way. By using a nowadays method which is Internet of Thing (IoT), it will make the monitoring of the water will be more efficient and better. It also can monitor the water every time and does not need manpower go to the site.
It is important to develop the devices that monitoring the water in real-time. This is because it may help the emergency response to take an action if anything happens to the water. Prevent is better than cure. If the pollution is late to take an action, it will make harder to clean it back or to stop it before become worse.
The use of sensor technologies in a right and manner way can help lowering the risk of water pollution and can make the user feel safe and comfort hence improving their healthy quality.
1.3 Objective of Project
3 team can know the condition of the water. Last but not least is to investigate the performance of the developed system to send data to the Thingspeak.
1.4 Project Scope
The design of this water quality control detector in monitoring the quality of water is divided into two working scope which is software and performance of the system. The first scope includes the program that is used for controlling the input and output of the wireless fidelity (WiFi) module. Arduino integrated development environment (IDE) and ESPFlashdownloadtool software are used for this working scope.
The second scope is the performance of the system. The data that the sensor reading will be display in the LCD display and it also will be sent to the Thingspeak (cloud). By using the ESP8266 as Wi-Fi transmitter to send data to the Thingspeak.
1.5 Research Interest
The interest of this project is about obtaining knowledge in developing an electronic circuit. With the right information, each of the function of the components used in this project can be particulars studied and applied. Other than that, the installation process of the electronic component such as placing the sensor to the right pin and make it function.
4 to make sure the devices is fully working. An experiences of developing a full complete electronic device is a very useful experiences and cannot be learnt in a short time, student must face the hard moment before they can gain a whole new valuable experiences.
1.6 Report Guidance
This bachelor project report contains five chapter for explaining about the design and development Sensor based Electronic System of Water Quality Detector. This report starts with an introduction, literature studies, methodology, results and discussion, conclusion and suggestion.
Chapter I - Introduction to the project background. Basic explanations are discussed in this chapter. This introduction discussing the background of the project, problem statement and the objective of the project development. It is also discussing the importance of this project.
Chapter II - This chapter comprise the literature studies of the theoretical concept that applied on this project. It also contains the information obtained for completing the project.
Chapter III - The methodology explained is about how the progress of this project is accomplished. The main content discussed in this chapter is a flow chart, circuit operation, hardware, and software configuration.
Chapter IV - Concentrating on the results and discussion of the project. All discussion was done based on the results of the successfully implemented project.
5
CHAPTER II
LITERATURE REVIEW
This chapter contains the literature studies of the theoretical concept that applied on this project. It is also containing the information for completing the project.
2.1 Previous Water Quality System Studies and Projects.
6
2.1.1 Water Quality Monitoring System Using Zigbee Based Wireless Sensor Network [1]
This project has been developing by X. Hu, J. Wang, Q. Yu, W. Liu, and J. Qin. This project is used ZigBee in order to transfer the information. The monitoring system is using a number of nodes with an interacting competence for an ad-hoc for continuous monitoring purpose. Temperature, turbidity and pH level is the parameter for this project and monitoring it in real-time at base station in the room. In order to reduce the monitoring system cost in term of facilities and the labor cost. In this paper, wireless sensor network (WSN) is proposed by using the ZigBee and the IEEE 802.15.4 compatible transceiver.
2.1.2 Design and Development of A Portable Low-Cost COTS-based Water Quality Monitoring System [2]
7
2.1.3 A Low Cost Nephelometric Turbidity Sensor for Continual Domestic Water Quality Monitoring System [3]
This system is design by Ahmad Aftas Azman, Mohd Hezri Fazalul Rahiman, Mohd Nasir Taib, Norbaya Hj Sidek, Ilyani Akmar Abu Bakar, Mohd Fozi Ali. The main focus of this project is to check the turbidity level of water quality. This project is using the PIC microcontroller which is PIC 16F777. The PIC will turn on the LED light and measure the brightness of the LED using the LDR. Computer will be the output of the sensor using the USB cable from RS232. It will display the voltage and the turbidity value in NTU. It need to take 0.5 sec before it read the next reading.
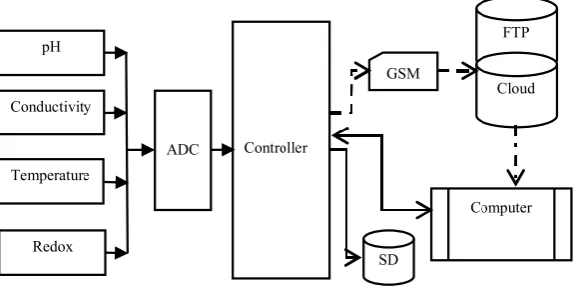
2.1.4 Smart Water Quality Monitoring System [4]
[image:17.595.177.464.587.732.2]A.N.Prasad, K. A. Mamun, F. R. Islam and H. Haqva are the designer of this project. This project is making the oxidation and reduction potential (ORP), conductivity, pH and temperature as their parameter. In order to test the acidity of the water, this project is using the lemon juice adding to tap water. This project is using the analog to digital converter (ADC) for the sensor, microcontroller as the processor and SD storage and GSM module to store and send data to the cloud. The data can be stored into the SD storage or can be transferred using the File Transfer Protocol (FTP) server or cloud server.
8
2.1.5 Wireless Acquisition System For Water Quality Monitoring [5]
This project has been designed by Vinod Raut and Sushama Shelke from Dept. of E & TC Engg., NBN Sinhgad School of Engineering, Pune, India. This project will check the pH value, turbidity, water level sensor and the temperature of the water and using the peripheral interface controller (PIC) embedded platform. The PIC this project using is PIC 18F4550 and using the ZigBee as the wireless
transmission.
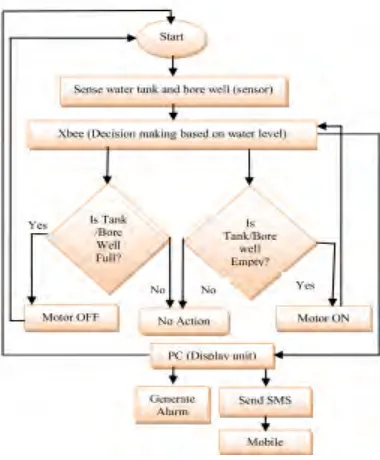
2.1.6 Real-Time Wireless Monitoring and Control of Water Systems using Zigbee 802.15.4 [6]
[image:18.595.217.407.509.739.2]Saima Maqbool and Nidhi Chandra from Department of Computer Science and Engineering, Amity University, Noida, Uttar Pradesh, India have invented the system. This project is using the XBEE Pro series1 as the communication module and 74HC14 Hex Inverting Schmitt Trigger in order to convert the input signal into the value needed.
9
2.1.7 Guidelines for Drinking-water Quality Fourth Edition [7]
In this book state three components of water safety plans (WSPs). First is a system assessment to determine whether the drinking-water supply chain as a whole can deliver water that meets the specification. Second is identifying control methods in a drinking-water system that will cooperatively control identified risks. It also must meet the target of the health based. The thirdly is management and
communication plans.
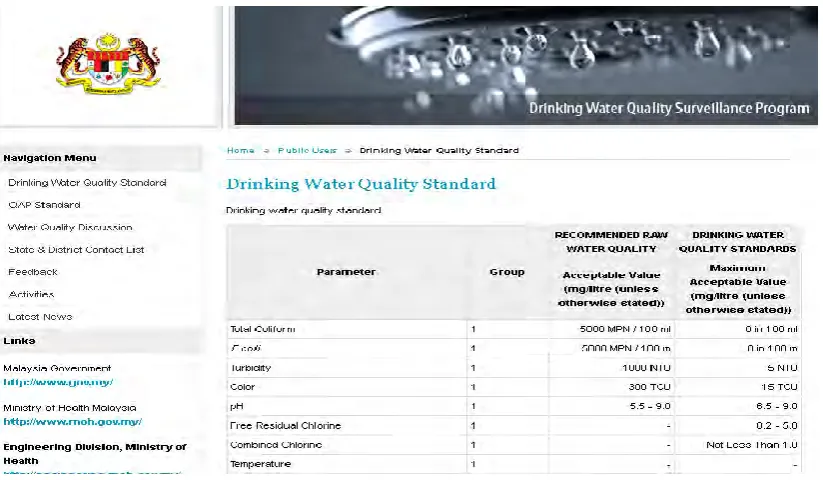
2.1.8 Drinking Water Quality Surveillance Programme - Ministry of Health [8]
[image:19.595.115.527.484.724.2]There are many parameters that have to ensure in order to make sure the quality of the water in good condition. But there are 3 main parameters the most important to check the water. It is pH, turbidity, and chlorine. The range for the drinking water standard pH is 6.5 - 9.0, turbidity is 5 NTU and for the chlorine is not less than 1.0 for combined chlorine.
10
2.1.9 Guidelines for Drinking-water Quality - World Health Organization - Google Books [9]
Turbidity, pH, chlorine residuals are the example of a measurable variable that is the parameter of the water quality. The effectiveness of operational monitoring must consider the timely indication of performance, ready to be measured and
provide an opportunity for an appropriate response. Limited use for operational monitoring such as indicator bacteria and pathogens is not considered because the time taken to process and analyze water sample does not meet the requirement.
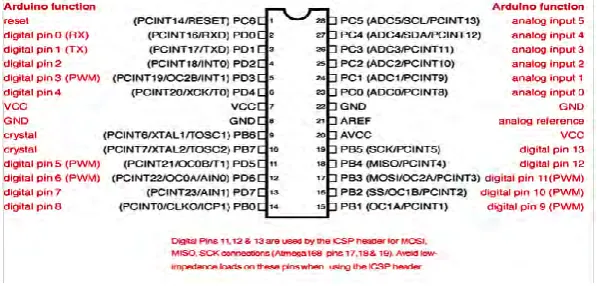
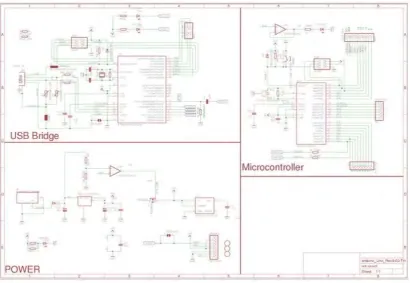
2.2 Arduino UNO Overview [10]
[image:20.595.169.468.600.743.2]This project is using the Arduino UNO which is contain microcontroller ATmega328. It consists of 14 digital input/output pins and 6 analog input. 6pins out of 14 digital pins can be used as PWM outputs. The Arduino UNO has three main part which is USB Bridge, Power and Microcontroller. Three memory type of ATmega328 are flash memory, SRAM memory and EEPROM memory. Flash memory is 32KB and nonvolatile memory. SRAM and EEPROM memory both are volatile memory but SRAM is 2KB and EEPROM is 1KB. In order to power up the Arduino UNO, can be using the USB or a DC jack which only 5v.
11
Figure 2.5: Arduino UNO R3 pinout
[image:21.595.115.526.356.639.2]12
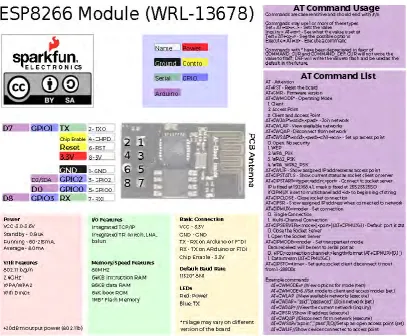
2.3 ESP8266-01 Overview [11]
[image:22.595.116.524.235.571.2]This project is using the ESP8266-01 as the WiFi Module. It contained SOC that integrated TCP/IP protocol stack. Therefore, it can give command to microcontroller access to the WiFi network. Esp8266 can be as a client, server and client and server. ESP8266 have been flash and has the AT command set firmware that enable it to communicate with Arduino. It need only 3.3V to power-up it.
Figure 2.7: ESP8266 graphical datasheet
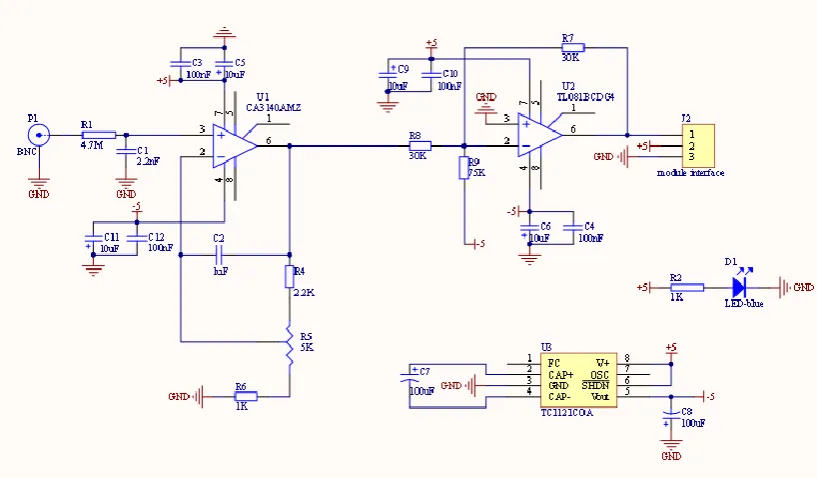
2.4 pH Sensor Overview [12]
13 connected to the Arduino UNO analog pin, 5V and ground. It consists of LED as power indicator, BNC connector and PH2.0 sensor interface. It can measure from 0 until 14 pH value. It only need 5V output power to function it.
Figure 2.8: Schematic diagram of pH sensor
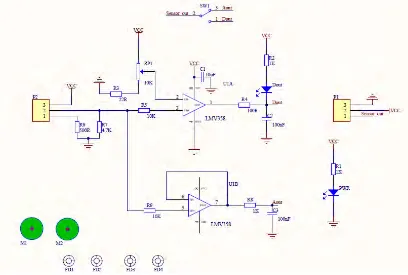
2.5 Turbidity Sensor Overview [13]
14
Figure 2.9: Top of the sensor
Figure 2.10: Schematic diagram of the sensor
2.6 LCD2004 I2C Overview [14]
[image:24.595.116.524.266.541.2]