This is a repository copy of
Computational Design Tools for Soft Inductive Tactile Sensors
.
White Rose Research Online URL for this paper:
http://eprints.whiterose.ac.uk/140725/
Version: Accepted Version
Proceedings Paper:
Jones, D, Kow, JW orcid.org/0000-0002-0496-2966, Alazmani, A
orcid.org/0000-0001-8983-173X et al. (1 more author) (2018) Computational Design Tools
for Soft Inductive Tactile Sensors. In: Proceedings of the IEEE RAS and EMBS
International Conference on Biomedical Robotics and Biomechatronics. IEEE International
Conference on Biomedical Robotics and Biomechatronics – Biorob2018, 26-29 Aug 2018,
Enschede, Netherlands. IEEE , pp. 871-876. ISBN 9781538681831
https://doi.org/10.1109/BIOROB.2018.8487666
©2018 IEEE. This is an author produced version of a paper published in 2018 7th IEEE
International Conference on Biomedical Robotics and Biomechatronics (Biorob). Personal
use of this material is permitted. Permission from IEEE must be obtained for all other uses,
in any current or future media, including reprinting/republishing this material for advertising
or promotional purposes, creating new collective works, for resale or redistribution to
servers or lists, or reuse of any copyrighted component of this work in other works.
Uploaded in accordance with the publisher's self-archiving policy.
eprints@whiterose.ac.uk https://eprints.whiterose.ac.uk/ Reuse
Items deposited in White Rose Research Online are protected by copyright, with all rights reserved unless indicated otherwise. They may be downloaded and/or printed for private study, or other acts as permitted by national copyright laws. The publisher or other rights holders may allow further reproduction and re-use of the full text version. This is indicated by the licence information on the White Rose Research Online record for the item.
Takedown
If you consider content in White Rose Research Online to be in breach of UK law, please notify us by
Computational Design Tools for Soft Inductive Tactile Sensors
Dominic Jones, Jun Wai Kow, Ali Alazmani and Peter R Culmer
Abstract— Soft tactile sensors are a key enabling technology for next generation robotic systems and it is imperative to develop appropriate design tools to inform their design, inte-gration and optimisation. The use of computational models can help speed this process and minimise the need for timely emper-ical design methods. Here we present the use of computational multi-physics modelling as a design tool for Soft Inductive Tac-tile Sensors (SITS) which use variation in electromagnetically-induced eddy-current effects as a transducer mechanism. We develop and experimentally validate 2D models which extend existing understanding to provide insight into the configuration of sensing elements for measurement of multi-axis forces and rejection of unwanted environmental disturbances. We analyse the limitations of this approach and discuss opportunities for future improvements to advance this burgeoning area.
I. INTRODUCTION
Tactile sensors are a much needed component for robotic systems, allowing them to interact effectively with their environment through the modulation of contact force. With the increasing complexity of robotic systems and the tasks they are required to perform, there is growing need for compact multi-axis tactile sensors which can measure both normal and shear forces [1]. In conjunction, developing soft modalities of tactile sensor has received increasing attention, in particular due to their relevance to soft robotic systems.
A wide variety of transducer techniques have been em-ployed to develop soft tactile sensor systems. Common modalities include resistance (e.g. with conductive liquids [2] or nanocomposites [3]), capacitance (e.g. in conductive fabrics [4]–[6]), magnetic-field using the Hall-Effect (e.g. bio-inspired magnetic whiskers [7] or low-cost multi-axis domes [8] [9]) or piezoresistive effects (e.g. using multi-axis piezo beam arrangements [10]).
For the above technologies, modelling tools were devel-oped to assist in the design and optimisation of soft tactile sensors. Many of these covered both the physical deforma-tion and transducer physics within the simuladeforma-tion [11]–[16]. In the resistive, capacitive, and piezoresistive models, the physics models are fully dependent on the varying geometry of the substrate acting as a conduction pathway. In multi-axis hall effect dome models, the physics is decoupled from the substrate, however the complex geometries require simulation of the deformation to fully optimise the sensor response [17].
A relatively new form of tactile sensor developed by our group is the Soft Inductive Tactile sensor (SITS) [18]. This
*This work was supported by funding from the UK Research Councils: EPSRC Grant EP/R041776/1
1D Jones, J W Kow, A Alazmani, and P R Culmer are with
the School of Mechanical Engineering, University of Leeds, UK P.R.Culmer@leeds.ac.uk
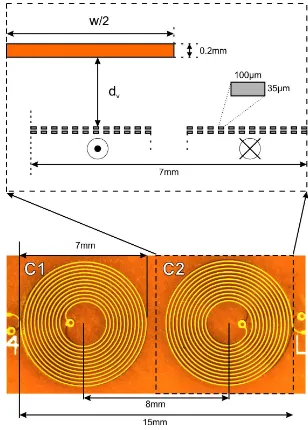
[image:2.612.337.538.365.494.2]uses the eddy current effect to detect the position of a conductive target in relation to an electrical coil through variation in the inductance of the coil. The change in induc-tance is dependent on several parameters, including varying target and coil geometries [19]. The sensor can be calibrated to relate the measured inductance with applied force [18]. This mode of sensor has a number of attractive qualities for robotics applications; it is physically robust, can achieve a high dynamic range and can be configured to obtain multi-axis measurements [19]. However, designing and optimising the sensor configuration is challenging due to the complexity of the associated electromagnetism calculations [20]. Tools for this specific application are limited to software provided by Texas Instruments for designing sensors which use their inductance to digital converter chips. However, this is limited to a single coil and precludes exploration of multi-coil configurations for multi-axis measurement (Figure 1).
Fig. 1. A two-axis SITS. Two inductance coils are positioned below a copper target and silicone elastomer to detect forces in thezandxaxes.
To address the current paucity of design tools for inductive tactile sensors, this paper aims to develop and validate computational models which facilitates easy exploration of the design-space related to SITS, with the ultimate intention of creating a tool for their design and optimisation. We use the case study of a two-axis SITS, introducing the working principle of this system before deriving computational mod-els and validating them against physical prototypes. We then use the model to identify and explore key design parameters.
II. WORKING PRINCIPLE
increased by both a reduced distance between the coil and target, or an increased area of coverage of the coil [21]. When placed upon a soft substrate, such as silicone, the changing inductance can be calibrated directly to the applied force on the target.
The operating principle underpinning single-axis SITS can be extended to achieve multi-axis measurements by coupling multiple coils with a single target [19]. In this instance, a two-axis sensor is developed in which the inductance of two
coils (Lc1&Lc2) is combined using additive and differential
forms to determine normal and lateral displacements of the target respectively. Using a deformable layer to modulate target displacement then enables force calibration as a
func-tion of the coil inductances for both normal (Fz, Equation 1)
and shear (Fx, Equation 2). The resolution of such a sensor
is dependent on the properties of the sensing coils, target, and elastomer. This paper presents only the exploration of variance in the target properties.
Fx=f(Lc1−Lc2) (1)
Fz=f(Lc1+Lc2) (2) Considering this as a 2D case with rigid target and coil elements, movement of the target can be defined using three
parameters: horizontal (shear) movement dh, vertical
(nor-mal) movementdv, and rotationα, as shown in (Figure 2).
The sensor aims to determinedvanddhwhileαis considered
[image:3.612.317.553.210.432.2]an unwanted disturbance resulting in measurement noise.
Fig. 2. Indication of the parameters of target movement in a two axis soft inductive tactile sensor (indicated in Figure 1). Parameters: dv = vertical
target displacement; dh = horizontal target displacement; α; w = target width;C1,2 = Coil 1 & Coil 2;Lc1,2 = Inductance C1 & C2
III. METHODS
A combination of computational modelling and experi-mental evaluation was used to develop and validate a com-putational SITS model and then investigate it’s efficacy as a practical design tool.
A. Experimental Configuration
An experimental prototype of the 2-axis SITS was devel-oped using two spiral coils fabricated on a thin Kapton film
with 100 µmtrack width and 100 µmspacing, as shown in
Figure 3. Each coil is 7 mm in diameter, with two layers
and 12 turns per layer. Copper targets of variable size and 0.2 mm thickness were located above the coils and their position relative to this datum was controlled using two linear micro-positioning stages Figure 3. The inductance of the coil pair was measured for a range of experimental conditions (defined below) using a digital inductance converter (Texas Instruments LDC1614) connected to an data acquisition de-vice (National Instruments MyRIO). The coils were excited sequentially by the chip (Figure 4b) to reduce the interference between adjacent coils. Each coil was driven by a 5 MHz excitation current using the LDC1614, selected based on empirical design guidance [19].
Copper Target
Inductance Coils
Manual Stage
Motorised micro-posi!oning stage
Mot
orised micr
o-posi
!
oning s
tag
e NI MyRIO
TI LDC1614 L1
L2
I2C
Host PC TCP/IP RS-232
C1
C2 C1
Activation MeasurementC1
Channel Switch
C2
Activation MeasurementC2 ActivationC1
Channel Switch
b)
a)
Fig. 3. a) The experimental test platform used to evaluate the 2-axis SITS and the inductive coil pair used in the system. b) Operation principle of the TI LDC1614. Each channel is operated sequentially, such that only one coil is activated at any one time.
B. Computational Modelling
Simplified simulations of the 2-axis SITS were developed using multi-physics FEA software (COMSOL Multiphysics [22]). The model focuses on the electromagnetic aspects of SITS operation and so neglects physical aspects (e.g. deformation of the elastomer layer which modulates target movement on application of an input force). Also, the simulation is based on
[image:3.612.56.304.395.543.2]Fig. 4. The magnetic field generated by coil 2 during sequential activation under the test conditions shown in Fig.2. The magnetic field is morphed dependent on the displacement and rotation of the target. Gradient lines indicate magnetic vector potential perpendicular to the plane (Wb/m)
is desirable to provide a pragmatic design tool (in which the designer may wish to evaluate multiple iterations of a design). 2D axisymmetric and lumped parameter models require symmetry about a central axis which limit their applicability to single coil-target systems. However, 2D pla-nar models enable simulation of multiple coil-target cross-sections and while this requires simplification of spiral coil geometries, the resultant computational time is reduced from hours to minutes.
Based on our preliminary investigation, the 2D planar model was developed for the multi axis SITS. This method effectively takes a cross-sectional representation of the sys-tem, approximating each coil as a paired array of straight parallel wires. For each coil, the left and right hand groups of wire carry electric current in opposite directions to emulate the behaviour of the spiral windings. The geometry of the model is based directly on the physical prototype (Figure 5).
The wire size of the coil was approximated to be 100 µm
wide and 35µm thick. The wires were positioned in four 12
×2 arrays, each representing a half of the 12 turn, 2 layer
spiral coil. The coils were excited with a 5kHz AC supply,
with an applied drive current of 1.017mA.
C. Parametric Study
A parametric study of key design variables was conducted using experimental testing and the computational model, firstly to validate the computational model and secondly to explore its efficacy as a practical design tool to investigate the effects of individual design parameters on inductance. The parameters, illustrated in Figure 2, were selected to relate to physical aspects of the sensor and its interaction with the external environment across a range of values selected through preliminary studies:
Fig. 5. Diagram of the geometry of the computational simulation. The diagram indicates a half of the simulated two coil cross-section. Each coil was represented by two 2× 12 arrays of wires separated by a 2.2mm gap representing the centre of the coil. Each wire section was modelled as a rectangle of dimensions 100µm× 35µm. One half of each coil had current directed into the plane, while the opposing side current out of the plane.
• Target vertical displacement dv=1 : 5mm
• Target horizontal displacement dh=0 : 5mm
• Target rotation α=0 : 20◦
• Target size (width) w=8 : 22mm
[image:4.612.357.511.338.553.2]Target Vertical Separation (mm)
0 1 2 3 4 5
Inductance Change (%)
-15 -10 -5
0 c) Horizontal Movement
C1 Experimental C1 Model C2 Experimental C2 Model
Target Horizontal Movement (mm)
0 1 2 3 4 5
Normal Inductance Output (%)
-15 -10 -5
0 e) Shear Inductance Output
Experimental Shear Model Shear
Target Rotation (deg)
0 5 10 15 20
Inductance Change (%)
-10 -8 -6 -4 -2
0 c) Target Rotation
C1 Experimental C1 Model C2 Experimental C2 Model
Target Rotation (deg)
0 5 10 15 20
Induced Error in Shear (%)
0 2 4 6
8 f) Rotation Induced Error in Shear Experimental Error
Model Error Target Vertical Separation (mm)
1 2 3 4 5
Inductance Change (%)
-8 -6 -4 -2
0 a) Vertical Movement
C1 Experimental C1 Model C2 Experimental C2 Model
Target Horizontal Movement (mm)
1 2 3 4 5
Normal Inductance Output (%)185 190 195
200 d) Normal Inductance Output
Experimental Shear Model Shear
Fig. 6. Percentage change of inductance (∆L/L0) for a) Vertical Movement, b) Horizontal Movement, and c) target rotation. Overall outputs for d) Vertical
Movement (Eq.2) and e) Horizontal Movement (Eq.1). f) The error in shear induced by the rotation.
configuration was selected for convenient comparison with
parameters set asdv=2mm,dh=0mm,α=0◦,w=8mm(the
distance between coil centres).
1) Vertical Displacement: A vertical movement of the target occurs in the sensor under pure normal loading. In the physical experiment, the target was moved at 0.1 mm intervals relative to the stationary coil pair using the micropositioning stage. At each interval (when the target was static) the coil inductances were measured at a sampling rate of 100Hz for 1s and these data points were averaged
to provide inductances Lc1 andLc2. Each test was repeated
three times. This configuration was emulated in the simu-lation with the target moved at 0.1 mm intervals and coil inductance was obtained from the simulation as an output parameter. A combined inductance parameter to represent vertical displacement is then determined as:
Lv=Lc1+Lc2 (3)
2) Horizontal Displacement: A horizontal movement of the target occurs in the sensor under pure shear loading. A process similar to that described for Vertical Displacement was used for both physical experiment and simulation. As-suming symmetry, the target’s horizontal position was varied between 0 and 5 mm from the baseline position in the
positiveX direction (see Figure 2). A combined inductance
parameter for horizontal displacement was defined as:
Lh=Lc1−Lc2 (4)
3) Target Rotation: Target rotation represents an unde-sired disturbance for this sensor which cannot be differ-entiated from horizontal displacement of the target. This occurs when loading results in rotation of the target relative to the coils so they are not parallel. This was investigated by positioning the target centrally above the coil pair and
rotating the target clockwise between 0o and 20o, at 2o
intervals, using a rotation micropositioning stage. The re-sultant inductance pairs were then processed to determine
the effective horizontal inductance (Lh) measures.
[image:5.612.62.560.67.360.2]IV. RESULTS
A. Simulation Validation
Due to limitations in the 2D planar model, the results obtained for the simulated inductance of the coils was of a different order of magnitude relative to the validated value. Therefore the models were validated on the percentage change from the inductance value of the coils when no target
was present. This value was 3.21µH & 3.19µH in validation
coils 1 & 2 respectively, and 0.43µH in the simulated coils.
Under normal loading , the inductance of the simulated coil dropped on both coils when target separation was reduced, with the validation coils dropping from 99.7 and 99.8% to 90.1 & 92.0%. The simulation coils both dropped from 98.9% to 93.8%. The curves of the reduction both showed similar profiles (Figure 6a).
Under shear loading, the inductance of C1 was decreased as the target moved horizontally away, while the inductance in C2 increased as the target moved toward it (6b).
When the target was rotated, the change in inductance was different for each coil, as the left edge of the target was raised and the right hand lowered. Validation C1 varied from 97.8% to 99.5% after the rotation, while the inductance of C2 lowered from 97.2% to 92.8%. A similar observation was made in the simulated coils, with C1 raising from 97.7% to 99.3%, and C2 lowering from 97.7 to 96.2% (6c). As the coils responded in the same manner as that of a shear movement, the rotation was treated as an error in the shear value. At vertical displacement of 2 mm and 0 mm horizontal
displacement, the 20o rotation would read as a shear of
around 0.5 mm.
B. Target Size Optimisation
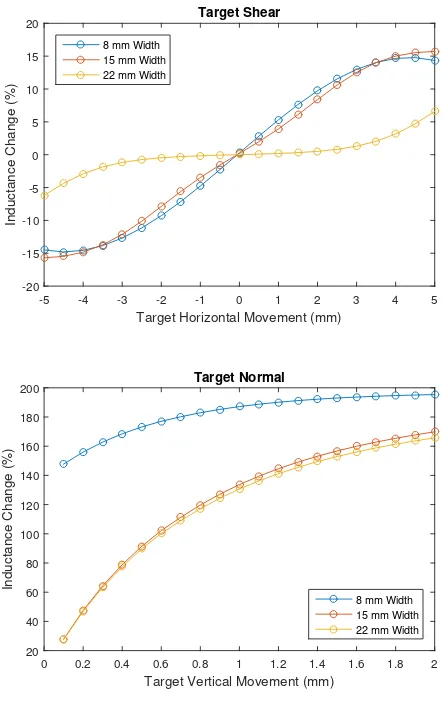
The investigation of target width’s effect on resolution showed differences in resolution in both shear and normal displacement (Figure 7). The maximum shear and normal ranges were: For 8 mm width, 29.6% and 24.2%; 15 mm width, 31.4% and 71.0%; and 22 mm width, 12.8% and 69.1%. This showed that the optimum width of the sensor was 15 mm, or the distance between the outer edges of the two coils.
V. DISCUSSION
This paper presents a simulated and validated analysis of different target parameters of an inductive tactile sensor. The simulations were built based on an existing sensor, presented in [19]. The ultimate aim was to use these validated simulations as an optimisation tool for the design of soft inductive tactile sensors.
The validations of the simulation showed consistent trends in inductance change throughout all motions. While the abso-lute values varied in magnitude between the experimental and modeled results, this was a known limitation of the model. A more useful output was to consider the percentage change in inductance for different configurations and scenarios, a common approach in sensor design and analysis. Instead, the percentage change in inductance was calculated to normalise
Target Horizontal Movement (mm)
-5 -4 -3 -2 -1 0 1 2 3 4 5
Inductance Change (%)
-20 -15 -10 -5 0 5 10 15
20 Target Shear
8 mm Width 15 mm Width 22 mm Width
Target Vertical Movement (mm)
0 0.2 0.4 0.6 0.8 1 1.2 1.4 1.6 1.8 2
Inductance Change (%)
20 40 60 80 100 120 140 160 180
200 Target Normal
[image:6.612.324.546.71.422.2]8 mm Width 15 mm Width 22 mm Width
Fig. 7. Inductance change ((Lc1−Lc2)/L0, and (Lc1+Lc2)/L0) with
varying horizontal and vertical target placements
the changes in inductance. This value was then used to validate the model response to the four applied parameters. The 2D planar simulation performed well overall in the study, replicating the inductance trends over all of the tested parameters. The model can simulate variation in both ge-ometric parameters and design aspects of the sensor. The changes in target position and rotation have been validated, and define the movement of the target under applied force. Currently, the width of target is the only design parameter to be evaluated with the simulation. While this evaluation showed promise, there are further parameters which can be evaluated. The target thickness and varying numbers of coil layers are of particular interest, as well as the influence of ex-ternal conductors causing noise in the system. The simulated environment will also allow complex substrate geometries, such as a curved coil substrates, to be investigated
in the shear analysis. The differences this caused in the overall field also led to errors in the initial width analysis, causing a higher relative inductance change as the width increased. While the simulation cannot accurately predict the inductance change across all parameters, the conforming trends confirm its viability as a design tool.
Currently the design tool is limited to a 2D plane. While this reduces the computation cost and allows simple geo-metric analysis to be performed on the target, the simulation is unable to compute more complex targets. For this a 3D simulation will be required. The 3D simulation would offer further detail in the simulation, allowing larger arrays of coils and varying coil shapes to be analysed by the simulation. It would also offer a closer response to the true inductance of the system, and could therefore be validated against an absolute measure of inductance rather than inductance change. Another future advancement to the simulation would be to include the solid mechanics of the elastomer substrate into the simulation. This would allow the full optimisation of force to be performed, rather than the current optimisation based on width.
VI. CONCLUSION
In conclusion, we developed a simulation based design tool to assist in the optimisation of soft inductive tactile sensors. The simulation was validated experimentally for a sensor operating to measure displacement along two axes. The simulation was then used to determine the width of target which would give the best resolution in both vertical and horizontal movement of the target. The optimum target width was found to be equal to the distance between the outer edges of the coil pair, matching experimental observations. Future work will build this model to a full 3D representation which can be used to explore 3D geometries allowing the variation of more complex target geometries on the sensor.
REFERENCES
[1] C. Bartolozzi, L. Natale, F. Nori, and G. Metta, “Robots with a sense of touch,”Nature materials, vol. 15, no. 9, p. 921, 2016.
[2] X. Shi, C.-H. Cheng, Y. Zheng, and P. Wai, “An egain-based flexible piezoresistive shear and normal force sensor with hysteresis analysis in normal force direction,”Journal of Micromechanics and Microengi-neering, vol. 26, no. 10, p. 105020, 2016.
[3] Z. Zhan, R. Lin, V.-T. Tran, J. An, Y. Wei, H. Du, T. Tran, and W. Lu, “Paper/carbon nanotube-based wearable pressure sensor for physiological signal acquisition and soft robotic skin,”ACS applied materials & interfaces, vol. 9, no. 43, pp. 37 921–37 928, 2017. [4] L. Viry, A. Levi, M. Totaro, A. Mondini, V. Mattoli, B. Mazzolai,
and L. Beccai, “Flexible three-axial force sensor for soft and highly sensitive artificial touch,” Advanced Materials, vol. 26, no. 17, pp. 2659–2664, 2014.
[5] R. A. Brookhuis, R. J. Wiegerink, T. S. Lammerink, and G. J. Krijnen, “Three-axial force sensor with capacitive read-out using a differential relaxation oscillator,” inSENSORS, 2013 IEEE. IEEE, 2013, pp. 1–4. [6] A. Hoffmann, A. Poeppel, A. Schierl, and W. Reif, “Environment-aware proximity detection with capacitive sensors for human-robot-interaction,” inIntelligent Robots and Systems (IROS), 2016 IEEE/RSJ International Conference on. IEEE, 2016, pp. 145–150.
[7] J. C. Sullivan, B. Mitchinson, M. J. Pearson, M. Evans, N. F. Lepora, C. W. Fox, C. Melhuish, and T. J. Prescott, “Tactile discrimination using active whisker sensors,”IEEE Sensors Journal, vol. 12, no. 2, pp. 350–362, 2012.
[8] H. Wang, G. de Boer, J. Kow, A. Alazmani, M. Ghajari, R. Hewson, and P. Culmer, “Design methodology for magnetic field-based soft tri-axis tactile sensors,”Sensors, vol. 16, no. 9, p. 1356, 2016. [9] L. Jamone, L. Natale, G. Metta, and G. Sandini, “Highly sensitive soft
tactile sensors for an anthropomorphic robotic hand,”IEEE sensors Journal, vol. 15, no. 8, pp. 4226–4233, 2015.
[10] T. Okatani, H. Takahashi, K. Noda, T. Takahata, K. Matsumoto, and I. Shimoyama, “A tactile sensor using piezoresistive beams for detection of the coefficient of static friction,”Sensors, vol. 16, no. 5, p. 718, 2016.
[11] A. E. Kubba and A. I. Kubba, “A micro-capacitive pressure sensor design and modelling,”Journal of Sensors and Sensor Systems, vol. 5, no. 1, p. 95, 2016.
[12] W. Yang, “Design of electrical capacitance tomography sensors,” Measurement Science and Technology, vol. 21, no. 4, p. 042001, 2010. [13] M. I. Tiwana, A. Shashank, S. J. Redmond, and N. H. Lovell, “Characterization of a capacitive tactile shear sensor for application in robotic and upper limb prostheses,”Sensors and Actuators A: physical, vol. 165, no. 2, pp. 164–172, 2011.
[14] F. L. Hammond, R. K. Kramer, Q. Wan, R. D. Howe, and R. J. Wood, “Soft tactile sensor arrays for force feedback in micromanipulation,” IEEE Sensors Journal, vol. 14, no. 5, pp. 1443–1452, 2014. [15] D. Alvares, L. Wieczorek, B. Raguse, F. Ladouceur, and N. H. Lovell,
“Development of nanoparticle film-based multi-axial tactile sensors for biomedical applications,”Sensors and Actuators A: Physical, vol. 196, pp. 38–47, 2013.
[16] M. Jagiella, S. Fericean, R. Droxler, and A. Dorneich, “New magneto-inductive sensing principle and its implementation in sensors for industrial applications,” inSensors, 2004. Proceedings of IEEE. IEEE, 2004, pp. 1020–1023.
[17] G. d. Boer, N. Raske, H. Wang, J. Kow, A. Alazmani, M. Ghajari, P. Culmer, and R. Hewson, “Design optimisation of a magnetic field based soft tactile sensor,”Sensors, vol. 17, no. 11, p. 2539, 2017. [18] H. Wang, J. W. Kow, N. Raske, G. de Boer, M. Ghajari, R. Hewson,
A. Alazmani, and P. Culmer, “Robust and high-performance soft inductive tactile sensors based on the eddy-current effect,” Sensors and Actuators A: Physical, 2017.
[19] H. Wang, J. W. Kow, G. Boer, D. Jones, A. Alazmani, and P. Culmer, “A low-cost, high-performance, soft tri-axis tactile sensor based on eddy-current effect,” inIEEE Sensors, 2017.
[20] J. O. Fava and M. C. Ruch, “Calculation and simulation of impedance diagrams of planar rectangular spiral coils for eddy current testing,” NDT & e International, vol. 39, no. 5, pp. 414–424, 2006. [21] H. Wang and Z. Feng, “Ultrastable and highly sensitive eddy current
displacement sensor using self-temperature compensation,” Sensors and Actuators A: Physical, vol. 203, pp. 362–368, 2013.