This is a repository copy of
Deadline, Energy and Buffer-Aware Task Mapping
Optimization in NoC-Based SoCs Using Genetic Algorithms
.
White Rose Research Online URL for this paper:
http://eprints.whiterose.ac.uk/127432/
Version: Accepted Version
Proceedings Paper:
Bruch, Jaison Valmor, Alves da Silva, Eduardo, Zeferino, Cesar Albenes et al. (1 more
author) (2017) Deadline, Energy and Buffer-Aware Task Mapping Optimization in
NoC-Based SoCs Using Genetic Algorithms. In: VII Brazilian Symposium on Computing
Systems Engineering (SBESC). Brazilian Symposium on Computing Systems Engineering
(SBESC) . IEEE , pp. 86-93.
https://doi.org/10.1109/SBESC.2017.18
[email protected] https://eprints.whiterose.ac.uk/
Reuse
Items deposited in White Rose Research Online are protected by copyright, with all rights reserved unless indicated otherwise. They may be downloaded and/or printed for private study, or other acts as permitted by national copyright laws. The publisher or other rights holders may allow further reproduction and re-use of the full text version. This is indicated by the licence information on the White Rose Research Online record for the item.
Takedown
If you consider content in White Rose Research Online to be in breach of UK law, please notify us by
Deadline, Energy and Buffer-Aware
Task Mapping Optimization in NoC-based SoCs
using Genetic Algorithms
J. V. Bruch, E. A. da Silva and C. A. Zeferino
Laboratory of Embedded and Distributed Systems University of Vale do Itajaí
Itajaí, SC, Brazil 88302-202
[email protected], {eas, zeferino}@univali.br
L. S. Indrusiak
Department of Computer Science University of York
Heslington, York, United Kingdon YO10 5GH [email protected]
Abstract— In Systems-on-Chip (SoCs) based on Networks-on-Chip (NoCs), the timing requirements of target applications can be met by using virtual channels and traffic differentiation mechanisms to prioritize the most urgent communication streams. However, the use of virtual channels in NoCs results in silicon and power overheads as they are usually implemented by means of additional buffers and multiplexers. In this context, this paper presents an optimization flow to perform the mapping of applications on NoC-based SoCs, aiming to meet the time requirements and minimize the costs arising from the use of virtual channels. The optimization flow applies a multi-objective heuristic that minimizes the communication deadline miss ratio, the number of virtual channels per router and the static power consumption. The heuristic is based on the NSGA-II genetic algorithm and performs task mapping, priority assignment, and virtual channel configuration. The proposed mapping optimization is evaluated by measuring the inter-task communication latency using a cycle-accurate NoC simulator. The optimization flow is able to identify a series of mappings that represent trade-offs over the metrics of interest, reducing the deadline miss ratio and the costs associated with virtual channels.
Keywords— Real-Time System; Systems-on-Chip; Networks-on-Chip; Task Mapping; Genetic Algorithms.
I. INTRODUCTION
Networks-on-Chip (NoCs) are the communication backbone in systems consisting of hundreds to thousands of cores on a single silicon wafer [1]. In NoC-based SoCs, applications process data and exchange information over the communication backbone. Some of those applications can have strict requirements regarding the time for completing their tasks. In such cases, the communication must be completed before a given deadline. However, typical NoC implementations are very susceptible to contention due to competition for shared resources. This may cause a delay in the delivery of packets, and, possibly, deadline misses. To avoid the violation of time constraints, virtual channels may be employed in conjunction with preemptive arbitration mechanisms. In such approach, each communication flow has a priority level that determines the virtual channel to be
used during the transfer of its packets through the network. In this way, if two or more packets dispute some resource, the higher priority packet is serviced before the others, and the most critical communications tend to face fewer contentions [2].
The implementation of virtual channels is based on memory elements called buffers. Its adoption improves the network throughput and allows the providing of QoS (Quality-of-Service). However, it impacts greatly on the area occupied by the NoC circuitry and may account for more than half of the static power dissipated by the routers [3].
Since the traffic characteristics in a NoC vary depending on the application type, the virtual channels can be allocated to match the communication requirements. In this context, this paper explores the number and depth of virtual channels, as well as packet priority assignment in an optimization process based on task mapping.
Mapping an application onto a NoC is known to be an NP-hard problem [4]. If the target system has n single-task processing elements and the application has n tasks, n! different solutions exist in the design space.
To solve the task-mapping problem, one can employ a multi-objective optimization environment that seeks a set of trade-offs among the target metrics and leaves to the designer to choose the most suitable alternative [5]. Heuristics based on genetic algorithms (GAs) have been shown to be effective in similar formulations of this problem. These algorithms deal simultaneously with a set of solutions and allow us to find several members of the Pareto optimal set in a single run [6].
communication architecture, defines the priority level of each communication flow, the number of virtual channels and the storage capacity of their buffers. The experimental results demonstrate the effectiveness of the proposed approach.
This paper is organized into five sections. Section I presented the context and the motivation for this work. Section II discusses related work and identifies the contribution of this work in comparison to the state of the art. Section III describes the optimization flow and the NoC platform used to evaluate the proposed approach. Section IV discusses the experiments and the obtained results. Concluding, Section V presents the final remarks.
II. RELATED WORK
Task mapping optimization in NoC-based SoCs has been of great interest to the scientific community, mainly due to its critical contribution to cost and performance metrics. The diversity of adopted approaches can be verified in recent surveys presented in [7] and [8].
One of the first works to employ multi-objective optimization in NoC-based systems was described in [5]. The authors applied genetic algorithms to explore the mapping space with evaluation by simulation. The objective functions aimed at optimizing performance (latency) and dynamic power dissipation. However, the minimization of storage elements was not addressed.
The mapping of hard real-time applications on NoCs was discussed in [9]. The authors applied genetic algorithms in the optimization of the execution time and energy consumption. The assessment was done through static schedulability analysis, taking into account the worst-case communication time. In [10], the same authors explored the task mapping in conjunction with the assignment of priorities. These works generate schedulable systems. However, the costs to implement the NoC is quite high, once they assume that there is a dedicated virtual channel for each priority level.
The minimization of the number of virtual channels was addressed in [11] with the adoption of a heuristic based on Ant Colony Optimization (ACO). The objective functions attempt to minimize the communication volume in the network links and the number of virtual channels. This approach was expanded in [12] with the addition of a second step in the optimization process, which adopts a probabilistic model to define the number of virtual channels required for the application. In both approaches, the evaluation process was conducted by simulation. In these works, the priority of each task must be set in advance by the system designer that also is responsible for deciding on the use of virtual channels considering the QoS requirements.
In [13], the proposed algorithm uses information about the traffic characteristics to determine the optimal buffers depth on each router port in order to avoid performance
bottlenecks and resources waste. Analytical models were developed to minimize the average latency by employing a restricted amount of storage that can be distributed in a non-uniform way among the routers inputs. However, this approach includes only networks that use store-and-forward and virtual cut-through switching.
This study differs from the others because it seeks solutions that minimize, at the same time, the deadline miss ratio, the virtual channels costs (quantity and buffers depth) and the static energy consumed by the network. The aforementioned works do share similarities with the one presented in this paper and address some of the same objective functions, but not all the three simultaneously. As [5], [11] and [12], this work uses simulation to gather evidence on how often deadlines are missed, which is expressed by the deadline miss ratio. In [9] and [10], the authors applied schedulability analysis to prove that deadlines will never be missed.
III. OPTIMIZATION FLOW
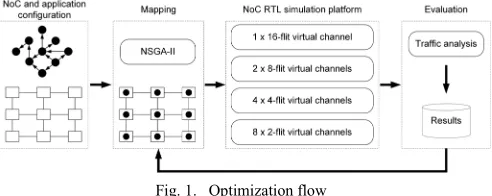
[image:3.612.316.562.355.453.2]The optimization flow proposed in this work to perform the design space exploration is depicted in Fig. 1. It consists of four steps: Configuration, Optimization, Simulation, and Evaluation.
Fig. 1. Optimization flow
The process begins by defining the graphs and parameters of the application and NoC, which are the input data for the optimization algorithm. Following, the optimization process starts by running a heuristic that generates an initial population. It is important to notice that each member in a population is a mapping solution. In the next iterations, the mappings with the best performance will evolve to the next generations until the maximum number of generations to be evaluated is reached. This limit defines the stop condition of the optimization algorithm.
Each mapping is simulated in a NoC-based system simulator composed of a network and traffic generators. The traffic generators emulate the processing elements (PEs) by injecting packets into the network. Traffic monitors are used to gathering performance data about the packets transferred through the NoC. The simulator is described in SystemC and is cycle-accurate.
optimization criteria. The details of each step are described in the following sub-sections.
A. Configuration
The configuration step consists in defining the parameters of the NoC and the characteristics of the application.
The network model comprises a set of n homogeneous single-task processing elements = { 0, 1, …, n-1}
interconnected by a 2-D mesh network .
The application is composed of a set of tasks
= {0, 1, …, m-1}, where m ≤ n. Each task i is defined
by the tuple {Pi, Fi}, where Pi describes the priority level of
the task, and Fi = {d, Li, Di, Ti, Zi} characterizes a
communication flow. The elements that define the tuple Fi
are the destination task (d), the priority level of the
communication flow (Li), the communication deadline (Di),
the interval between successive packets (Ti), and the
message size (Zi). Li is derived from priority level of the
source node of the communication flow. This model is based on the one described in [14].
B. Mapping
A multi-objective optimization problem seeks to optimize two or more conflicting goals, and the use of meta-heuristics has gained wide acceptance by researchers from a variety of disciplines. In this type of problem, there is no a single solution. Actually, there is a set of solutions that represent a good trade-off among the optimized metrics [6]. In this paper, we adopted the multi-objective genetic algorithm NSGA-II [15] as the basis to develop the heuristic.
A genetic algorithm is a search and optimization procedure based on the principles of genetics and natural selection. Some fundamental ideas of these areas are artificially applied in order to build robust algorithms that require a little knowledge about the problem being treated.
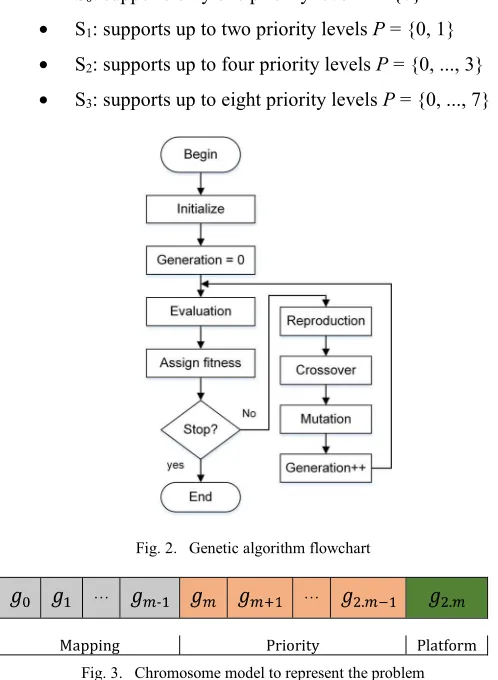
Fig. 2 illustrates the basic operation flow of a genetic algorithm. The first step in building this kind of heuristic is the codification of the decision variables as a chromosome. After that, many individuals are created to form a population of solutions, which is then evaluated by calculating the objective functions. Following, the population is classified to identify the most promising solutions (fitness). If the stop criterion is not met, the genetic operators (reproduction, crossover and mutation) are applied in an attempt of to evolve into a population of better solutions. The reproduction operator seeks to replicate good solutions, while the crossover operator combines two chromosomes to create two new solutions. The mutation operator makes a change in a random position of the chromosome in order to maintain the diversity of the population [16].
1) Problem representation
The problem representation is based on the approach used in [10], which applies a chromosome described by a set of genes G = {g0, g1,…, gk} to represent the task mapping
and the priority assignment. As Fig. 3 depicts, the fragment {g0, g1,…, gm-1} , where m = (k – 1)/2 , represents the
mapping of tasks on the PEs, while the fragment {gm,
gm+1,…, g2m-1} indicates the priority level of each task. In
this work, we applied real-valued representation to describe the chromosomes and the use of a single-gene fragment (g2m) to identify the platform type (which is discussed later).
The size of the fragment {g0, g1,…, gm-1} is equivalent to
the number of application tasks. Each gene gj G | 0 ≤ j < m
indicates in which processing element i must be
mapped the task i | 0 ≤ i < n (where n is the number of
PEs in the platform). The genes gj G | m ≤ j < 2m define
the priority level Pi assigned to the task i . This level
depends on the value of the gene {g2m}.
There are four platforms (Sk) with different priority
levels:
[image:4.612.310.559.319.659.2]• S0: supports only one priority level P = {0} • S1: supports up to two priority levels P = {0, 1} • S2: supports up to four priority levels P = {0, ..., 3} • S3: supports up to eight priority levels P = {0, ..., 7}
Fig. 2. Genetic algorithm flowchart
… …
Mapping Priority Platform
Fig. 3. Chromosome model to represent the problem
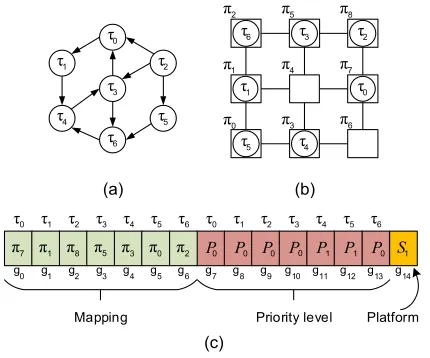
Fig. 4 illustrates the mapping of seven tasks {0, 1,…, 6}
in a platform composed of nine PEs { 0, 1,…, 8}
while Fig. 4.b shows a possible mapping of tasks on the system cores. Finally, Fig. 4.c depicts the chromosome representing this mapping.
2 5 8
S P0 P0 P0 P0
0 1 2 3 6 0 1 2 3 6
P1 P1
4 5 4 5
1
Mapping Priority level Platform
g
0 g1 g2 g3 g4 g5 g6 g7 g8 g9
P0
2 0 3 5 8 1 7
(c)
(b) (a)
6 5 4
3 2 1
0 6 3 2
1 1
4 7
0
0 5
3 4
6
g
[image:5.612.67.282.120.299.2]10 g11 g12 g13 g14
Fig. 4. Example of a task mapping: (a) task graph; (b) a possible mapping; (c) mapping representation
2) Initialization
Typically, the initial population of a genetic algorithm is randomly created. However, we employed a modified initialization process to guarantee a minimum quantity of individuals in each considered platform.
It is important to note that during the optimization process the heuristic can generate invalid mappings by performing crossover and mutation to produce new individuals. These mappings are disregarded.
C. Simulation Platform
1) NoC Architecture
The NoC employed in this work is SoCIN [17]. This network uses a 2-D mesh topology, credit-based flow control, XY routing, round-robin arbitration and wormhole switching. Each router has up to five communication ports named Local, North, East, South and West. The Local port is used to attach a PE to the network, and the other ports are used to interconnect the router to its neighbors.
Internally, the router of SoCIN uses a distributed organization. Each communication port is composed of an input channel and an output channel. All the input and output channels are interconnected by a crossbar. In this work, four different alternatives of SoCIN were designed, one for each platform type. The difference among them lies on the number and the depth of the buffers of the input channels. In all the platform types, each input channel has the capacity to store 16 flits and the depth of the buffers decreases with the increase in the number of virtual channels. Table I presents the available alternatives ranging from a single 16-flit buffer to eight 2-flit buffers.
Each packet has a header that carries the information required for routing, including the network address of the destination router and the virtual channel identifier. This last information is stored in a 3-bit field named CLS and used by the network interface of the source node to select the virtual channel to be used to transfer the packet.
[image:5.612.315.556.238.385.2]The original router of SoCIN did not have virtual channels. In [18], it was modified to support two virtual channels and provide traffic differentiation. Following the approach used in that work, additional circuitries were implemented in order to support the number of virtual channels necessary for each platform type (Table I).
TABLE I. BUFFERS CONFIGURATION IN THE NOCPLATFORMS
Platform type (Sk) Virtual channels
per input channel Buffers depth (flits)
S0 1 16
S1 2 8
S2 4 4
S3 8 2
Flow Control
Data
VCid 3
34
Fig. 5. NoC link with virtual channel identification
Each communication port of the SoCIN router is composed of two modules: input (IN) and output (OUT), one for each physical channel. The input module (Fig. 6.a) is composed of N virtual channels (where N depends on the selected platform and the target application) and a demultiplexing circuit. Each virtual channel has a FIFO buffer and a routing circuit (R). The output module (Fig. 6.b) is composed of N virtual channels, each one with a switch and an arbiter (A), but none buffer. Furthermore, it includes a multiplexing circuit that uses a fixed priority encoder (P) to suspend a communication flow whenever there exists another higher priority stream. The block diagram of Fig. 6 is a simplified representation of the modules and does not show their control signals.
R
FIFO
VCN-1
R
FIFO
VC0
P
VC0
VCN-1
A
A
[image:5.612.320.557.577.687.2](a) (b)
2) System Simulation Environment
The evaluation platform was based on the simulator and the traffic analysis tools of BrownPepper [18], an integrated environment that allows evaluating different configurations of SoCIN. The simulator is a cycle-accurate SystemC model of a system composed of a parameterizable NoC, traffic generators and traffic monitors. The traffic generators represent the processing elements and emulate the communication among the tasks. The traffic monitors are connected to the Local ports of the routers and gather data from the outgoing traffic for analysis. The analysis tool processes these data and calculates the performance metrics. The SystemC models and the analysis tool were modified to allow the evaluation of the four platform types used in this work.
D. Evaluation
The evaluation consists in the calculation of objective functions for each mapping of the evolutionary process. The value assigned to each objective function is measured by simulation. Algorithm 1 shows the pseudocode of the evaluation procedure.
Algorithm 1
Input: NoC model, Application model;
Output: Mapping the application on the NoC;
Variable: valid_1, valid_2;
1: begin
2: valid_1, valid_2 false; 3: for each chromosome do
4: valid_1 is one task per node;
5: valid_2 is correct priority assign based on the platform choice; 6: if (valid_1 and valid_2) then
7: constraint[1] 0; 8: switch platform
9: case 0 : mapping tasks on platform 0; 10: case 1 : mapping tasks on platform 1; 11: case 2 : mapping tasks on platform 2; 12: default : mapping tasks on platform 3; 13: end switch
14: objective[1] deadline miss evaluation; 15: objective[2] static energy evaluation; 16: objective[3] buffer depth evaluation; 17: else
18: constraint[1] -1; 19: end if
20: end for
21: end
For each mapping, it is necessary to validate the compliance with constraints imposed by the simulation platform. Firstly, is needed to check if the generated mapping is valid because the initialization process and the application of the genetic operators can produce invalid individuals. Next, the number of priority levels assigned by the heuristic must respect the constraints of the selected platform (e.g. mappings onto the S0 platform must use only one level of priority).
Valid mappings are then simulated and a specialized tool is used to calculate the metrics of interest, which are the return values of the objective functions of the genetic algorithm.
1) Objective functions
The optimization flow considers three objective functions that seek to minimize the deadline miss ratio, the static energy consumed by the network, and the number of virtual channels.
The deadline miss ratio is calculated by (1), where
Pckdeadline_miss indicates the number of packets that did not
meet their deadlines, and Pcktotal determines the number of
packets transferred during the simulation.
(1)
The second objective function is calculated using (2) and seeks to minimize the overall static energy consumed by the NoC. This calculation considers the power dissipated in each router during the transfer of packets belonging to the communication flows resulted from the task mapping. The static energy is given by the simulated time and the static power dissipated by the routers. This one was determined by synthesizing the VHDL models of the platforms to the SAED 32/28 standard cell technology using Synopsys design flow.
(2)
Each platform type supports a maximum number of different priority levels and a virtual channel is assigned to each level. However, depending on the generated task mapping, the number of virtual channels can be smaller than the maximum limit of the platform. Thus, the third objective function applies (3) to calculate the total storage capacity in the NoC routers used by a particular mapping configuration. In (3), VCapplication represents the number of virtual channels
required by the application and VCplatform defines the
maximum number of virtual channels on the chosen platform.
(3)
2) Solutions ranking
IV. EXPERIMENTAL RESULTS
In order to verify the effectiveness of the proposed design, we performed several experiments based on synthetic applications with different traffic scenarios, as follows.
A. Traffic Scenarios
For the experiments, synthetic models were generated based on the traffic classes proposed in [20]. Four classes of communication flow with different characteristics and requirements were specified. They are: (i) Signaling – SL, urgent and short messages (e.g. interrupts); (ii) Real-Time – RT, represents audio and video streams; (iii) Read/Write – RW, memory access operations; and (iv) Block Transfer – BT, transfer of large amounts of data.
TABLE II. TRAFFIC CLASSES ADOPTED IN THE EXPERIMENTS
Traffic class Payload size Required bandwidth Deadline
SL 4 flits 320 Mbps 20 ns RT 40 flits 320 Mbps 125 s RW 4 flits 2560 Mbps 150 ns
BT 2000 flits 2560 Mbps 50 s
The applications evaluated in the experiments were composed of 16 tasks with the communication flows randomly distributed in pairs of randomly selected tasks. Five traffic scenarios were specified. The first four scenarios emphasize a particular traffic class with the distribution of a larger amount of flows of this class. The fifth scenario has the same amount of each pattern of traffic flow, as can be seen in Table III. In absolute numbers, there are 50 communication flows in the first four scenarios and 60 flows in the last one.
TABLE III. TRAFFIC SCENARIOS
Scenario SL RT RW BT
1 40% 20% 20% 20%
2 20% 40% 20% 20%
3 20% 20% 40% 20%
4 20% 20% 20% 40%
5 25% 25% 25% 25%
The genetic algorithm was configured with a population of 140 individuals evolving for 200 generations. In the initialization, we set 25 individuals for each platform and other 40 individuals were generated with the using of random distribution. The single-point crossover and real polynomial mutation rates were set to 0.9 and 0.03, respectively. Only individuals with valid mappings in each generation were simulated. For each individual, the simulation was performed for 50000 clock cycles (or 50 s for Tclk = 1 ns), with an average transfer of about 1850
packets per simulation. The number of packets transferred during the simulated time depends on the application, as Table IV shows.
TABLE IV. SIMULATION ROUNDS FOR EACH SCENARIO
Scenario Number of simulations
(valid mappings)
Transferred packets (average)
1 12433 2218
2 15294 932
3 15976 1762
4 16030 3773
5 15309 580
B. Trade-off Discovery
[image:7.612.325.547.298.397.2]Table V presents data that express a comparison between the mappings with the lowest deadline miss ratio and those randomly generated in the first generation. It can be seen that the optimization flow obtained improvements in the deadline miss ratio and in the energy consumption in almost all the scenarios. It was possible to reduce the energy consumption for all the scenarios, except for Scenario 2.
TABLE V. REDUCTIONS IN THE DEADLINE MISS RATIO
Scenario Deadline miss ratio
reduction
Energy consumption reduction
1 17.0 % 7.2 %
2 4.8 % -2.8 %
3 10.0 % 6.1 %
4 0.2 % 27.8 %
5 3.7 % 21.8 %
Average 7.1 % 12.2 %
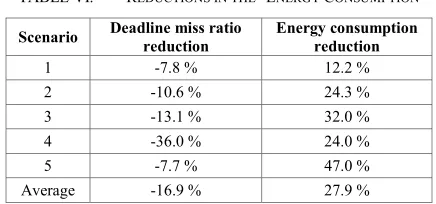
[image:7.612.327.545.489.591.2]Table VI compares the mappings with the higher reduction in the energy consumption with the first mapping of each scenario. In this case, all the mappings with the lowest energy consumption degraded the deadline miss ratio in comparison with the random mapping.
TABLE VI. REDUCTIONS IN THE ENERGY CONSUMPTION
Scenario Deadline miss ratio
reduction
Energy consumption reduction
1 -7.8 % 12.2 %
2 -10.6 % 24.3 %
3 -13.1 % 32.0 %
4 -36.0 % 24.0 %
5 -7.7 % 47.0 %
Average -16.9 % 27.9 %
Table VII presents how the optimization flow selects and configures a platform in order to reduce the deadline miss ratio and the network costs, which is given by the number and depth of virtual channels (buffers) in each input channel. It first presents the costs of the platform (Sk) used
TABLE VII. PLATFORM SELECTION
Scenario
Best mapping of the first generation
Best mapping of the other generations
Sk VCs Cost Sk VCs Cost
1 S2 3 x 04 flits 12 S3 5 x 02 flits 10
2 S0 1 x 16 flits 16 S3 6 x 02 flits 12
3 S3 7 x 02 flits 14 S3 6 x 02 flits 12
4 S2 4 x 04 flits 16 S3 6 x 02 flits 12
5 S2 4 x 04 flits 16 S3 6 x 02 flits 12
Obs: The Cost column indicates the number of flits per input channel
The presented results indicate that, for the studied scenarios, it is preferable to use a large number of shallow (2-flit) virtual channels. It is also important to note that, although there were available up to 8 virtual channels, the best results employed 5 or 6 channels. The input channel costs reduced by 21% on average, as Objective3 aims at
reducing the number of necessary buffers in order to lower the static energy consumption.
The following charts present the evolution of the deadline miss ratio and the energy consumption along the simulations. Fig. 7 presents the results for the first scenario. The deadline miss is around 18% in the first generation and then is reduced to 1.1% in the 94th generation. The lowest
rate (0.9%) is reached in the 161st generation, with an
[image:8.612.54.299.75.188.2]energy consumption of about 0.45 J. This is not the minimal consumed energy, but it is the smallest for the lowest deadline miss ratio.
Fig. 7. Deadline miss ratio and energy consumption for Scenario 1
The communication pattern on Scenario 2 has a greater amount of RT flows. As Fig. 8 shows, the best deadline miss ratio (8.8%) was obtained in the 4th generation. The
[image:8.612.318.553.112.197.2]subsequent generations presented none improvement in this metric. However, the last generations consumed less energy.
Fig. 8. Deadline miss ratio and energy consumption for Scenario 2
The results for Scenario 3 are illustrated in Fig. 9. The experiment characterizes applications with a higher density of read/write flows. The best result was obtained in the 58th
generation with 2.2% of missed deadlines. From this point,
[image:8.612.316.553.281.367.2]there is no more improvement in this metric. However, as occurred in Scenario 2, the energy consumption is improved in the last generations.
Fig. 9. Deadline miss ratio and energy consumption for Scenario 3
Scenario 4 (Fig. 10) showed little progress in the deadline metric, which reached 2.8% in the first generation and later stabilized at 2.6%. However, the energy consumption was reduced by 27% when comparing the 41st
[image:8.612.55.290.393.485.2]generation with the first one.
Fig. 10.Deadline miss ratio and energy consumption for Scenario 4
In the last scenario, there is no numerical prevalence of any traffic pattern. As Fig. 11 shows, the lowest deadline miss ratio (6.2%) was obtained in the 46th generation. On
the other hand, the lowest energy consumption was reached in the 97th generation, and with the same deadline miss ratio.
Fig. 11.Deadline miss ratio and energy consumption for Scenario 5
C. Computational cost
[image:8.612.317.552.451.536.2]Despite the high computational cost, the proposed approach is justified by allowing the reduction of the silicon costs to meet the application requirements. In addition, there are opportunities to accelarate the simulation through the use of more abstract models, or even replacing it by hardware emulation, approaches that were not in the context of this work. Considering the state of the art, such approaches could speed up the design space exploration up to three orders of magnitude [21].
V. CONCLUSIONS
This work presented an optimization flow based on genetic algorithm to map applications in NoC-based SoC platforms. The experiments demonstrated the ability of the proposed approach in finding good mapping solutions in light of the optimization criterion. The paper extends the state-of-the-art by tackling the problem of applications that are time sensitive, but not time-critical such as those addressed in [9] and [10], thus using simulations to guide the optimization process. Furthermore, this work also considers the minimization of the number and depth of virtual channel buffers as an optimization objective, which has not been seen in previous work.
In the evaluated scenarios, it was possible to reduce the communication deadline miss ratio and the amount of buffer storage used in the network. In addition, the energy consumption was also reduced in most of the scenarios in comparison with a random mapping.
We consider that this technique can be utilized in early stages of a design, as it requires little information regarding the application characteristics. Furthermore, due to the flexibility of the genetic algorithm, it is very simple to configure other metrics for optimization. It is noteworthy that the designer can use intermediate solutions found on the early generations and adjust the optimization process to evolve in a larger or smaller number of generations.
As future work we intend to: (i) explore the adjustment of the NoC operating frequency to meet the deadline requirements of all the packets; (ii) extend the traffic generation model to enable analysis of the mapping and scheduling across heterogeneous and multitask systems; (iii) improve the convergence and quality of solutions by customizing the genetic operators; (iv) speed up the simulation by using transaction-level modeling and multithreading programming; (v) implement an FPGA platform for hardware emulation; and (iv) perform experiments with larger applications and platforms.
ACKNOWLEDGMENTS
The authors thank for the support of Capes – the Brazilian Federal Agency for Support and Evaluation of Graduate Education. The authors also thank the Kanpur Genetic Algorithms Laboratory of the Indian Institute of Technology, Kanpur, India, which provided the source code of NSGA-II genetic algorithm.
REFERENCES
[1] S. Borkar, “Thousand core chips: a technology perspective,” in Proc. Design Automation Conference (DAC), 2007, pp. 746–749.
[2] A. Burns, L. S. Indrusiak, and Z. Shi, “Schedulability Analysis for Real Time On-Chip Communication with Wormhole Switching,” Int. J. of Embedded and Real-Time Communication Systems, v. 1, n. 2,
pp. 1-22, Apr. 2010.
[3] L. Chen and T. M. Pinkston, “NoRD: Node-Router Decoupling for Effective Power-gating of On-Chip Routers,” in Proc. Microarchitecture (MICRO), 2012, pp. 270–281.
[4] S. Tosun, “New heuristic algorithms for energy aware application mapping and routing on mesh-based NoCs,” J. of Systems Architecture (JSA), v.57, n.1, pp. 69-78, 2011.
[5] G. Ascia, V. Catania, M. Palesi, “A multi-objective genetic approach to mapping problem on Network-on-Chip,” J. of Universal Computer Science (JUCS), v. 12, n. 4, pp. 370-394, Feb. 2006.
[6] C. A. C. Coello, “Evolutionary multi-objective optimization: a historical view of the field,” IEEE Computational Intelligence Magazine, v. 1, n. 1, pp. 28-36, Feb. 2006.
[7] A. K. Singh, M. Shafique, A. Kumar, and J. Henkel, “Mapping on Multi/Many-core Systems: Survey of Current and Emerging Trends,” in Proc. Design Automation Conference (DAC), 2013, pp.1-10. [8] P. K. Sahu and S. Chattopadhyay, “A survey on application mapping
strategies for Network-on-Chip design,” Journal of Systems Architecture (JSA), v. 59, n. 1, pp. 60-76, Jan. 2013.
[9] M. N. S. M. Sayuti and L. S. Indrusiak, “Real-time low-power task mapping in Networks-on-Chip,” in Proc. IEEE Computer Society Annual Symposium on VLSI (ISVLSI), 2013, pp. 14-19
[10] M. N. S. M. Sayuti and L. S. Indrusiak, “Simultaneous optimisation of task mapping and priority assignment for real-time embedded NoCs,” in Proc. Euromicro International Conference on Parallel, Distributed and Network-Based Processing (PDP), 2015, pp. 692-695.
[11] M. A. A. Faruque, J. Henkel,“Transaction specific virtual channel allocation in QoS supported on-chip communication,” in Proc. of ASAP, 2007, pp.48-53.
[12] M. A. A. Faruque, J. Henkel, “Minimizing virtual channel buffer for router in on-chip communication architectures,” in Proc. Design, Automation and Test in Europe (DATE), 2008, pp. 1238-1243. [13] H. Jingcao, R. Marculescu, “Application-specific buffer space
allocation for networks-on-chip router design,” in Proc. Int. Conf. on Computer-Aided Design (ICCAD), 2004, pp. 354-361.
[14] L. S. Indrusiak, “End-to-end schedulability tests for multiprocessor embedded systems based on networks-on-chip with priority-preemptive arbitration,” JSA, v. 60, n. 7, pp. 553-561, June 2014. [15] K. Deb, A. Pratap, S. Argawal and T. Meyarivan, “A fast and elitist
multiobjective genetic algorithm: NSGA-II,” IEEE Transactions on Evolutionary Computation, v. 6, n. 2, pp. 182-197, Apr. 2002. [16] K. Deb, Multi-objective optimization using evolutionary algorithms,
Chichester, 2001, pp.80–85.
[17] C. A. Zeferino, A. A. Susin, “SoCIN: a parametric and scalable network-on-chip,” in Proc. Symp. on Integrated Circuits and Systems Design(SBCCI), 2003, pp. 169-174.
[18] M. D. Berejuck, C. A. Zeferino, “Adding mechanisms for QoS to a network-on-chip,” in SBCCI, 2009, pp. 153-158.
[19] J. V. Bruch, M. Pizzoni, C. A. Zeferino, “BrownPepper: A SystemC-based simulator for performance evaluation of Networks-on-Chip,” in
Proc. Very Large Scale Integration (VLSI-SoC), 2009, pp. 223-226. [20] E. Bolotin, I. Cidon, R. Ginosar, and A. Kolodny, “QNoC: QoS
architecture and design process for network on chip,” Journal of Systems Architecture (JSA), vol. 50, no. 2-3, pp. 105-128, Feb. 2004. [21] T. Van Chu, S. Sato, and K. Kise, “Ultra-fast NoC Emulation on a