Eye Tracking to Support
eLearning
Leana Copeland
August 2016
A thesis submitted for the degree of
Doctor of Philosophy
of The Australian National University
Research School of Computer Science
College of Engineering and Computer Science
To Mum, Dad and Michael,
Except where otherwise indicated, this thesis is my own original work.
Acknowledgements
First I would like to thank my supervisor Professor Tom Gedeon. I would not have got through this without you. The support and encouragement you gave me during my honours year and then throughout my candidature will never been forgotten. You fostered within me a curiosity and drive to succeed that I never knew I had. You are a one million supervisor and I am very lucky to have had you as mine. Not every supervisor would put up with their students following them down hallways or pounce on them when they get back their office to ask non-stop questions!
Mum, Dad, and Michael, thank you does not cover my gratitude to you for not only supporting me financially, emotionally, and mentally throughout my PhD, but also for maintaining an open fridge-door policy! Thank you for not only reading all of my conference and journal papers but also for reading every single chapter of this thesis (twice)! This thesis would not be in the state that it is without your help picking up the many spelling and grammar mistakes. Thank you for everything you have done for me. It is because of you I have made it this far, and once again you have helped get me over the line. I love you all and will forever appreciate your never-ending love and support in everything I do.
Many thanks go to my panel, Dr Sumudu Mendis and Dr Kristen Palmer, for your support and help. Thank you also to the staff from CECS for your support and help, notably Dr Richard Jones, Dr Duncan Stevenson, and Lynette Johns-Boast.
Thank you to Dr Sabrina Caldwell, your chats and insightful wisdom will be missed and were much needed at many times during my candidature. Thank you also for being a fantastic co-experimenter, my thesis really would not be what it is without you.
Thank you to my amazing friends Jaimi Pigram and Katie Hotchkis who have seen me through high school, my undergraduate studies, and now my postgraduate studies. Thank you for your love and support. I know that there were many times that you had to deal with me being tired and stressed, and you were always there for me to keep me going and put a smile back on my face. I never could have got to this point without you both and I am and always will be grateful for our everlasting friendship.
Abstract
Online eLearning environments to support student learning are of growing importance. Students are increasingly turning to online resources for education; sometimes in place of face-to-face tuition. Online eLearning extends teaching and learning from the classroom to a wider audience with different needs, backgrounds, and motivations. The one-size-fits-all approach predominately used is not effective for catering to the needs of all students. An area of the increasing diversity is the linguistic background of readers. More students are reading in their non-native language. It has previously been established that first English language (L1) students read differently to second English language (L2) students. One way of analysing this difference is by tracking the eyes of readers, which is an effective way of investigating the reading process.
In this thesis we investigate the question of whether eye tracking can be used to make learning via reading more effective in eLearning environments. This question is approached from two directions; first by investigating how eye tracking can be used to adapt to individual student’s understanding and perceptions of text. The second approach is analysing a cohort’s reading behaviour to provide information to the author of the text and any related comprehension questions regarding their suitability and difficulty.
To investigate these questions, two user studies were carried out to collect eye gaze data from both L1 and L2 readers. The first user study focussed on how different presentation methods of text and related questions affected not only comprehension performance but also reading behaviour and student perceptions of performance. The data from this study was used to make predictions of reading comprehension that can be used to make eLearning environments adaptive, in addition to providing implicit feedback about the difficulty of text and questions.
two variables hard for the reader to disentangle. Further analysis of participants’ eye gaze revealed that both the predefined and perceived text complexity affected eye gaze. We therefore propose using eye gaze measures to provide feedback about the implicit reading difficulty of texts read.
List of Publications
The work in this thesis is the original work of the author except where specific reference or acknowledgement is made to the work or contribution of others. Some of the material in this work has appeared in publications and presentations by the author. Only the contribution made by the author has been included in this work unless specific reference to the contrary has been made.
The publications produced during the thesis are:
1. Copeland, L., & Gedeon, T. D. (2015a). Tutorials in eLearning; How Presentation Affects Outcomes. Emerging Topics in Computing, IEEE Transactions on, PP(99), 1-1.
2. Copeland, L., Gedeon, T., & Caldwell, S. (2015). Effects of Text Difficulty and Readers on Predicting Reading Comprehension from Eye Movements. Paper presented at the IEEE 6th International Conference on Cognitive Infocommunications (CogInfoCom) 2015, Győr, Hungary.
3. Copeland, L., & Gedeon, T. (2015). Visual Distractions Effects on Reading in Digital Environments: A Comparison of First and Second English Language Readers. Paper presented at the Proceedings of the Annual Meeting of the Australian Special Interest Group for Computer Human Interaction, 506-516. 4. Copeland, L., & Gedeon, T. (2014a). Effect of presentation on reading behaviour. In Proceedings of the 26th Australian Computer-Human Interaction Conference on Designing Futures: the Future of Design (pp. 230-239). ACM.
5. Copeland, L., & Gedeon, T. (2014b). What are You Reading Most: Attention in eLearning. Procedia Computer Science, 39, 67-74.
6. Copeland, L., Gedeon, T., & Mendis, S. (2014a). Fuzzy Output Error as the Performance Function for Training Artificial Neural Networks to Predict Reading Comprehension from Eye Gaze. Paper presented at The 21st International Conference on Neural Information Processing 2014.
8. Copeland, L., Gedeon, T., & Mendis, B. S. (2014). An Investigation of Fuzzy Output Error as an Error Function for Optimisation of Fuzzy Signature Parameters. RCSC TR-1 2014.
9. Copeland, L., Gedeon, T., & Caldwell, S. (2014). Framework for Dynamic Text Presentation in eLearning. Procedia Computer Science, 39, 150-153. 10. Copeland, L., & Gedeon, T. (2013a). The effect of subject familiarity on
comprehension and eye movements during reading. Paper presented at the Proceedings of the 25th Australian Computer-Human Interaction Conference: Augmentation, Application, Innovation, Collaboration.
11. Copeland, L., & Gedeon, T. (2013b). Measuring reading comprehension using eye movements. Paper presented at the Cognitive Infocommunications (CogInfoCom), 2013 IEEE 4th International Conference on.
12. Caldwell, S., Gedeon, T., Jones, R., & Copeland, L. (2015) Imperfect Understandings: A Grounded Theory and Eye Gaze Investigation of Human Perceptions Of Manipulated And Unmanipulated Digital Images. In Proceedings of 3rd International Conference on Multimedia and Human-Computer Interaction (Winner of the Best Paper award)
13. Naqshbandi, K., Gedeon, T., Abdulla, U. A., & Copeland, L. (2015). Factors affecting identification of tasks using eye gaze. Paper presented at the Cognitive Infocommunications (CogInfoCom), 2015 6th IEEE International Conference on.
14. Taylor, J. L., Copeland, L., Chow, C., & Nitschke, K. (2015) VIRK: Virtual work environment to facilitate interaction between the unemployed. Paper presented at the Proceedings of the Annual Meeting of the Australian Special Interest Group for Computer Human Interaction as part of the OzCHI 24 hour student design challenge. (Winner of the student design challenge)
15. Gedeon, T., Zhu, X., He, K., & Copeland, L. (2014, January). Fuzzy Signature Neural Networks for Classification: Optimising the Structure. In Neural Information Processing (pp. 335-341). Springer International Publishing. 16. Gedeon, T., Copeland, L., & Mendis, B. S. (2012). Fuzzy Output Error.
Contents
ACKNOWLEDGEMENTS ______________________________________________ VII
ABSTRACT ___________________________________________________________ IX
LIST OF PUBLICATIONS _______________________________________________ XI
LIST OF FIGURES ____________________________________________________ XVII
LIST OF TABLES ______________________________________________________ XXI
CHAPTER 1. INTRODUCTION ___________________________________________ 1
1.1 Motivation ... 3
1.2 Primary Research Questions ... 4
1.3 Hypotheses ... 5
1.4 Methodology ... 5
1.5 Thesis Outline ... 6
1.6 Acronyms ... 9
1.7 Glossary ... 10
CHAPTER 2. LITERATURE SURVEY _____________________________________ 11 2.1 Attention and Effort ... 12
2.2 The Human Eye ... 13
2.3 Reading ... 19
2.4 Eye Tracking ... 32
2.5 The Use of Eye Tracking in HCI ... 37
2.6 Digital Text and eLearning ... 41
2.7 Summary ... 48
CHAPTER 3. EFFECT OF PRESENTATION ON READING BEHAVIOUR ____ 49 3.1 Introduction ... 50
3.2 Method ... 51
3.3 Result & Analysis ... 56
3.4 Discussion and Implications ... 66
CHAPTER 4. ANSWERING QUESTIONS IN ELEARNING TUTORIALS ____ 71
4.1 Introduction ... 71
4.2 What happens when text is presented with questions? ... 72
4.3 Using Answer-Seeking Behaviour for Feedback ... 79
4.4 Conclusion and Further Work ... 80
CHAPTER 5. EFFECTS OF PRESENTATION ON PREDICTION OF COMPREHENSION _____________________________________________________ 83 5.1 Introduction ... 84
5.2 Making Predictions ... 85
5.3 Fuzzy Output Error (FOE) ... 87
5.4 Description of data sets ... 90
5.5 Results and Analysis ... 92
5.6 Discussion ... 99
5.7 Conclusion ... 102
CHAPTER 6. EFFECT OF TEXT DIFFICULTY ON PREDICTION OF COMPREHENSION ____________________________________________________ 103 6.1 Introduction ... 104
6.2 Feature selection using genetic algorithms ... 105
6.3 Method ... 106
6.4 Results ... 113
6.5 Discussion and Implications ... 119
6.6 Conclusion and Further Work ... 121
CHAPTER 7. PERCEPTION AND PREDICTION OF TEXT DIFFICULTY ____ 123 7.1 Introduction ... 124
7.2 Background ... 125
7.3 Method ... 127
7.4 Predicting text difficulty ... 128
7.5 Effects of text properties on understanding and confidence ... 137
7.6 Discussion and Implications ... 140
7.7 Conclusion and Further Work ... 142
CHAPTER 8. DERIVING TEXT DIFFICULTY FROM EYE GAZE ___________ 143 8.1 Introduction ... 144
8.2 Method ... 145
8.3 Differentiating L1 and L2 readers ... 146
8.4 Deriving text difficulty from eye gaze ... 151
8.5 Discussion and Implications ... 158
8.6 Conclusion and Further Work ... 160
9.2 Framework for dynamic text selection and presentation based on eye
gaze ... 165
9.3 Summary ... 171
CHAPTER 10.CONCLUSION ___________________________________________ 173 10.1 Limitations ... 174
10.2 Future work ... 177
REFERENCES _________________________________________________________ 181 APPENDIX A. MATERIALS FOR EXPERIMENT 1 - EYE GAZE IN ELEARNING ENVIRONMENTS ________________________________________ 199 A.1 Participant Information Sheet ... 200
A.2 Participant Consent Form ... 201
A.3 Experiment texts ... 202
A.4 Web Search Tutorial Quiz ... 207
A.5 Questionnaires ... 209
APPENDIX B. MATERIALS FOR EXPERIMENT 2 - ADAPTIVE ELEARNING AND DIGITAL IMAGES _______________________________________________ 211 B.1 Participant Information Sheet ... 212
B.2 Participant Consent Form ... 214
B.3 Run sheet for user study ... 215
B.4 Pre-experiment Questionnaire ... 218
B.5 Experimental Content ... 218
APPENDIX C. DEALING WITH IMPERFECT EYE GAZE DATA __________ 229 APPENDIX D. READING IN DISTRACTING ENVIRONMENTS _________ 233 D.1 Introduction ... 233
D.2 Background ... 234
D.3 Method ... 236
D.4 Results ... 241
D.5 Discussion ... 247
List of Figures
Figure 2.1. The layers of the retina. Image taken from (Dyer & Cepko, 2001). ... 14
Figure 2.2. The optic tract in the human brain. Image taken from https://senseofvision.wikispaces.com/ (Last accessed: 8th November 2015). ... 15
Figure 2.3. Diagram of the anatomy of the eye. Image taken from: https://nei.nih.gov/sites/default/files/nehep-images/eyediagram.gif (Last accessed: 29th January 2016) ... 16
Figure 2.4. Figure 2 from (Rayner, 1998) examples of the moving window paradigm ... 23
Figure 2.5. Pupil and corneal reflection are tracked with camera-based eye tracking to estimate eye gaze. Image take from (Poole & Ball, 2005). ... 32
Figure 2.6. Example of calibration screen for “The Eye Tribe” eye tracker. Image taken from The Eye Tribe website: http://dev.theeyetribe.com/start/. ... 33
Figure 2.7. The Eye Tribe eye tracker. Image taken from https://theeyetribe.com/order/ Last accessed: 27th January 2016 ... 33
Figure 2.8. Eye movement trajectories of one participant; to the left is the eye movement whilst reading a paragraph and the right is the eye movement pattern whilst reading a question. Images taken from (Fahey, 2009). ... 36
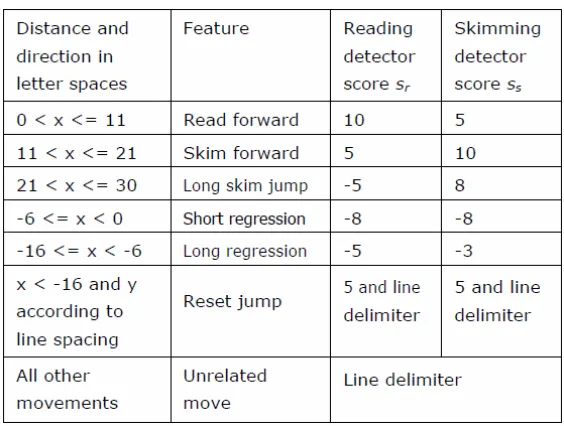
Figure 2.9. The scoring system for fixation transitions for the reading algorithm outlined in (Buscher et al., 2008). Taken from (Buscher et al., 2008). ... 38
Figure 3.1. Example of text only tutorial page (T). ... 52
Figure 3.2. Example of text and comprehension question tutorial page (T/Q). ... 53
Figure 3.3. Example of comprehension questions only tutorial page (Q). ... 53
Figure 3.4. Experiment set up; Participant to the left with the experimenter’s laptop and view to the right. ... 54
Figure 3.5. Means and standard deviations of reading ratios (% of eye movements detected as reading) for text only page which are in formats A, C and D (A: ! → !/$; C: ! → $; D: $ → ! → $). ... 61
Figure 3.6. Example of fixations recorded from reading text only page in format A (! → !/$) ... 61
Figure 3.7. Example of fixations from reading text only page in format C (! → $) ... 62
Figure 3.8. Example of fixations recorded from reading text only page for format D ($ → ! → $) ... 63
Figure 3.10. Example of eye movements from reading and answering questions on
questions and text tutorial page for Format A (! → !/$) ... 65
Figure 3.11. Example of eye movements from reading and answering questions on questions and text tutorial page for Format B (B: !/$) ... 66
Figure 4.1. Example of answer-seeking behaviour ... 74
Figure 5.1. Plots of : (a) FMF1; (b) FMF2; and (c) FMF3 ... 90
Figure 5.2. Plots of (a) FMF4; (b) FMF5; (c) FMF6; and (d) FMF7 ... 90
Figure 5.3. Hierarchical clustering of eye movement measures for Format C (! → $) ... 96
Figure 5.4. Hierarchical clustering for eye movement measures from format D ($ → ! → $) ... 97
Figure 6.1. Description of the text property breakdown ... 107
Figure 6.2. The Flesch-Kincaid readability grade level and COH-Metrix L2 readability for each level of readability. ... 108
Figure 6.3 Process used to generate the paths ... 109
Figure 6.4. Example of text presented in the Wattle online eLearning environment ... 111
Figure 6.5. Normalised number of fixations (NNF) for each text ... 117
Figure 6.6. Regression ratios for each text ... 118
Figure 7.1. Description of the text difficulty ... 127
Figure 7.2. Participant versus GA-kNN predictions of conceptual level (for each level of readability) ... 129
Figure 7.3. Participant versus GA-kNN prediction of readability level (for each level of conceptual difficult) ... 130
Figure 7.4. Classification of perceived conceptual difficulty versus predefined conceptual difficulty from eye tracking data ... 131
Figure 7.5. Classification of perceived readability level versus predefined readability level from eye tracking data ... 132
Figure 7.6. L1 readers’ subjective understanding on the text ... 137
Figure 7.7. L2 readers subjective understanding ratings ... 138
Figure 7.8. Average comprehension score per question ... 138
Figure 7.9. L1 participants’ confidence ratings ... 139
Figure 7.10. L2 participants’ confidence ratings ... 140
Figure 9.1. Framework for Dynamic presentation of reading material in an online learning environment (Copeland, Gedeon, & Caldwell, 2014). ... 166
Figure C.1. Example of misaligned fixation data. ... 230
Figure C.2. Example of re-aligned fixation data. ... 231
Figure D.1. Example of distracting environment ... 238
Figure D.2. Example of signal A; highlighting and bolding of the last word read before a distraction. ... 238
Figure D.3. Example of signal B; greying out and italicizing the last word read before a distraction. ... 239
Figure D.4. Example of the 9-point calibration screen used in the experiment showing that perfect calibration was accomplished. ... 239
Figure D.5. Experiment setup ... 240
List of Tables
Table 2.1. Eye movement measures ... 26
Table 3.1. Comparison of eye movement measures for text only (T) pages (Mean ± Standard Deviation) (A: ! → !/$; C: ! → $; D: $ → ! → $). ... 60
Table 3.2. Comparison of eye movement measures for Questions and Text pages (Mean ± Standard Deviation) (A: ! → !/$; B: !/$) ... 64
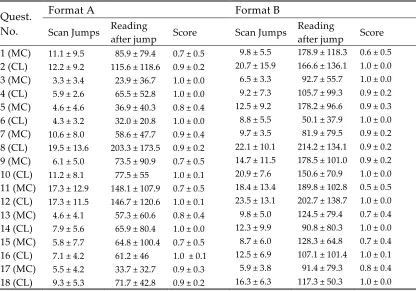
Table 4.1. Mean ± standard deviation answer-seeking behaviour for formats A and B (A: ! → !/$; B: !/$) ... 75
Table 4.2. Answer-seeking behaviour averages per question for format A (A: ! → !/$) ... 77
Table 4.3. Average answer-seeking behaviour per participant for format A (A: ! → !/$) ... 79
Table 5.1. Properties of each data set (A: ! → !/$; B: !/$; C: ! → $; D: $ → ! → $) ... 91
Table 5.2. Misclassification rate (MCR) comparison: FOE versus MSE as the performance function for ANN training (A: ! → !/$; B: !/$; C: ! → $; D: $ → ! → $) ... 93
Table 5.3. Comparison of Misclassification (MCR) results for predicting total comprehension scores for all eye movement measures (A: ! → !/$; B: !/$; C: ! → $; D: $ → ! → $) ... 95
Table 5.4. Comparison of average eye movement measures for clusters obtained from hierarchical clustering of format C data (! → $) ... 96
Table 5.5. Comparison of Misclassification (MCR) results for predicting questions scores for text only pages eye movement measures from Format C using Random Forest Ensemble Classification ... 97
Table 5.6. Cluster details for Format D ($ → ! → $) ... 98
Table 5.7. Comparison of Misclassification (MCR) results for predicting questions scores for text only pages eye movement measures from Format C using Random Forest Ensemble Classification ... 98
Table 6.1 Example of chunking concepts to derive the levels of concept difficulty for Topic 3 - Photo Credibility ... 108
Table 6.2. Participants’ ratings of familiarity to each topic. ... 110
Table 6.3. Distribution (%) of comprehension scores for each text and for the L1 and L2 data sets ... 113
Table 6.4. GA parameter settings for feature selection ... 113
Table 6.5. Classification rates (%) from no windowing or feature selection ... 114
Table 6.7. Correct classification (%) of reading comprehension for different windows ... 116 Table 7.1. Expected versus reported text difficulty for L1 readers ... 133 Table 7.2. Expected versus reported text difficulty for L2 readers ... 134 Table 7.3. Average correct classification rates (%) of text difficulty for the L1 group
from GA-kNN classification from eye tracking data ... 136 Table 7.4. Average correct classification rates (%) for the L2 group of text difficulty
group from GA-kNN classification from eye tracking data ... 136 Table 8.1. Average silhouette widths for clustering of A ... 146 Table 8.2. Eye movement averages from clusters for text A ... 147 Table 8.3. Average silhouette widths for clustering of E ... 148 Table 8.4. Eye movement averages from clusters for text E ... 149 Table 8.5. Average silhouette widths for clustering of J ... 150 Table 8.6. Eye movement averages from clusters for text J ... 150 Table 8.7. Average silhouette widths for clustering of average eye movement
measures for each text ... 152 Table 8.8. Averages of measures for each clusters for L1 readers, based on text
averages ... 152 Table 8.9. Texts within each cluster, for L1 averages for text ... 154 Table 8.10. Average silhouette widths for clustering of average eye movement
measures for each text ... 155 Table 8.11. Averages of measures for each clusters for L1 readers, based on text
Chapter 1
Chapter 1.
Introduction
“The more that you read, the more things you will know. The more that you learn, the more places you'll go.”
― Dr. Seuss, I Can Read With My Eyes Shut!
Online learning could extend teaching and learning from the classroom to a wide and varied audience with different needs, backgrounds, and motivations. Particularly in tertiary education, online learning technologies are becoming ubiquitous. This is due in part to increased accessibility and availability of computer hardware but also due to an influx of eLearning software and services. Universities now frequently offer online or off-campus degrees where students may have little or no face-to-face interaction with their instructors or other students. Even for university courses that deliver traditionally using face-to-face tuition, absenteeism from lectures is more prevalent and has been shown to negatively affect learning (Romer, 1993; Woodfield et al., 2006).
study of edX’s1 first MOOC showed students came from 194 different countries and two-thirds spoke English where the other third spoke other languages (Breslow et al., 2013). It is known that first English language (L1) and second English language (L2) readers differently (Rayner, 1998). Students also vary in respect to their prior knowledge, expertise, and reading abilities. These differences can impact the processing needed to properly comprehend text. Text characteristics have been shown to affect comprehension by which, in the context of legal documents, making text simpler would benefit vulnerable populations (Scherr, Agauas, & Ashby, 2015). This can be extended to considering the differences of students in eLearning, where some students may be supported by simpler texts.
Whilst some eLearning environments provide personalisation, the learner often does this explicitly. Adaption can be based on different qualities about the learner such as the current understanding, emotional state such as stress (Calvi et al., 2008; Porta, 2008) boredom (Jaques, Conati, Harley, & Azevedo, 2014), motivation (Kareal & Klema, 2006), learner style (Mehigan et al., 2011; Spada et al., 2008; Surjono, 2011, 2014), cognitive load (Coyne et al., 2009), learner style (Bondareva et al., 2013),and skill level (Chen, 2008). Adaption achieved in real time, without disruption to the learner, is the optimal solution rather than explicitly asking the learner. Progress in technology and understanding of psychophysiological responses provide the unique opportunity of adapting eLearning environments in real time and doing so based upon implicit behaviour. These methods include the use of biometric technology (Mehigan et al., 2011; Spada et al., 2008) and psychophysiological response data (Rosch & Vogel-Walcutt, 2013), especially eye tracking (Alsobhi et al., 2015; Barrios et al., 2004; Bondareva et al., 2013; Calvi et al., 2008; Conati, Jaques, & Muir, 2013; Conati & Merten, 2007; Kardan & Conati, 2013; Merten & Conati, 2006; D'Mello et al., 2012; Gütl et al., 2005; Mehigan, 2014; Mehigan & Pitt, 2013; Mehigan, 2013; Mehigan et al., 2011; Porta, 2008).
There is a broad range of scenarios that these adaptive technologies are directed at helping students, such as plugging into traditional online learning environments (Barrios et al., 2004; De Bra et al., 2013), or providing adaption in mobile environments (Mehigan & Pitt, 2013), or accounting for dyslexia (Alsobhi et al., 2015), or foreign language reading (Hyrskykari et al., 2000). With this past research we are able to take the results from the studies presented in this thesis and add to the current knowledge base of adaptive eLearning. The contribution lies solely in the domain of text-based learning materials that have not been focused upon in the past. Eye tracking can certainly be used to make learning via reading more effective in the context of eLearning.
Using eye gaze to control adaption of eye learning environments provides the ability to go beyond the student’s surface answering behaviour or preferences and adapt to the student’s implicit behaviour. Eye tracking has been shown to be a powerful tool for investigating how humans interact with computer interfaces. It has also been shown to provide information about the differences between L1 and L2 readers (Dednam et al., 2014; Kang, 2014). Eye movements can reveal abundant
information about the cognitive processes behind human behaviours. Louis Emile Javal noted in the late 1800s that the eyes move in a particular way when someone is reading. Since then eye tracking technologies have vastly improved and together with new brain scanning techniques such as functional magnetic resonance imaging (fMRI) we have a greater knowledge of how humans read (Bowman et al., 2010).
While brain scans provide a good way of seeing how the brain reacts during reading, eye tracking affords the unique ability to observe the underlying cognitive processes of reading in an unobtrusive manner. There is now a plethora of research that investigates how the eye moves during the reading process which go down to the level of predicting where the eye will land on a word and for how long it will fixate (e.g. the E-Z Reader model (Reichle et al., 2006; Reichle et al., 1999, 2003, 2012; Reichle et al., 2009) and the SWIFT model (Engbert et al., 2005). Additionally, research on eye movements during reading has shown that eye movements reveal difficulties in reading (Frazier & Rayner, 1982), text difficulty and comprehension (Rayner et al., 2006), as well as differentiating between L1 and L2 readers (Dednam et al., 2014; Kang, 2014). While we now know a lot about the reading process, the application of it into the design eLearning environments is still in early days. Additionally, there is still much to be learnt about the differences between L1 and L2 readers in the context of eLearning. With eye tracking becoming increasingly more precise whilst decreasing dramatically in cost, the use of such technology in adaptive eLearning is becoming plausible.
The problem of how to make eLearning environments effective to a wide and varied audience is significant; especially when learning materials come in many types and forms, and quite often depend on the subject being taught. For example a mathematics course would have exercises including many mathematical symbols as opposed to a history course, which would be more likely to have text-based materials. The focus of this thesis is on text-based materials and the use of eye tracking technology to analyse reading and learning behaviour. This thesis investigates ways of using eye tracking to make eLearning environments adaptive to the reader based upon their reading behaviours. This can mean real-time alteration of the learning environment to reflect the student’s current comprehension and state. It can also mean the use of eye tracking to monitor the cohort’s reading and learning behaviours and using this information as a means of improving the quality of the learning materials. Both are investigated in this thesis as a means of exploring the potential for using eye tracking to make eLearning environments better for learning.
The remainder of the introduction chapter outlines the motivations for this thesis; the primary research questions and hypotheses of the investigation; and finally the thesis structure is outlined.
1.1
Motivation
then chances are, you are reading something, like Facebook posts, tweets, online news, instant messaging, or your email, since communication is now often carried out via textual means. As Dr Seuss points out so eloquently, reading is a very good way for gaining information and the Internet and computer devices make it easier to access vast amount of information. Reading moulds what we know and what we know is used to develop opinions and base actions upon. This suggests that what a person reads can have a large bearing on their current knowledge, their beliefs, and what they are likely to be interested in. Learning itself is an ability that is shaped by what we know. Reading and learning can therefore be seen as having a somewhat reciprocal relationship.
There has been an increase is the use of eLearning systems. This can be seen both in the educational sector where tertiary institutions quite often use online learning environments in addition to the traditional face-to-face teaching, as well as in industry for employee training. This provides us with a unique opportunity to enhance both the reading and the learning processes due to the capabilities of electronic systems to provide feedback to their users. Already there are systems that record eye movements whilst reading documents to provide implicit feedback about the perceived relevance of parts of a document (Buscher et al., 2012). Furthermore, the ability to record the parts of a document that have not been comprehended properly or read thoroughly could give feedback to the user of the parts of the document that may need to be re-read for better understanding of the content. On the other hand, feedback about how a document is read can provide information to the author as to how easily it is read and understood. In turn, the author can revise the document to make it easier to read and comprehend. In education feedback often comes from assessment results. Presentation of course content may be in the form of slides, readings, tutorials, all of which are increasingly presented online. Feedback about how students comprehend and read these documents may offer insight into assessment results. This kind of feedback could provide invaluable information to instructors about how to better present course content.
1.2
Primary Research Questions
The central research question of this thesis is:
Can eye tracking be used to make eLearning environments more effective for first and second language English readers?
1. Can outcomes of eye gaze analysis be used to optimise the layout of reading materials in eLearning environments for learning outcomes? How does the layout compare for L1 and L2 readers?
2. Can eye gaze be used to provide feedback about learning behaviour in eLearning environments for L1 and L2 readers?
3. Can eye tracking data be used to predict reading comprehension scores in eLearning environments for L1 and L2 readers?
a. Does presentation of text affect predictions of comprehension? b. Does text difficulty affect predictions of comprehension?
4. Can participants predict text difficulty and can we predict text difficulty from their eye gaze?
5. Can eye gaze data be used to differentiate between L1 and L2 readers and to derive a measure of text difficulty?
These questions all investigate a sub-component of the overall question of whether eye tracking can be used to make eLearning more effective. In all cases we investigate this for both L1 and L2 readers, whereby we compare the outcomes for two groups. In this way, the investigation is a comparison of first and second language readers.
1.3
Hypotheses
The overall hypothesis is that using eye tracking to analyse the reading and learning behaviour of first and second English language readers can be used to improve reading and learning in eLearning environments. Within each chapter we explain the hypotheses for the investigation carried out in that chapter. However, an overview of these hypotheses is:
1. Layout of text and questions will affect eye gaze and learning outcomes as well as affect L1 and L2 readers in the same way even though there will be differences between the two groups.
2. Eye gaze can provide feedback about implicit learning behaviours, in particular, answering behaviours.
3. Different formats and different levels of text difficulty will affect prediction outcomes of reading comprehension.
4. Eye gaze data can be used to predict text difficulty.
1.4
Methodology
Questionnaire data was also gathered from the participants. There are two main studies that were carried out in the thesis. Each study involves in-depth analysis that is covered by more than one chapter.
1.5
Thesis Outline
The research presented in this thesis is aimed at answering the overarching question of how eye tracking can be used to make eLearning more effective. The thesis is organised in a way that follows the order of the research sub-questions.
Chapter 1: Introduction
This chapter introduces the thesis, the motivation, the research questions that will be explored, hypotheses and outline of the thesis.
Chapter 2: Literature review
The literature review presents an overview of current knowledge of eye gaze analysis and adaptive eLearning. Eye gaze has been used extensively to study the reading process. With this background on the reading process we move to the discussion of using eye gaze to make eLearning environments adaptive to students. This thesis seeks to build upon previous research and enhance the current state of adaptive online learning environments.
Chapter 3: Effect of presentation on reading behaviour
Chapter 3 addresses the first research question of whether eye gaze can be used to find appropriate layouts of reading materials in eLearning environments. This chapter describes a user study that investigated how different sequences of text and assessment questions affect performance outcomes, eye movements, and reading behaviour of L1 and L2 readers. The results from the study show that different presentation sequences induce different performance outcomes, eye movements, and reading behaviour. The presentation sequence impacts participants’ ability to accurately perceive their own understanding, in addition to inducing specific reading behaviours, such as thorough reading. The outcomes from this study can be used to influence how students interact with the learning environment as well as how they learn the material.
Chapter 4: Answering questions in eLearning tutorials
behaviour to measure how question difficulty and as an implicit measure of how difficult a participant finds a tutorial and quiz.
Chapter 5: Effects of presentation on prediction of comprehension
Using the data collected from the user study described in Chapter 3 we explore how presentation formats affect the prediction outcomes of reading comprehension from eye movements. The hypothesis being that the different eye movements caused by the formats will cause different levels of prediction accuracy. The chapter incorporates three components of analysis; the first component builds on previous work of using fuzzy output error (FOE) as an alternative performance function to mean square error (MSE) for training ANNs, as a means of improving reading comprehension predictions. The use of FOE-ANN produced better classification results compared to MSE-ANN. Additionally, the FOE trained ANN outperforms other comparison machine learning techniques. Finally, clustering of the more complex formats revealed reading behaviour properties.
Chapter 6: Effects of text difficulty on prediction of comprehension
Continuing from Chapter 5, this chapter focuses on predicting reading comprehension of text that is shown without comprehension questions. We extend the work by investigating the effect of text difficulty and machine learning techniques on prediction accuracy. Another user study was carried out to collect data from L1 and L2 participants as they read texts with differing degrees of difficulty. The grades of difficulty are based on different levels of readability and conceptual difficulty. We hypothesised that text difficulty and reader type would affect prediction accuracy. We found that neither had a significant effect on the accuracy of the k-nearest neighbour (kNN) classifier used. Whilst this is the case, we did manage to improve the classification accuracy to on average 80% for the L1 group and 73% for the L2 group, which is a substantial improvement from the 44% correct classification obtained in the previous chapter for format C. These results were achieved by using genetic algorithms (GA) for feature selection, which were significantly higher than the results produced when no feature selection is performed.
Chapter 7: Perception and prediction of text difficulty
perceptions showed that they are poor at predicting predefined text difficulty, especially when the readability and the conceptual difficulty are not the same. Additionally, the text difficulty affected comprehension scores and confidence levels of the L1 readers.
Chapter 8: Deriving text difficulty from eye gaze
The eye tracking data from the user study in Chapter 6 was used to investigate whether L1 and L2 readers’ eye gaze are distinct, and whether eye gaze measures can be used to derive text difficulty. The investigation involves clustering eye movement measures from participants using kmeans clustering. Whilst there are clusters of different reading behaviours for different levels of text difficulty, such as skimming and thorough reading, the L1 and L2 groups are not distinct. Instead, there is a tendency for L2 readers to read more thoroughly compared to skimming. The average eye gaze measures for each text were clustered using kmeans. The clusters show that there are distinct reading behaviours and that the average eye gaze measures can be used to rate the texts based on the derived reading difficulty for the L1 and L2 groups. These findings can be used to provide feedback for the purpose of adapting learning material.
Chapter 9: Discussion and Implications
This chapter discusses the results from the preceding chapters, each of which addressed a sub-question of whether eye tracking can be used to make learning more effective in eLearning environments. This overall question is essentially approached from two directions. The first approach is by investigating whether eye tracking can immediately make eLearning environments better suited to the individual learner. The demonstration of these results is through the use of adaptive eLearning whereby the system adapts to the student’s understanding levels and perceptions of difficulty. The second approach is the use of historical eye tracking data to make eLearning more effective. This is through the use of eye tracking to provide information to the author of the text and comprehension questions regarding their difficulty. This information can in turn be used to improve the quality of online texts and more accurately define their complexity. To show this we have tied the results from each chapter together in the presentation of a dynamic text selection method to make eLearning environments adaptive.
Chapter 10: Conclusion
The thesis is concluded with a summary of the research findings, and a discussion of the limitations of the research and how it can be improved and extended.
Appendix A: Experiment materials for eye gaze in eLearning environments
Appendix B: Experiment materials for adaptive eLearning and digital images
The participant information form, consent form, run sheet, texts and questionnaire used in the experiment explained in Chapter 6.
Appendix C: Dealing with eye gaze data that is imperfect
This appendix explains the post calibration used in the first study.
Appendix D: Reading in distracting digital environments
This appendix outlines preliminary results from a user study on reading in distracting environments.
1.6
Acronyms
The following is a list of acronyms used throughout this document:
ALE Adaptive eLearning Environment
ANOVA Analysis of variance
ANN Artificial Neural Network
FOE Fuzzy Output Error
FOE-ANN Feed-forward ANN trained using backpropagation with FOE
as the performance function
FMF FOE Membership Function
HCI Human Computer Interaction
KNN k-nearest neighbour
L1 First English language reader
L2 Second English language reader
MANOVA Multivariate analysis of variance
MCR Misclassification rate
MOOC Massive Open Online Course
MSE Mean Squared Error
MSE-ANN Feed-forward ANN trained using backpropagation with MSE
as the performance function
1.7
Glossary
This is a glossary of the terms used within this thesis.
Cloze question Assessment questions that can be a sentence or paragraph
with words removed thereby requiring the reader /
participant to fill them in. For example, “This is an ________ of a cloze question” were the missing word is example.
eLearning Learning materials presented using digital technology and
usually via the Internet or Intranet.
Eye gaze pattern The combination of all the eye gaze points recorded for a
participant for each screen showing a text.
Eye gaze point Eye gaze trackers take measurements of where the
participants’ eye is looking on the screen at regular intervals. Gaze points are used to determine fixations and saccades.
Eye tracker Equipment used to measure eye gaze location.
Fixation When the eye finishes a saccade and stays relatively still to
take in visual information for processing.
Flesch-Kincaid Grade Level A readability test that returns the minimum education
level (based on the USA education system) needed for the reader to understand the text.
Readability Refers to an explicit measure of text readability as calculated
by readability formulae, which typically counts syllables, words, and sentences to determine readability. The readability formula used throughout this thesis is the commonly used metric Flesch-Kincaid Grade Level.
Saccade A rapid movement of the eye as it jumps from one fixation to
another. Little to no visual information is taken in during a saccade.
Wattle The online eLearning environment used at the Australian
Chapter 2
Chapter 2.
Literature Survey
This chapter reviews a range of research on the physiology and psychology of reading through to the practical use of human computer interaction (HCI) for eLearning. The central focus of the discussion is on the use of eye tracking to record and analyse eye gaze. Since its invention, eye tracking has proven to be an effective way of analysing human behaviours. This is particularly true for reading, as the eyes have been shown to move in a unique way during reading. These movements consequently reveal much about the underlying cognitive functions involved in reading (review by Rayner (1998)).
Eye tracking is a relatively recent technology (Huey, 1968) but advances in hardware and software for eye tracking have seen an increased popularity of eye tracking for many uses. Initially eye tracking was primarily used for reading analysis, but this technology has proven to be useful in usability testing and HCI (Jacob & Karn, 2003; Poole & Ball, 2005). Reading in a digital environment is now ubiquitous. Concurrently, eLearning technologies have become popular. Given that a primary form of educational material is text and that eye tracking provides an invaluable method of analysing reading behaviour, this raises the question of how eye tracking can be used to make the learning process more effective in eLearning.
The illusion of of "seeing"
2.1
Attention and Effort
Attention and effort are two cognitive experiences that impact what will be discussed in this thesis. In later sections discussion of the human eye, its functions, and how they apply to reading behaviours will be centred somewhat on attention and effort. This brief discussion about attention and effort is focussed on its applicability to reading.
Attention is focused awareness and can be thought of as the allocation of cognitive resources to deal with some stimuli over others (Buscher et al., 2012; Kahneman, 1973). Selective attention is conscious; an example being that one can move one’s head and/or eyes to either look or not look at something. Reading is an example of selective attention where the reader has to consciously choose to allocate attention to the task of looking at the page and reading. On the other hand, involuntary attention occurs when one’s attention is allocated to a sudden change in the environment with no conscious control over this allocation. Hearing a loud or surprising noise and turning to see what made it, where it came from, and if it is a threat, is an example of involuntary attention.
There are limited cognitive resources in the human brain and thus limits to human attention. When attention is subjectively allocated it reflects, at least in some way, the person's preference. A person will focus on what they consider most relevant, interesting, or useful in a given situation (Buscher et al., 2012). For humans a reliable measure of attention is eye movement (Henderson, 2003).
2.1.1
Attention and Visual Processing
Due to the anatomy of the human eye, humans do not view scenes in full; they only view parts of it, and only the essential parts in detail. This leads to the intriguing fact that just because the eyes are directed upon a stimulus does not guarantee that all parts of the stimulus are seen; only that which is needed. This observation has been
demonstrated many times; perhaps most famously in The Invisible Gorilla experiment (Simons & Chabris, 1999). In the experiment, participants watched a short film where two teams, wearing black and white shirts respectively, were passing basketballs between members of their own teams. The players are moving around rapidly, weaving in between one another. Participants are asked to count the number of passes made only by the white team. Halfway through the video a person wearing a gorilla suit crosses the court, thumps their chest and moves on. What they found was that half of the participants did not see the gorilla. This is a demonstration of selective attention where participants are forced to focus on a task and become effectively blind to everything else, termed inattentional blindness.
observers in the gorilla experiment. Participants who did not perceive the gorilla had their gaze fixed upon the gorilla for about a second, which is the same time as those who did perceive it. Furthermore, factors such as age and expertise in dealing with certain stimuli are correlated with perceiving unexpected stimuli. So looking at something does not equate to perceiving it; something that has to be kept in mind when analysing eye gaze data.
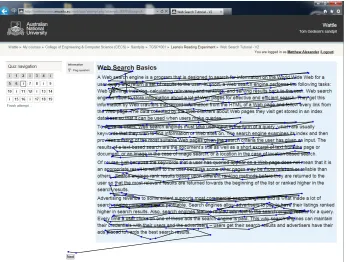
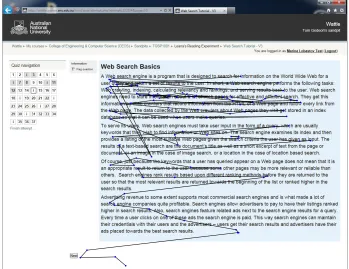
Inattentional blindness is related to change blindness, a phenomenon where humans are seemingly blind to visual change in a stimulus, not always caused by focusing on an absorbing task. Simons and Levin (1998) showed this in a remarkable experiment where an experimenter initiated a conversation with a pedestrian and half way through the conversation the experimenter was replaced by another person. Only half the participants realised that the experimenter had been changed. Even if the eyes are directed upon a stimulus there is no guarantee that all parts will be seen. We have included an example that is designed to show this point. In the triangle2 figure shown on the previous page most people are not aware that there are is a duplication of the word "of" until it is pointed out to them. The choice of how eye movements are used in real world situations has to take this non-direct relationship into account.
The last point of this subsection is that not all features of a visual stimulus can be reportable. In short, shown the string "aaaaaaa" one could quite easily report that it is a group of a's but most likely not that is it a group of 7 a's without taking a longer to look in order to count them. These phenomena illustrate that the brain does not need to know everything and in fact would not be as efficient if it did. Instead it calculates what it needs only when it is needed. This is why attention and effort are important concepts. Eye gaze provides the remarkable ability to actually identify what is seen in fine detail and to some degree where attention lies. The goal of this research is not to investigate attention; however these concepts must be kept in mind when undertaking reading analysis. Just putting text in front of someone will not guarantee that it is read or even seen.
2.2
The Human Eye
Eyes are the small but complex, organs that enable vision in humans. The human eye is capable of responding to a portion of the electromagnetic spectrum, referred to as visible light. In most cases, reading is possible because our eyes give us the ability to see. This section contains an overview of the physiology of the human eye as an introduction to how humans can take in visual information to be processed by the brain. Finally, how the eye moves to take in information is discussed.
2.2.1
Visual Processing in Humans
The sensory organs collect information about the environment and physical state. The brain processes all of the complicated information that streams in from the sensory organs and then decides what to do with it. Evolutionary processes favour
brains that can process the complex information in the most beneficial and effective ways in order to promote survival or even more significantly, reproductive capacity. A large portion of the human brain is used in visual processing, which itself is a complex array of neural processes. Consequently, vision actually occurs in the brain and not in the eyes, which are just there to take in the information (Gehring, 2005).
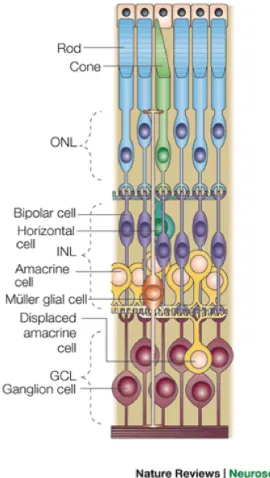
Figure 2.1. The layers of the retina. Image taken from (Dyer & Cepko, 2001).
To illustrate this fact, when humans who have been blind for most of their lives are given surgery to give them eyesight, such as corneal implants, they do not miraculously start "seeing" the world in the way that someone with normal vision from birth does. Instead they have to learn to see; the neural networks in the brain have to be reorganised to provide this ability. If vision was lost early in life or a person is blind from birth, it is believed parts of the visual processing system never completely develop to the extent of an individual with unimpaired vision (Cohen et al., 1997). This highlights the fascinating point that some brain function is dependent upon input from the sensory organs. From an evolutionary point of view it is very likely that the eyes came before the brain (Gehring, 2005). Intuitively this is because there is no point having such an intricate information-processing unit if it has no information to process.
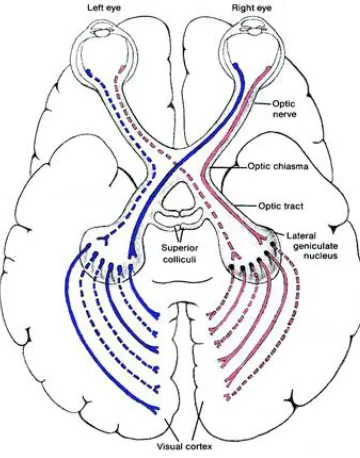
Figure 2.2. The optic tract in the human brain. Image taken from
https://senseofvision.wikispaces.com/ (Last accessed: 8th November 2015).
The retina transforms light that enters the eye into an electrical signal using photoreceptors. The retina is a complex multilayer structure, as shown in Figure 2.1 and the following is an overview of how the light that enters the eye then makes its way to the brain. The photoreceptor layer in the human eye contains two types of light receptors: rods and cones, shown at the top of Figure 2.1. Rods are responsible for vision in low level light and are used in peripheral vision, cones are responsible for vision in higher levels of lights and for the ability to see colour. When a rod or cone absorbs light energy, an electrical signal is generated. These signals are passed through a layer of bipolar cells onto ganglion cells that integrate the electrical signals from many photoreceptors. The resulting signals are transmitted through the long axons of the ganglion cells that bundle together to form the optic nerve. The optic nerve transmits the signal to the brain via the optic chiasma where information from the left half of each visual field goes to the right hemisphere and similarly for the right (Schwarz & Schmückle, 2002).
The optic tract projects to three major subcortical structures (Schwarz & Schmückle, 2002) that make use of the visual information for different purposes. These structures are: the pretectum which controls pupillary reflexes; the superior colliculus which controls saccadic eye movements; and, the lateral geniculate nucleus (LGN), which is a thalamic nuclei and is the major relay for input to the visual cortex (Schwarz & Schmückle, 2002).
information that is then passed through to V2, and so on to V53. Complexity of the neural representation increases as the information flows through the cortical hierarchy (Dehaene, 2009).
2.2.2
Types of Vision
[image:38.595.208.365.350.472.2]The eye is capable of two types of vision, peripheral and detailed. Peripheral vision is hazy and occurs outside of the centre of gaze. Whilst peripheral vision is not very good at distinguishing colours and shapes, it is sensitive at detecting movements, and mostly used to gather information about the present surroundings. The human brain prioritises the information to give attention only to what it somehow deems important. For example, Itti and Baldi (2009) found that humans orient their attention and gaze toward surprising stimuli in the context of watching television. The reason for this orientation towards a stimulus is so that detailed vision can be used to examine the stimuli further and to manage the limited resources at hand in order that the most important stimuli are tended to first. The peripheral region of the visual field encompasses the whole retina apart from the foveal and parafoveal regions.
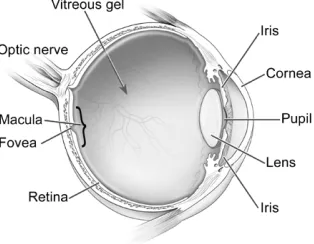
Figure 2.3. Diagram of the anatomy of the eye. Image taken from:
https://nei.nih.gov/sites/default/files/nehep-images/eyediagram.gif (Last accessed: 29th January 2016)
Detailed vision is handled by the fovea and to some degree, the parafovea. The fovea is the small central region of the retina that is sensitive to fine detail. The fovea only sees the central 2° of the visual field (Rayner & Bertera, 1979), and comprises of a region of only cone photoreceptors. The parafovea extends 10° of the visual field around the centre of gaze and provides less detailed visual information than the fovea but more than the periphery (Rayner & Bertera, 1979). Whilst the fovea takes up less than 1% of the retina, the processing of this information accounts for over 50% of the activity of the visual cortex in the brain (Mason & Kandel, 1991). The fovea is necessary in humans for reading (Rayner & Bertera, 1979). Since only a very small part of the eye is capable of seeing in detail, the eye is constantly on the move to assimilate information about the visual environment. How and why the eye moves in the way that it does will be discussed in the following subsection.
2.2.3
Types of Eye Movements
Eye movement is somewhat sporadic and complex, with the eyes moving at high velocity before stopping for a period to take in information before moving on again. Louis Emile Javal first described this process in 1879 by direct observation. It was not until almost a century later that Edmund Huey developed the first eye tracker (Huey, 1968). To explain this phenomenon, we must consider detailed vision again. The foveal region is where 2° of visual acuity extends across the fixation point (Rayner, 1998; Rayner & Bertera, 1979; Underwood & Batt, 1996). The parafoveal region is just outside the foveal region and it comprises 5° on either side of the fixation point (Rayner & Bertera, 1979). The peripheral region is the rest of the visual field.
Due to this limited area of detailed vision, the eyes are constantly on the move so that the fovea can be oriented upon different parts of the environment. The visual information is taken in when the eye has been reoriented and is relatively still; this is termed a fixation. The rapid jumps between fixations are termed saccades, and little to no visual information is taken in then (Rayner, 1998). Humans, therefore, do not view an image of the environment or scene as a whole, instead it is viewed in parts and in differing detail depending on where the centre of gaze is oriented (Henderson, 2003). The attention given to certain stimuli can be quite dependent upon the reasons for looking at them. This was shown by Alfred Yarbus in his early work on eye movements in scene perception (Yarbus, 1967). In his work, he showed that an individual's eye gaze was dependent upon the question they were asked.
Gaze control is influenced by many factors, including information about the environment or stimulus and several cognitive systems (Henderson, 2003). This includes past memories of the scene, whether the individual is searching or memorising the scene, and its spatial and semantic properties. This type of gaze control is said to be knowledge-driven (Henderson, 2003). More precisely, the spatial and semantic properties of the scene refer to the fact that you can anticipate where a particular object will be found. For example, you would expect to see a stapler on a desk and not on the floor. Further, there is a difference in the distribution of fixations and their durations based on whether the individual is trying to memorise or scan the scene (Henderson, 2003). Short, sparse and highly distributed fixations are observed for scanning and frequent, long and clustered fixations are observed for memorisation.
The control of when and where a fixation will occur involves coordination of information from several areas of the brain. In a general sense, we can say that it is the oculomotor system that oversees the process of directing the fovea to particular regions of interest. To accomplish this task, six different control systems are involved, which are grouped into two classes of gaze control mechanisms; intentional gaze shifting mechanisms and reflex gaze stabilizing mechanisms (Schwarz & Schmückle, 2002).
movements that move the fovea to another point of fixation (Purves et al., 2001). Pursuit eye movements keep the fovea on a moving target and are slower than saccades (Purves et al., 2001). Finally, vergence eye movements change the orientation of the eyes in accordance with the distance from which a target is being viewed. That is, the eyes rotate toward the nose when looking a close target.
The gaze stabilising mechanisms include vestibular eye movements and optokinetic eye movements (Schwarz & Schmückle, 2002). Vestibular eye movements are rotations of the eye produced in order to maintain vision in the same direction when there are head and body movements (Purves et al., 2001). Optokinetic eye movements are the combination of saccade and pursuit eye movements. These eye movements are seen when the observed target is moving fast across the visual field.
The fixations are characterised by the relative stillness of the eye to take in visual information. Although fixations are characterised by suppression of gaze shifting eye movements, the eye actually never stays completely still. This is due to three types of small eye movements: tremors, drifts, and microsaccades (Martinez-Conde, 2006). The eye constantly tremors; these are the smallest of any eye movements and are hard to record (Martinez-Conde, 2006). Drifts and microsaccades are larger movements, but are still quite small. Drifts appear to be random and caused by instability of the oculomotor system (Martinez-Conde, 2006). Microsaccades, similar to saccades, are jerking motions. They are differentiated from saccades as being the movements that happen whilst you are fixating. These small movements are usually regarded as noise as it is the larger eye movements that are of importance, especially in reading.
The main types of eye movements to consider when investigating reading are saccades, fixations and regressions. Saccades4 are high velocity ballistic movements of the eyes. At the end of a saccade the eye stays relatively still for a period of time; (a fixation) and is the only point during reading that visual information is encoded. Since visual information is taken in during fixations, there is often a focus on analysis of fixations, in particular the duration and location. No visual information is taken in during saccades under normal reading conditions (Underwood & Batt, 1996). However, they cannot be discounted, as lexical processing occurs during saccades (Yatabe et al., 2009) and that during long saccades, readers perform more lexical processing than during short saccades.
Saccades are motor movements and therefore require time to plan and execute. Saccade latency is the period associated with making a saccade (Rayner, 1998). Saccade latency still exists even if uncertainty about where and when to move the eyes is eliminated so saccade programming is believed to be done in parallel with comprehension processes during reading (Rayner, 1998). Engbert and Kleigl (2001) found that initiations of saccades are not completely driven by lexical processing and that in fact saccades can be autonomous (with foveal inhibition).
2.2.4
Pupillometry
Movements are not the only source of information about cognitive processes that can be gathered from eye tracking. Pupil dilation provides abundant information about the cognitive state of the person. Experiments have shown that pupil size correlates to cognitive load or effort, where the pupil dilates further as effort increases and constricts as it decreases (Kahneman & Beatty, 1966). Pupil dilation is a good indicator of effort (Kahneman, 1973; Pomplun & Sunkara, 2003) and as a result pupil dilation has become widely used as an involuntary indicator of mental effort and cognitive load.
Whilst pupil dilation as an indicator for mental effort was first described by Hess and Polt (1964), it has been greatly studied after popularisation by (Kahneman & Beatty, 1966). The correlation between cognitive load and pupil dilation has been confirmed in many contexts since including assessing task difficulty in response preparation (Moresi et al., 2008), software development (Fritz et al., 2014), listening comprehension (Engelhardt et al., 2010; Zekveld et al., 2014), as well as to detect decision to change task (Katidioti et al., 2014) and difficulties in making decision (Satterthwaite et al., 2007).
The rest of this section is concerned with outlining how pupil response can be used as an indicator of learning and in terms of HCI. Work on pupillary response as an index of learning (Sibley et al., 2011) show that pupil diameter drops as participants learn tasks reflecting decreased effort required in performing that task and increases at the beginning of another level of difficulty. The implication is that pupillary response could be used to assess whether an individual has learned a task sufficiently or if they need more training. Further, the pupillary response could be used to speed up and slow down training procedures by judging the rate at which the individual is learning. This is significant due to the implications of the use of pupil response in adaptive learning and training environments - a major aspect of this research.
Pupil response could therefore be used as an accurate indicator of task difficulty (Iqbal & Bailey, 2004; Pomplun & Sunkara, 2003; Zekveld et al., 2014). However, the averaged value of pupil response ignores the effects of the fluctuations of pupil dilation due to lower and higher loads of mental effort within tasks (Iqbal & Bailey, 2004). Pupil dilation can therefore be used to measure the changes in workload during a task (Iqbal et al., 2005). The pupil is seen to increase is dilation during a subtask but decrease when the subtask is finished. These results have interesting implications on our current research, as averaging of pupil response cannot be considered a viable measure in assessments of reading comprehension. This differs from the eye movements where commonly averaged numbers of fixations, saccade lengths, etc., are used as measures.
2.3
Reading
intricate social behaviour that has seen the human race flourish. Along with tool making and teaching, humans have become masters of invention. Amongst the greatest of these inventions is that of writing and reading language, and is indeed a very important part of human behaviour.
When a human reads, the eyes quickly and almost unconsciously move to acquire the text on display so that the brain can piece them all together and make logical sense out of it. Reading requires numerous cognitive processes to work together including visual information processing, word recognition, attention, language processing, and oculomotor control.
Up to 30% of Australian children have difficulty learning to read even with normal schooling (Burton et al., 2009). The process of learning to read is less natural than learning to speak, as written language is a much later addition to spoken language. Reading requires complex interpretation of symbols in order to derive meaning from them. This is termed comprehension and is the main objective of reading. Proficient readers quickly and unconsciously recognise words; if a word is not familiar it requires more cognitive processing in order to discern the meaning of the word. Reading, therefore, requires continuous education to ensure this processing time is minimised.
2.3.1
Human Language
Language is a complex communication system. Humans created written language as a way to communicate through time and space. Before reviewing written language, which is the foundation of reading, there is a short discussion about human language to present the foundations of language. A language system is made up of a set of symbols, sounds, meanings (semantics), rules (syntax) and interpretation (pragmatics). Language can be conceptualised in a hierarchical structure, consisting of basic elements at the lowest level called phonemes. Phonemes are the smallest elements of sound that form coherent speech such as how vowels and consonants are pronounced in English. Phonemes make up morphemes, which are the smallest units of meanings, e.g. words. Morphemes make up phrases that in turn combine with more words to make up sentences. The rules that govern these combinations are called syntax. Syntax is a part of grammar, which is the system of generating correctly structured expressions. Semantics is used alongside syntax to understand meaning of expressions (Burton et al., 2009). Semantics are the rules behind the meanings of the morphemes, words, phrases and sentences. Language is generative and diverse, allowing humans to express themselves in a potentially infinite number of ways. From a finite set of elements that make up language (phonemes) a very large number of words, phrases and sentences can be generated. Human languages are forever growing, changing and evolving to humans needs.