ABSTRACT
Objective Given recent concerns regarding general practitioner (GP) workforce capacity, we aimed to describe GPs’ career intentions, especially those which might impact on GP workforce availability over the next 5 years.
Design Census survey, conducted between April and June 2016 using postal and online responses, of all GPs on the National Health Service performers list and eligible to practise in primary care. Two reminders were used as necessary.
Setting South West England (population 3.5 million), a region with low overall socioeconomic deprivation. Participants Eligible GPs were 2248 out of 3370 (67% response rate).
Main outcome measures Reported likelihood of permanently leaving or reducing hours spent in direct patient care or of taking a career break within the next 5 years and present morale weighted for non-response.
Results Responders included 2177 GPs engaged in patient care. Of these, 863 (37% weighted, 95% CI 35% to 39%) reported a high likelihood of quitting direct patient care within the next 5 years. Overall, 1535 (70% weighted, 95% CI 68% to 72%) respondents reported a career intention that would negatively impact GP workforce capacity over the next 5 years, through permanently leaving or reducing hours spent in direct patient care, or through taking a career break. GP age was an important predictor of career intentions; sharp increases in the proportion of GPs intending to quit patient care were evident from 52 years. Only 305 (14% weighted, 95% CI 13% to 16%) reported high morale, while 1195 (54% weighted, 95% CI 52% to 56%) reported low morale. Low morale was particularly common among GP partners. Current morale strongly predicted GPs’ career intentions; those with very low morale were particularly likely to report intentions to quit patient care or to take a career break.
Conclusions A substantial majority of GPs in South West England report low morale. Many are considering career intentions which, if implemented, would adversely impact GP workforce capacity within a short time period. Study registration NIHR HS&DR - 14/196/02, UKCRN ID 20700.
INTRODUCTION
UK healthcare has traditionally had a strong primary care base in which general practi-tioners (GPs) have a central role in providing care across many settings, including within general practices, in out-of-hours care and in walk-in centres. Ninety per cent of UK National Health Service (NHS) patient contact takes place within primary care—1.3 million consultations every working day, 340 million consultations per year and with a projected primary care workload of 430 million consul-tations per year by 2018.1 2 Around 74% of
primary care contacts take place with a GP. General practice has been described as ‘the jewel in the crown’ of the NHS.3 GPs are
trained and have particular abilities in the diagnosis and management of patients with complex multimorbidity.
UK general practice is, however, facing major problems regarding maintaining the
Quitting patient care and career break
intentions among general practitioners
in South West England: findings of a
census survey of general practitioners
Emily Fletcher,1 Gary A Abel,1 Rob Anderson,2 Suzanne H Richards,1 Chris Salisbury,3 Sarah Gerard Dean,4 Anna Sansom,1 Fiona C Warren,5 John L Campbell1
To cite: Fletcher E, Abel GA,
Anderson R, et al. Quitting
patient care and career break intentions among general practitioners in South West England: findings of a census survey of general
practitioners. BMJ Open
2017;7:e015853. doi:10.1136/ bmjopen-2017-015853
►Prepublication history and
additional material is available. To view please visit the journal ()
Received 5 January 2017 Revised 9 March 2017 Accepted 10 March 2017
1Primary Care Research Group,
University of Exeter Medical School, Exeter, UK
2Evidence Synthesis & Modelling
for Health Improvement, University of Exeter Medical School, Exeter, UK
3Centre for Academic Primary
Care, NIHR School for Primary Care Research, School of Social and Community Medicine, University of Bristol, Bristol, UK
4Psychology Applied to
Rehabilitation and Health, University of Exeter Medical School, University of Exeter, Exeter, UK
5Institute of Health Research,
University of Exeter Medical School, Exeter, UK
Correspondence to
Professor John L Campbell; john. campbell@ exeter. ac. uk
Strengths and limitations of this study
► Census survey of all general practitioners (GPs) in
South West England, providing a cross-sectional overview of quit and career break intentions.
► High response rate, reflecting both rigorous planning
and implementation of the survey, and interest among GPs in the subject matter of workforce challenges.
► The potential for non-response bias was reduced
by weighting estimates to account for differential response rates by age, gender and practice role.
► The survey was cross-sectional, rather than
longitudinal in design; previous work demonstrates that intention to quit is a strong predictor of actually leaving.
► The research was undertaken within a rapidly
GP workforce, with imminent GP shortages and a concom-itant potential risk to patient care. A near quadrupling of unfilled GP posts was observed between 2010 and 2013 (from 2.1% to 7.9%), associated with an overall reduction in the number of GPs in England from 62 per 100 000 in 2009 to 59.5 in 2013.4 An estimated 12% of 2947 GP
training places were unfilled in England in 2013/2014. These issues are compounded by an ageing GP workforce (30% of the 43 000 current GPs are over 50 years old4).
Workforce issues are especially pertinent in inner city settings where recruitment and retention difficulties are further exacerbated by issues relating to the sociodemo-graphic mix of the population and to increased demands for care.
Research commissioned by the British Medical Associa-tion (BMA) has highlighted the continuing recruitment and retention challenges. In a 2014 study of 431 doctors from the 2006 cohort of medical graduates, those in general practice reported the lowest morale, with higher than expected workload being identified as a key problem.5 Of male doctors, 90% plan to work full time
compared with just 40% of female doctors.4 Younger
GPs currently appear to be more reluctant to take on the financial risks and responsibilities of becoming a partner in a practice, leading to existing partners expe-riencing an increased workload.6 Recent surveys and
reports have suggested that many GPs are considering permanently leaving direct patient care.1 4 7 Published
evidence suggests that nearly half of GPs leaving general practice between 2009 and 2014 were under 50 years old.8
There is thus an urgent need to find ways of retaining the GP workforce. If unaddressed, ‘meltdown’ in NHS care may follow within the foreseeable future.1 The
situ-ation has been described as a ‘crisis’,9 10 and there has
been a call for policies and strategies to help retain GPs in direct patient care.4 11 The future of NHS care over
the next 5 years12 is likely to involve new models of care,
with innovations involving increasing professional skill mix and new approaches to managing the service12 13 and
in establishing federations of previously independent practices.12 It is vital that the GP workforce is sustained
through this period of change.
Our research targets the critically important area of retention of experienced GPs in direct patient care, especially focussing on those GPs who may be consid-ering retirement, and those GPs who have taken a career break (most often on account of family reasons). Following piloting of our questionnaire in 2015,14 this
paper reports the findings of a recent census survey in which we aimed to describe GPs’ career intentions, especially those which might impact on GP workforce availability over the next 5 years. The survey consti-tutes one part of a comprehensive programme of work, seeking to identify implementable policies and strategies to support the retention of experienced GPs in direct patient care and to support the return of GPs following a career break.
METHODS Study sample
The sampling frame was the Medical Performers List of all GPs registered to practise in South West England, an area with a population of 3.5 million patients. National Performers List provides reassurance for the public that GPs, dentists and opticians practising in the NHS are suit-ably qualified, have up-to-date training, regulatory checks and appropriate English language skills.15 There were no
exclusion criteria. The survey was administered between April and June 2016.
Questionnaire
The questionnaire was based on that used within earlier work,14 modified to increase the number of questions
from 11 to 24, including rewording of four questions to reflect alignment of wording with other questionnaires of broadly similar intent and by providing clear defini-tions for key concepts in the questionnaire including a career break, taking steps towards changing work–life balance and defining a clinical session. The questionnaire (see online supplementary material) comprised items that asked GPs about their career intentions, reporting on the likelihood that they would permanently leave direct patient care within the next 2 years or within the next 5 years. GPs were also asked to report the likelihood that they would take a career break within the next 5 years or that they would reduce their weekly average hours spent in direct patient care during this time period. GPs rated the likelihood of these events from ‘very likely’ to ‘very unlikely’ using a four-point scale. The questionnaire also included a question about current level of morale and captured general demographic data: gender, age, ethnicity, region and year of graduation and current GP employment status (eg, partner, salaried), number and pattern of sessions worked in a typical week and involve-ment in delivering out-of-hours care.
Data collection
GPs were sent study materials through the post either to their practice or home address, and also by email, where available. The questionnaire was available for completion by post and online. The survey was supported by a compre-hensive strategy of publicising the research through routine newsletters and circulars of relevant organisa-tions and networks, including local medical committees, clinical research networks, Health Education England South West, the Royal College of General Practitioners, University of Exeter Medical School and the South West Academic Health Science Network.
Patient involvement
Although the study participants were GPs rather than patients, patient representatives contributed to the design of the survey. The planned work was presented to the wider project’s Patient and Public Involvement (PPI) group,16 by way of sharing the process and to check the
integrity of the work, and the group provided supportive feedback. The survey results were presented at a project management group meeting, which included PPI repre-sentatives who directly contributed to interpreting and contextualising the results.
Statistical analysis
Differential response rates between different groups of GPs would potentially introduce bias into crude survey findings. To counter this, we employed non-response weights. Inverse probability weights were calculated based on three factors: age (<40, 40–49, 50–54, 55–59 and 60 years and over), gender (male and female) and role (partner, salaried and locum/other). By employing these weights, we estimated what responses we would have received with a 100% response rate under the assumption that non-responders would have responded similarly to GPs of the same age, gender and role. Logistic regression was used to investigate the association between responses to questions regarding future career intentions (perma-nently leaving direct patient care within the next 2 and 5 years, taking a career break within the next 5 years and reducing average hours spent in direct patient care within the next 5 years). Each of the four sets of responses was dichotomised into ‘very likely’ and ‘likely’ versus other responses. Initially, unadjusted associations were exam-ined for effects attributable to the explanatory factors of gender, age, country of qualification, ethnicity, role/ position and rating of current morale. Subsequently, regression models adjusting simultaneously for all explanatory factors were used to examine adjusted asso-ciations. Similar models were used with reported morale as the outcome (but not including morale as an explana-tory factor). Regression analyses were restricted to those respondents with complete data on gender, age, country of qualification, ethnicity, role/position and rating of current morale.
Supplementary analysis
Interactions were explored between various factors in the models. While some of these were found to be statistically significant, the magnitude of the interaction terms was generally small and did not alter the interpretation of the data, with one exception commented on in the results. For this reason, we have not reported the more complex interaction models here.
In addition, we considered the possibility that some groups of GPs, for example female GPs, may not report the intention to reduce hours spent in direct patient care because they already work fewer hours, on average, than other groups. We therefore performed two supplemen-tary analyses, including either a binary variable indicating
part-time working (defined as working less than eight sessions per week) or a continuous variable detailing the reported number of sessions worked per week.
All analyses were performed in Stata V.14.2.
RESULTS
Questionnaires were distributed by post to 3370 GPs, with 1841 (55%) of these GPs also being sent the question-naire by email, where we had a valid email address (see online supplementary table 1). Completed questionnaires were received from 2248/3370 GPs who were surveyed (response rate 67%). Of the 2248 GP respondents, 673 (30%) used the online survey. Response rates were as high for both men and women (67% and 66% respectively). Participation was lower among GPs aged under 40 years (54%) when compared with the older GPs aged 50 and over (in excess of 68% in each age group) and was lower for salaried GPs (57%) when compared with GP partners (71%) and non-principal/locum GPs (64%).
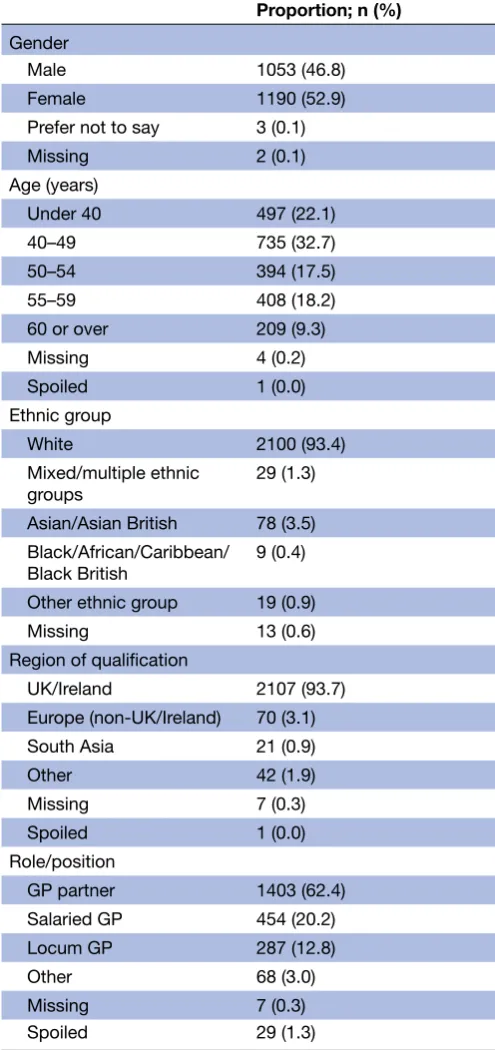
The median age of respondents was 48 years (table 1; IQR 40 to 55, range 28 to 84 years). Eighty-five per cent of respondents reported having a practice with which they were primarily affiliated; 25% of respondents reported that they were involved in the delivery of out-of-hours primary medical care. The majority (62%) of respon-dents were partners in their practices.
Career intentions
Of the 2248 responding GPs, 55 had already perma-nently left direct patient care; 16 had selected ‘none of the above’ to reflect their working status in direct patient care—that is, that they were not currently working in direct patient care nor on a career break, but had not permanently quit—and were removed from further anal-ysis. Differential response by age and role meant that GP groups reporting an intention to quit direct patient care were somewhat over-represented, introducing a small bias into the crude results which is accounted for in the weighted percentages.
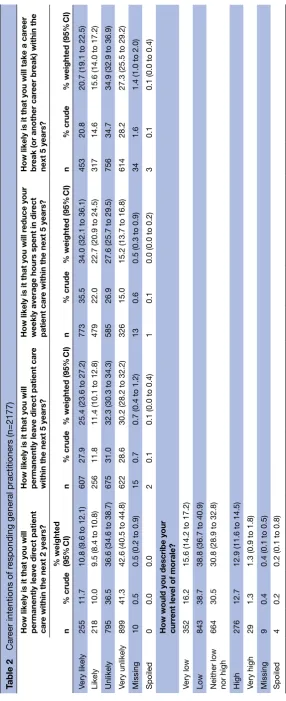
proportion of participants (1195; weighted percentage 54.4%, 95% CI 52.3% to 56.5%) reporting ‘low’ or ‘very low’ levels of morale compared with only 305 (weighted percentage 14.2%, 95% CI 12.8% to 15.8%) reporting ‘high’ or ‘very high’ morale.
Associations between GP characteristics and career intentions/morale
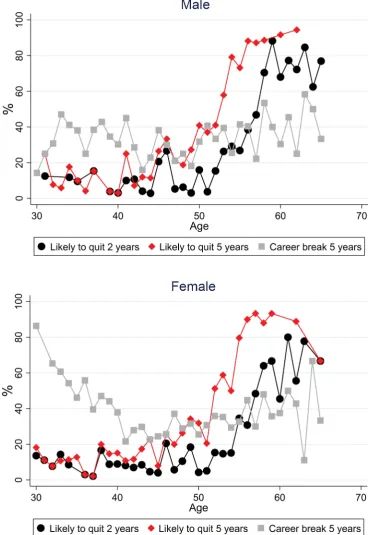
Figure 1 illustrates the reported intention to quit direct patient care of responding GPs broken down by gender
and each year of GP age, aggregating likely and very likely responses together. Reported quit intentions are strongly related to age, remaining low (<20%) among younger GPs (45 years and under) for quitting direct patient care in both of the next 2 and 5 years. Both of these outcomes show a sharp rise from the age of 52 years, with the propor-tion stating they were likely to quit in 5 years rising to almost 90% by the age of 56 years. The proportion antici-pating taking a career break as ‘likely’ was highest for the youngest GPs, especially among younger women where nearly 9 out of 10 female GPs aged 30 years reported the intention to take a career break, presumably on account of anticipated maternity leave.
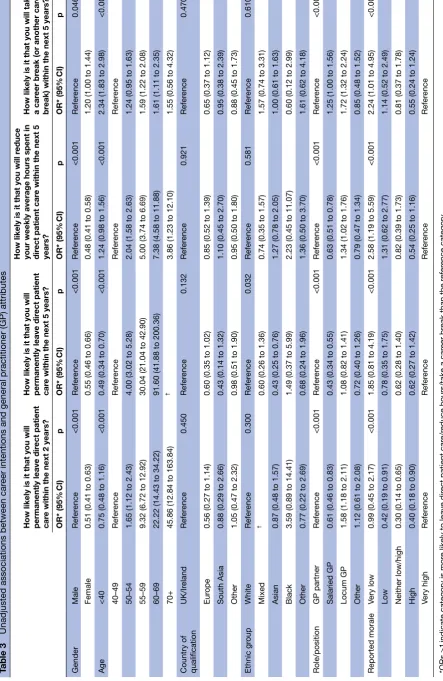
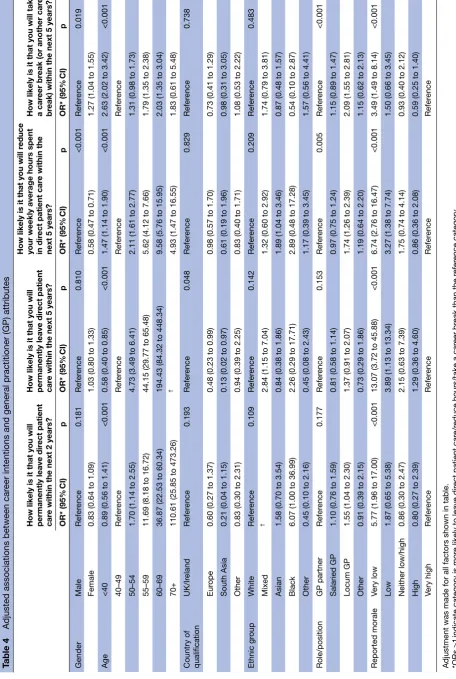
Of the 2177 respondents reporting that their current role involved direct patient care, 2119 (97%) provided complete information on gender, age, region of qualifica-tion, ethnicity, role/position and rating of current morale and were included in the regression analyses. Tables 3 and 4 show the results of the unadjusted and adjusted logistic regression analyses, respectively, for career inten-tions. In unadjusted analyses, there is strong evidence (p<0.001 for all) that gender and role are associated with being likely to report the intention to leave patient care within both 2 and 5 years, with female GPs being less likely to quit patient care than male GPs (OR 0.55, 95% CI 0.46 to 0.66 for leaving patient care in 5 years) and with locum GPs being the most likely to quit patient care and salaried GPs least likely. However, these associ-ations are likely be confounded, for example by the fact younger doctors were more likely to be female compared with older doctors. Once adjustment is made for all other factors, the effects of these characteristics on intentions to quit are no longer significant. However, after adjust-ment for other variables, women were still substantially less likely to report intending to reduce hours spent in direct patient care (OR 0.58, 95% CI 0.47 to 0.71), and locum GPs remained more likely to report intending to take a career break when compared with GPs in other roles.
Age was a very strong predictor of reported intention to leave direct patient care, a finding which persisted after adjustment (for example 60–69 vs 40–49 year olds OR=194.4 95% CI 84.3 to 448.3 for leaving patient care in five years). Age was also a strong predictor of the inten-tion to reduce hours in the adjusted model, with older GPs more likely to report this intention than younger GPs. Female GPs, GPs aged under 40 years and locum GPs were most likely to report the intention to take a career break after adjustment for other factors. A model including an interaction between age and gender showed that the effect of under 40 year olds being more likely to report intentions to take a career break was strongest in female GPs, consistent with the pattern shown in figure 1 (results not shown).
[image:4.595.40.288.78.604.2]Self-reported morale was a strong predictor of all four outcomes shown in tables 2 and 3. In the unadjusted anal-ysis, a ‘U-shaped’ relationship is seen for all four quitting outcomes, with those with ‘very high’ morale more likely
Table 1 Characteristics of responding general practitioners (GPs; n=2248)
Proportion; n (%)
Gender
Male 1053 (46.8)
Female 1190 (52.9)
Prefer not to say 3 (0.1)
Missing 2 (0.1)
Age (years)
Under 40 497 (22.1)
40–49 735 (32.7)
50–54 394 (17.5)
55–59 408 (18.2)
60 or over 209 (9.3)
Missing 4 (0.2)
Spoiled 1 (0.0)
Ethnic group
White 2100 (93.4)
Mixed/multiple ethnic
groups 29 (1.3)
Asian/Asian British 78 (3.5) Black/African/Caribbean/
Black British 9 (0.4) Other ethnic group 19 (0.9)
Missing 13 (0.6)
Region of qualification
UK/Ireland 2107 (93.7) Europe (non-UK/Ireland) 70 (3.1) South Asia 21 (0.9)
Other 42 (1.9)
Missing 7 (0.3)
Spoiled 1 (0.0)
Role/position
GP partner 1403 (62.4) Salaried GP 454 (20.2)
Locum GP 287 (12.8)
Other 68 (3.0)
Missing 7 (0.3)
Table 2
Car
eer intentions of r
esponding general practitioners (n=2177)
How likely is it that you will permanently leave dir
ect patient
car
e within the next 2 years?
How likely is it that you will permanently leave dir
ect patient car
e
within the next 5 years?
How likely is it that you will r
educe your
weekly average hours spent in dir
ect
patient car
e within the next 5 years?
How likely is it that you will take a car
eer
br
eak (or another car
eer br
eak) within the
next 5 years?
n
% crude
% weighted (95%
CI)
n
% crude
% weighted (95%
CI)
n
% crude
% weighted (95%
CI)
n
% crude
% weighted (95%
CI)
Very likely
255
11.7
10.8 (9.6 to 12.1)
607
27.9
25.4 (23.6 to 27.2)
773
35.5
34.0 (32.1 to 36.1)
453
20.8
20.7 (19.1 to 22.5)
Likely
218
10.0
9.5 (8.4 to 10.8)
256
11.8
11.4 (10.1 to 12.8)
479
22.0
22.7 (20.9 to 24.5)
317
14.6
15.6 (14.0 to 17.2)
Unlikely
795
36.5
36.6 (34.6 to 38.7)
675
31.0
32.3 (30.3 to 34.3)
585
26.9
27.6 (25.7 to 29.5)
756
34.7
34.9 (32.9 to 36.9)
Very unlikely
899
41.3
42.6 (40.5 to 44.8)
622
28.6
30.2 (28.2 to 32.2)
326
15.0
15.2 (13.7 to 16.8)
614
28.2
27.3 (25.5 to 29.2)
Missing
10
0.5
0.5 (0.2 to 0.9)
15
0.7
0.7 (0.4 to 1.2)
13
0.6
0.5 (0.3 to 0.9)
34
1.6
1.4 (1.0 to 2.0)
Spoiled
0
0.0
0.0
2
0.1
0.1 (0.0 to 0.4)
1
0.1
0.0 (0.0 to 0.2)
3
0.1
0.1 (0.0 to 0.4)
How would you describe your curr
ent level of morale?
Very low
352
16.2
15.6 (14.2 to 17.2)
Low
843
38.7
38.8 (36.7 to 40.9)
Neither low nor high
664
30.5
30.8 (28.9 to 32.8)
High
276
12.7
12.9 (11.6 to 14.5)
Very high
29
1.3
1.3 (0.9 to 1.8)
Missing
9
0.4
0.4 (0.1 to 0.5)
Spoiled
4
0.2
to report intentions to leave direct patient care/reduce hours/take a career break than those with ‘high’ or ‘neither low nor high’ morale (and in the case of leaving patient care in 2 years, more likely than any other morale category) but less likely to intend to leave/reduce hours/ take a career break than those with ‘very low’ morale. This U-shaped relationship largely disappears however after adjustment, and it is those GPs with ‘very low’ morale who are most likely to report intending to leave direct patient care, reduce hours in patient care or to take a
[image:6.595.112.485.52.588.2]career break. Moreover, the change in odds between ‘low’ and ‘very low’ morale is particularly strong. Table 5 shows the results of the logistic regression analysis modelling of factors associated with low or very low morale. Only age and practice role show any evidence of being associated with reported morale (p<0.001 for both). Those aged 50–54 years old are most likely to report low morale. In respect of role, GP partners are the most likely to report low morale, followed by salaried GPs and with locums and other GPs the least likely groups to report low morale.
Table 3
Unadjusted associations between car
eer intentions and general practitioner (GP) attributes
How likely is it that you will permanently leave dir
ect patient
car
e within the next 2 years?
How likely is it that you will permanently leave dir
ect patient
car
e within the next 5 years?
How likely is it that you will r
educe
your weekly average hours spent in dir
ect patient car
e within the next 5
years?
How likely is it that you will take a car
eer br
eak (or another car
eer
br
eak) within the next 5 years?
OR* (95% CI) p OR* (95% CI) p OR* (95% CI) p OR* (95% CI) p Gender Male Refer ence <0.001 Refer ence <0.001 Refer ence <0.001 Refer ence 0.046 Female
0.51 (0.41 to 0.63)
0.55 (0.46 to 0.66)
0.48 (0.41 to 0.58)
1.20 (1.00 to 1.44)
Age
<40
0.75 (0.48 to 1.16)
<0.001
0.49 (0.34 to 0.70)
<0.001
1.24 (0.98 to 1.56)
<0.001
2.34 (1.83 to 2.98)
<0.001 40–49 Refer ence Refer ence Refer ence Refer ence 50–54
1.65 (1.12 to 2.43)
4.00 (3.02 to 5.28)
2.04 (1.58 to 2.63)
1.24 (0.95 to 1.63)
55–59
9.32 (6.72 to 12.92)
30.04 (21.04 to 42.90)
5.00 (3.74 to 6.69)
1.59 (1.22 to 2.08)
60–69
22.22 (14.43 to 34.22)
91.60 (41.88 to 200.36)
7.38 (4.58 to 11.88)
1.61 (1.11 to 2.35)
70+
45.86 (12.84 to 163.84)
†
3.86 (1.23 to 12.10)
1.55 (0.56 to 4.32)
Country of qualification
UK/Ir eland Refer ence 0.450 Refer ence 0.132 Refer ence 0.921 Refer ence 0.470 Eur ope
0.56 (0.27 to 1.14)
0.60 (0.35 to 1.02)
0.85 (0.52 to 1.39)
0.65 (0.37 to 1.12)
South Asia
0.88 (0.29 to 2.66)
0.43 (0.14 to 1.32)
1.10 (0.45 to 2.70)
0.95 (0.38 to 2.39)
Other
1.05 (0.47 to 2.32)
0.98 (0.51 to 1.90)
0.95 (0.50 to 1.80)
0.88 (0.45 to 1.73)
Ethnic gr oup White Refer ence 0.300 Refer ence 0.032 Refer ence 0.581 Refer ence 0.610 Mixed †
0.60 (0.26 to 1.36)
0.74 (0.35 to 1.57)
1.57 (0.74 to 3.31)
Asian
0.87 (0.48 to 1.57)
0.43 (0.25 to 0.76)
1.27 (0.78 to 2.05)
1.00 (0.61 to 1.63)
Black
3.59 (0.89 to 14.41)
1.49 (0.37 to 5.99)
2.23 (0.45 to 11.07)
0.60 (0.12 to 2.99)
Other
0.77 (0.22 to 2.69)
0.68 (0.24 to 1.96)
1.36 (0.50 to 3.70)
1.61 (0.62 to 4.18)
Role/position GP partner Refer ence <0.001 Refer ence <0.001 Refer ence <0.001 Refer ence <0.001 Salaried GP
0.61 (0.46 to 0.83)
0.43 (0.34 to 0.55)
0.63 (0.51 to 0.78)
1.25 (1.00 to 1.56)
Locum GP
1.58 (1.18 to 2.11)
1.08 (0.82 to 1.41)
1.34 (1.02 to 1.76)
1.72 (1.32 to 2.24)
Other
1.12 (0.61 to 2.08)
0.72 (0.40 to 1.26)
0.79 (0.47 to 1.34)
0.85 (0.48 to 1.52)
Reported morale
Very low
0.99 (0.45 to 2.17)
<0.001
1.85 (0.81 to 4.19)
<0.001
2.58 (1.19 to 5.59)
<0.001
2.24 (1.01 to 4.95)
<0.001
Low
0.42 (0.19 to 0.91)
0.78 (0.35 to 1.75)
1.31 (0.62 to 2.77)
1.14 (0.52 to 2.49)
Neither low/high
0.30 (0.14 to 0.65)
0.62 (0.28 to 1.40)
0.82 (0.39 to 1.73)
0.81 (0.37 to 1.78)
High
0.40 (0.18 to 0.90)
0.62 (0.27 to 1.42)
0.54 (0.25 to 1.16)
0.55 (0.24 to 1.24)
Very high Refer ence Refer ence Refer ence Refer ence *ORs >1
indicate category is mor
e likely to leave dir
ect patient car
e/r
educe hours/take a car
eer br
eak than the r
efer
ence category
.
†This gr
oup has been excluded fr
om the analysis due to perfect pr
ediction, that is, all over 70 year olds r
eported being likely to leave dir
ect patient in 5 years, and no mixed ethnicity GPs
reported being likely to leave dir
ect patient car
Table 4
Adjusted associations between car
eer intentions and general practitioner (GP) attributes
How likely is it that you will permanently leave dir
ect patient
car
e within the next 2 years?
How likely is it that you will permanently leave dir
ect patient
car
e within the next 5 years?
How likely is it that you will r
educe
your weekly average hours spent in dir
ect patient car
e within the
next 5 years?
How likely is it that you will take a car
eer br
eak (or another car
eer
br
eak) within the next 5 years?
OR* (95% CI) p OR* (95% CI) p OR* (95% CI) p OR* (95% CI) p Gender Male Refer ence 0.181 Refer ence 0.810 Refer ence <0.001 Refer ence 0.019 Female
0.83 (0.64 to 1.09)
1.03 (0.80 to 1.33)
0.58 (0.47 to 0.71)
1.27 (1.04 to 1.55)
Age
<40
0.89 (0.56 to 1.41)
<0.001
0.58 (0.40 to 0.85)
<0.001
1.47 (1.14 to 1.90)
<0.001
2.63 (2.02 to 3.42)
<0.001 40–49 Refer ence Refer ence Refer ence Refer ence 50–54
1.70 (1.14 to 2.55)
4.73 (3.49 to 6.41)
2.11 (1.61 to 2.77)
1.31 (0.98 to 1.73)
55–59
11.69 (8.18 to 16.72)
44.15 (29.77 to 65.48)
5.62 (4.12 to 7.66)
1.79 (1.35 to 2.38)
60–69
36.87 (22.53 to 60.34)
194.43 (84.32 to 448.34)
9.58 (5.76 to 15.95)
2.03 (1.35 to 3.04)
70+
110.61 (25.85 to 473.26)
†
4.93 (1.47 to 16.55)
1.83 (0.61 to 5.48)
Country of qualification
UK/Ir eland Refer ence 0.193 Refer ence 0.048 Refer ence 0.829 Refer ence 0.738 Eur ope
0.60 (0.27 to 1.37)
0.48 (0.23 to 0.99)
0.98 (0.57 to 1.70)
0.73 (0.41 to 1.29)
South Asia
0.21 (0.04 to 1.15)
0.13 (0.02 to 0.97)
0.61 (0.19 to 1.96)
0.98 (0.31 to 3.05)
Other
0.83 (0.30 to 2.31)
0.94 (0.39 to 2.25)
0.83 (0.40 to 1.71)
1.08 (0.53 to 2.22)
Ethnic gr oup White Refer ence 0.109 Refer ence 0.142 Refer ence 0.209 Refer ence 0.483 Mixed †
2.84 (1.15 to 7.04)
1.32 (0.60 to 2.92)
1.74 (0.79 to 3.81)
Asian
1.58 (0.70 to 3.54)
0.84 (0.38 to 1.86)
1.89 (1.04 to 3.46)
0.87 (0.48 to 1.57)
Black
6.07 (1.00 to 36.99)
2.26 (0.29 to 17.71)
2.89 (0.48 to 17.28)
0.54 (0.10 to 2.87)
Other
0.45 (0.10 to 2.16)
0.45 (0.08 to 2.43)
1.17 (0.39 to 3.45)
1.57 (0.56 to 4.41)
Role/position GP partner Refer ence 0.177 Refer ence 0.153 Refer ence 0.005 Refer ence <0.001 Salaried GP
1.10 (0.76 to 1.59)
0.81 (0.58 to 1.14)
0.97 (0.75 to 1.24)
1.15 (0.89 to 1.47)
Locum GP
1.55 (1.04 to 2.30)
1.37 (0.91 to 2.07)
1.74 (1.26 to 2.39)
2.09 (1.55 to 2.81)
Other
0.91 (0.39 to 2.15)
0.73 (0.29 to 1.86)
1.19 (0.64 to 2.20)
1.15 (0.62 to 2.13)
Reported morale
Very low
5.77 (1.96 to 17.00)
<0.001
13.07 (3.72 to 45.88)
<0.001
6.74 (2.76 to 16.47)
<0.001
3.49 (1.49 to 8.14)
<0.001
Low
1.87 (0.65 to 5.38)
3.89 (1.13 to 13.34)
3.27 (1.38 to 7.74)
1.50 (0.66 to 3.45)
Neither low/high
0.86 (0.30 to 2.47)
2.15 (0.63 to 7.39)
1.75 (0.74 to 4.14)
0.93 (0.40 to 2.12)
High
0.80 (0.27 to 2.39)
1.29 (0.36 to 4.60)
0.86 (0.36 to 2.08)
0.59 (0.25 to 1.40)
Very high Refer ence Refer ence Refer ence Refer ence
Adjustment was made for all factors shown in table. *ORs >1
indicate category is mor
e likely to leave dir
ect patient car
e/r
educe hours/take a car
eer br
eak than the r
efer
ence category
.
†This gr
oup has been excluded fr
om the analysis due to perfect pr
ediction, that is, all over 70 year olds r
eported being likely to leave dir
ect patient in 5 years and no mixed ethnicity GPs
reported being likely to leave dir
ect patient car
Supplementary analyses exploring the contribution of current working patterns to any association with intentions to reduce hours spent in direct patient care did explain some of the difference between genders. However, even after adjustment for current working patterns, female GPs were still substantially less likely to report intentions to reduce hours spent in direct patient care than their male counterparts (not shown).
DISCUSSION Main findings
A high proportion of GPs—around two in every five— currently working within direct patient care in South West England reported an intention to permanently quit direct patient care within the next 5 years, this being one in five within the next 2 years. Further depletion of the GP workforce in this region of England through reduction of weekly average hours or through taking a career break within the next 5 years also emerged as an impending risk. Overall, 7 out of every 10 GPs in this region reported a career intention which, if implemented, would adversely impact the GP workforce capacity in South West England through GPs leaving direct patient care, reducing hours
spent in direct patient care or by taking a career break within the next 5 years.
Older age is highly predictive of a GP’s intentions to permanently quit direct patient care and to reduce hours. The intention to quit was independent of the GP’s role (partner, salaried or locum) and gender. The gender differences observed among younger GPs in respect of intended career breaks is a particular issue where, as currently exists, 69% of the GP trainee workforce are female,17 and where a substantial proportion of younger
women returning to clinical care do so on the basis of reduced hours1 and where doctors who wish to return to
clinical practice may face significant bureaucratic obsta-cles in doing so.18 The decision to reduce hours or to take
a career break varied with employment status, with locum GPs being most likely to report intentions to reduce hours or to take a career break. In a situation where GPs who are not partners in a practice do in fact leave direct patient care, the system of care appears vulnerable, with added strain likely to be placed on GPs who are partners in their practice.
[image:9.595.43.552.75.411.2]A key issue is whether the intention to leave is translated into reality, and few studies have explored this important
Table 5 Unadjusted and adjusted associations between self-reported low or very low morale and general practitioner (GP) attributes
Unadjusted Adjusted
OR* (95% CI) p OR* (95% CI) p
Gender Male Reference 0.134 Reference 0.231
Female 0.87 (0.72 to 1.05) 0.90 (0.76 to 1.07)
Age <40 0.73 (0.57 to 0.93) <0.001 0.69 (0.55 to 0.88) <0.001
40–49 Reference Reference
50–54 1.06 (0.81 to 1.37) 1.10 (0.85 to 1.43)
55–59 0.85 (0.66 to 1.10) 0.92 (0.71 to 1.18)
60–69 0.38 (0.26 to 0.57) 0.33 (0.23 to 0.48)
70+ 0.07 (0.01 to 0.56) 0.04 (0.01 to 0.32)
Country of qualification UK/Ireland Reference 0.157 Reference 0.194
Europe 0.74 (0.45 to 1.23) 0.73 (0.45 to 1.19)
South Asia 0.97 (0.32 to 3.01) 0.97 (0.40 to 2.36)
Other 0.50 (0.25 to 0.98) 0.55 (0.29 to 1.06)
Ethnic group White Reference 0.534 Reference 0.721
Mixed 0.82 (0.38 to 1.77) 0.82 (0.39 to 1.72)
Asian 1.59 (0.89 to 2.84) 1.31 (0.81 to 2.12)
Black 1.64 (0.37 to 7.21) 0.82 (0.20 to 3.28)
Other 1.01 (0.36 to 2.80) 0.73 (0.28 to 1.89)
Role/position GP partner Reference <0.001 Reference <0.001
Salaried GP 0.75 (0.59 to 0.94) 0.67 (0.54 to 0.84)
Locum GP 0.40 (0.30 to 0.53) 0.33 (0.25 to 0.43)
Other 0.22 (0.12 to 0.41) 0.20 (0.11 to 0.36)
Adjustment was made for all factors shown in table.
question. However, Hann et al19 explored this question
among nearly 1200 UK GPs followed up over 5 years, and identified a strong relationship between a stated intention to leave patient care and actually doing so, reflected in a 4.5-fold difference in odds of leaving between those with no stated intention to leave patient care when compared with those reporting a high intention to do so.
The majority of responding GPs in our study reported low morale, with less than 15% reporting high morale. GP morale was identified as an important predictor of future career intentions, particularly when morale was very low.
Strengths and limitations of the study
By ensuring alignment of wording with other surveys of similar intent allows the opportunity for comparing and contrasting of results. Recent high-quality surveys support our estimate of the proportion of GPs intending to leave general practice within the next 5 years.14 20–22 Unlike
most other similar surveys which tend to survey samples of GPs,7 23 we undertook a census survey of all GPs currently
eligible to provide patient care across a large area, providing a cross-sectional overview of the quit intentions of all GPs in South West England. The response rate was high (67%), reflecting both rigorous planning and imple-mentation of the survey and interest among GPs in the subject matter of workforce challenges. Further, we have reduced the potential for non-response bias by weighting our estimates to account for differential response rates by age, gender and practice role. The overall programme of work, of which this survey is one element, includes the planned development of a predictive risk modelling tool to enumerate risk of future workforce undersupply at local levels, thus offering the potential of providing data that will be of value to healthcare planners and policy makers. In addition, our study relates to a key current area of national interest and concern.
The study has a number of limitations. The survey was conducted among GPs in a single region of England which may not be entirely typical of England as a whole, for example in respect of population mix and practice setting.24 The region is often informally regarded as
having desirable living and working conditions.25 It seems
likely that other regions of England, with more inner-city areas with higher levels of deprivation, are likely to face even greater challenges in respect of the GP workforce than in the findings we have presented here. A further limitation is that the research was undertaken within a rapidly changing GP workforce policy environment, for example, the implementation in 2015–2016 of a 10-point plan agreed between authoritative UK health, govern-mental and professional bodies concerned about GP workforce issues.26 Finally, this survey was cross-sectional,
rather than longitudinal in design, and so we are unable to report on the actual translation of GPs’ reported career intentions into actual career decisions, although previous work has demonstrated intention to quit to be a strong predictor of actually leaving.19
Implications for research
Our survey is part of a multimethod suite of work commis-sioned by the NHS, seeking to inform evidence-based policies and strategies in a key area of national concern and which will involve stakeholder consultations with policy makers who have oversight of GP workforce plan-ning.16 Future research should include assessment of
the predictive validity of GPs’ reported career intentions by longitudinal follow-up of GPs, investigation of how reducing hours or better flexible working arrangements may influence GP retention and undertaking research exploring the potential for extended clinical roles among important allied healthcare professionals in the clinical workforce. Such groups might include nurses, physiother-apists and pharmacists, and developing such extended roles for these professionals within the primary care team may offer a rapid and potentially effective contribution to the alleviation of current GP workforce pressures. Research into the determinants and impact of working reduced hours should also encompass other aspects of flexible working arrangements in general practice, and how such arrangements may improve job satisfaction and work–life balance and thereby potentially increase GP retention in the longer term. This work also provides insight into which groups of GPs might best be targeted with interventions aiming to improve workforce reten-tion.
Implications for policy and practice
Concerns regarding the GP workforce are now recognised widely by authoritative bodies in the UK, leading to recent policy statements and initiatives26 and to the
establish-ment of a Primary Care Workforce Commission by Health Education England.4 Our research can inform this policy
agenda by providing an estimate of the likely proportion of South West GPs intending to leave direct patient care within the next 5 years through permanently quitting patient care or by taking a career break. Our findings are likely to be of relevance in other areas of England that may face even greater challenges in respect of the GP workforce. Retaining the direct patient care capacity of established GPs represents an immediate challenge for healthcare planners. Recognising and addressing issues of low GP morale is an area of importance, and addressing the issue may improve how GPs feel about their work and potentially be associated with improvements in patients’ experience of the care received.27 In the face of problems
recruiting to general practice28 and the wider workforce
problems, the UK government recently announced an increase in the number of training places for GPs26 and
an increase in the number of medical training places in the UK.29 But these medium-term to long-term
which need to be urgently considered. Developing and implementing relevant policies and strategies to achieve those ambitions will be important for the alleviation of the immediate pressures faced by the GP workforce and the populations of patients they serve.
CONCLUSIONS
Healthcare in England faces imminent challenges in respect of GP workforce capacity. This survey identifies the magnitude of the problem in South West England and highlights the important role of GP morale as one important factor contributing to that challenge. Acknowl-edgement of the magnitude of the problems is urgently required, along with implementation and monitoring of relevant policy and strategy. Failure to do so will risk serious adverse effects on the capacity and ability of the NHS to provide effective primary care to the UK popula-tion.
Contributors EF contributed to the study design, data collection, analysis and writing of the paper. JLC contributed to study design, analysis and writing of the paper. RA, SR, CS, SGD, AS and FCW contributed to the study design and writing of the paper. GAA contributed to analysis and writing of the paper. All authors read and approved the final paper. JLC is the guarantor of the paper.
Competing interests None declared.
Ethics approval University of Exeter Medical School Research Ethics Committee.
Provenance and peer review Not commissioned; externally peer reviewed.
Data sharing statement Requests for statistical code and dataset can be made to the corresponding author at john. campbell@ exeter. ac. uk. The dataset will be made available via a publicly accessible repository on publication. All authors, external and internal, had full access to all of the data (including statistical reports and tables) in the study and can take responsibility for the integrity of the data and the accuracy of the data analysis.
Open Access This is an Open Access article distributed in accordance with the terms of the Creative Commons Attribution (CC BY 4.0) license, which permits others to distribute, remix, adapt and build upon this work, for commercial use, provided the original work is properly cited. See: http:// creativecommons. org/ licenses/ by/ 4. 0/
© Article author(s) (or their employer(s) unless otherwise stated in the text of the article) 2017. All rights reserved. No commercial use is permitted unless otherwise expressly granted.
REFERENCES
1 Centre for Workforce Intelligence. In-depth review of the general practitioner workforce: final report. London, 2014.
2 Hobbs FDR, Bankhead C, Mukhtar T, et al. Clinical workload in UK primary care: a retrospective analysis of 100 million consultations in England, 2007–14. Lancet 2016;387:2323–30.
3 Berwick DM. A transatlantic review of the NHS at 60. BMJ
2008;337:a838.
4 Health Education England (HEE) Commission on GP workforce.
Securing the future GP workforce - delivering the mandate on GP expansion. London: Health Education England, 2014.
5 British Medical Association. BMA cohort study of 2006 medical graduates: eighth report. London, 2014.
6 Sansom A, Calitri R, Carter M, et al. Understanding quit decisions in primary care: a qualitative study of older GPs. BMJ Open
2016;6:e010592.
7. Hann M, McDonald J, Checkland K, et al; Seventh national GP worklife survey. Manchester: University of Manchester, 2013. 8 NHS Digital. General and personal medical services, England –
2004–2014, as at 30 September. Leeds: NHS Digital. 2015. http:// content. digital. nhs. uk/ catalogue/ PUB16934 .
9 Dayan M, Arora S, Rosen R, et al. Is general practice in crisis?
London: Nuffield Trust, 2014.
10. Baird B, Charles A, Honeyman M, et al. Understanding pressures in general practice. London: King's Fund. 2016. https://www. kingsfund. org. uk/ sites/ files/ kf/ field/ field_ publication_ file/ Understanding- GP- pressures- Kings- Fund- May- 2016. pdf .
11 Pulse. RCGP petitions government to create new 'medical assistant' role to relieve admin pressures on GPs. 2014. http://www. pulsetoday. co. uk/ 20008118. article#.VD_Iv01wbcs.
12 NHS. Five year forward view. London: NHS England, 2014. 13 The King’s Fund and Nuffield Trust. Securing the future of general
practice: new models of primary care London. 2013. http://www. nuffieldtrust. org. uk/ publications/ securing- future- general- practice . 14 Campbell J, Calitri R, Sansom A. Retaining the experienced GP
workforce in direct patient care (ReGROUP): final report. Exeter: University of Exeter, 2015.
15 NHS England national performers list London. 2016. https://www. performer. england. nhs. uk/ .
16 Primary Care Research Group UoEMS. The changing general practitioner workforce: the development of policies and strategies aimed at retaining experienced GPs and those taking a career break in direct patient care: ReGROUP project. 2016. http:// medicine. exeter. ac. uk/ research/ healthresearch/ regroup/ .
17 General Medical Council. The state of medical education and practice in the UK. London: GMC, 2015.
18 British Medical Association. Career break advice for GPs. London BMA. 2016. https://www. bma. org. uk/ advice/ career/ progress- your- career/ career- break- gp- advice (accessed 31 March 2017). 19 Hann M, Reeves D, Sibbald B. Relationships between job satisfaction, intentions to leave family practice and actually leaving among family physicians in England. Eur J Public Health
2011;21:499–503.
20 Gibson J, Checkland K, Coleman A, et al. Eighth national GP worklife survey. Manchester, 2015.
21 Dale J, Potter R, Owen K, et al. Retaining the general practitioner workforce in England: what matters to GPs? A cross-sectional study.
BMC Fam Pract 2015;16.
22 Martin SD, Gershlick BE. Under pressure: what the Commonwealth Fund's 2015 International Survey of General Practitioners means for the UK. London: The Health Foundation, 2016.
23 British Medical Association. BMA quarterly tracker survey: current views from across the medical profession. quarter 3: July/August 2014. London, 2014.
24 UK Government. English indices of deprivation 2015. 2015. https:// www. gov. uk/ government/ statistics/ english- indices- of- deprivation- 2015 .
25 wikipedia. South West England. 2016. https:// en. wikipedia. org/ wiki/ South_ West_ England#Deprivation.
26 Department of Health. GP five year forward view. London: England NHS, 2016.
27 King's College London: National Nursing Research Unit. Does NHS staff wellbeing affect patient experience of care? Policy Plus Evidence, Issues and Opinions in Healthcare 2013.
28 Rimmer A. A third of GP training posts are vacant after first recruitment round London. BMJ 2015. http:// careers. bmj. com/ careers/ advice/ A_ third_ of_ GP_ training_ posts_ are_ vacant_ after_ first_ recruitment_ round .
survey of general practitioners
South West England: findings of a census
intentions among general practitioners in
Quitting patient care and career break
L Campbell
Salisbury, Sarah Gerard Dean, Anna Sansom, Fiona C Warren and John Emily Fletcher, Gary A Abel, Rob Anderson, Suzanne H Richards, Chris
doi: 10.1136/bmjopen-2017-015853
2017 7:
BMJ Open
http://bmjopen.bmj.com/content/7/4/bmjopen-2017-015853 Updated information and services can be found at:
These include:
References
#BIBL http://bmjopen.bmj.com/content/7/4/bmjopen-2017-015853 This article cites 4 articles, 3 of which you can access for free at:
Open Access
http://creativecommons.org/licenses/by/4.0/
use, provided the original work is properly cited. See:
others to distribute, remix, adapt and build upon this work, for commercial the Creative Commons Attribution (CC BY 4.0) license, which permits This is an Open Access article distributed in accordance with the terms of
service
Email alerting
box at the top right corner of the online article.
Receive free email alerts when new articles cite this article. Sign up in the
Notes
http://group.bmj.com/group/rights-licensing/permissions To request permissions go to:
http://journals.bmj.com/cgi/reprintform To order reprints go to: