Int. J. Electrochem. Sci., 5 (2010) 653 - 667
International Journal of
ELECTROCHEMICAL
SCIENCE
www.electrochemsci.org
Quantitative Analysis of Prazosin Hydrochloride in
Pharmaceutical Formulation by Prazosin Potentiometric Sensor
Based on Computational Investigation
Farnoush Faridbod,1* Mohammad Reza Ganjali,2,1 Bagher Larijani,1 Ensieh Nasli-Esfahani,2 Siavash Riahi,2,3Parviz Norouzi 2,1
1 Endocrinology & Metabolism Research Center, Tehran University of Medical Sciences, Tehran, Iran 2 Center of Excellence in Electrochemistry, Faculty of Chemistry, University of Tehran, Tehran, Iran 3 Institute of Petroleum Engineering, Faculty of Engineering, University of Tehran, Tehran, Iran *
E-mail: faridbodf@tums.ac.ir
Received: 8 April 2010 / Accepted: 15 May 2010 / Published: 30 May 2010
Prazosin belongs to the class of alpha-adrenergic blockers, which lower blood pressure by relaxing blood vessels. Based on computiational studies, Prazosin-tetraphenyl borate was selected as a suitable ion-pair reagent in making Prazosin potentiometric PVC membrane sensor. The wide linear range of 10-5-10-2 mol L-1, low detection limit of 6.3×10⁻⁶ mol L-1, and fast response time of ~16 s are characterizations of the proposed sensors. Validation of the method shows suitability of the sensor for application in the quality control analysis of Prazosin hydrochloride in pure and pharmaceutical formulation.
Keywords: Potentiometric sensor, Prazosin hydrochloride, PVC membrane, Computational Chemistry, Density functional based tight binding (DFTB), Chemometrics
1. INTRODUCTION
Many analytical techniques have been previously reported for Prazosin analysis in biological fluids and pharmaceutical formulations. For example, for determination of Prazosin in tissue culture medium for in vitro perfusion of human placental lobules, Prazosin was extracted by solid phase cartridges and the samples analyzed using high performance liquid chromatography (HPLC) [3]. For monitoring of prazosin in plasma a sensitive HPLC method using electrochemical detection was applied [4]. Özgür and Sungur reported a spectrophotometric method for determination of Prazosin hydrochloride in tablets [5]. Other methods reported for Prazosin analysis are modified carbon paste electrode with voltammetric technique [6], HPLC-fluorescence method [7], HPLC-MS [8].
Since, instrumental techniques are complicated and time consuming methods and involve sophisticated equipment that might not be available in most analytical laboratories; our research group introduces some electrochemical methods for fast monitoring of drug which are based on cyclic voltammetry, potentriometry and also chemometrics [9-17].
Potentiometric sensors have been used in analysisof some drugs in their formulations [18-25] due to their simplicity, rapidity, accuracy and cost-effectiveness over some instrumental methods like spectrophotometry and HPLC.
N
N O
O NH3
N
N
O O
[image:2.612.196.416.325.446.2]Cl
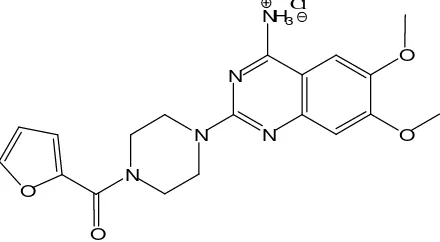
Figure 1. Chemical structure of Prazosin.HCl
Recently our group has widely used computational methods to evaluate selectivity of a sensor sensing materials by electronic properties [26-35]. The lack of work in this area is probably due to the inherent difficulties associated with doing calculations on a Drug-Ligand complex. Some of these problems include the lack of parameters for semi-empirical or empirical methods even though the numbers of atoms in typical drug complexes indicate the use of these lower level calculations would be appropriate.
2. EXPERIMENTAL PART
2.1. Computational methods
Calculations on the isolated molecules and molecular complexes were performed within GAUSSIAN 98 package [36].
Each species was initially optimized with PM3 method and, then the optimized structures were again optimized with density functional theory using the 6-31G* basis set. Full geometry optimizations and frequency calculations were performed and each species was found to be minima by having no negative values in the frequency calculation. The calculations gave internal energies at 0 K. In order to obtain gas phase free energies at 298.15 K, it is necessary to calculate the zero-point energies and thermal corrections together with entropies to convert the internal energies to Gibbs energies at 298.15 K [37, 38].
Frequency calculations on these structures verified that they were true minima and provided the necessary thermal corrections to calculate H (Enthalpy) and G (Gibbs free energy). Finally, full optimizations and frequency calculations for each species were performed with the DFT/6-31G* [39,40].
The other one-electron properties (dipole moment, polarizability, energies of the frontier molecular orbital) were also determined at the B3LYP/6-31G* level. For the charged species, the dipole moment was derived with respect to their mass center, because for the non-neutral molecules the calculated dipole moment depended on the origin of the coordinate system.
The stabilization energies of the selected complexes were determined with the help of DFT calculations and calculated with a recently introduced method, based on the combination of the approximate tight-binding DFTB with the empirical dispersion energy. The DFT methods are known to be inherently very deficient for stacking interactions, as they basically ignore the dispersion attraction [40-42]. As a consequence; their enlargement by an empirical dispersion term currently appears to be a very reasonable way to improve the major deficiency of the DFT method for the evaluation of the molecular complexes. It should also be mentioned that the interaction energies were obtained as the difference between the complex energy and the combined energies of the molecules in isolation [43].
2.2. Apparatus
The glass cell where Prazosin electrode was placed consisted of two Azar-Electrode Ag/AgCl reference electrode (Iran) as an internal and external reference electrodes. Both electrodes were connected to a Corning ion analyzer with a 250 pH/mV meter with ±0.1 mV precision.
2.3. The emf measurements
Ag–AgCl | internal solution (10-3 mol L-1 Prazosin.HCl) | PVC membrane | sample solution | Ag–AgCl, KC1 (satd.)
These measurements were preceded by the calibration of the electrode with several Prazosin hydrochloride solutions as working solutions.
2.4. Materials and Reagents
Prazosin hydrochloride and its tablet were obtained from local pharmaceutical factories in Iran. The analytical grade of chemical reagents, sodium tetraphenyl borate (NaTPB), potassium tetrakis-parachlorophenyl borate (KTpClPB), high-molecular weight polyvinylchloride (PVC), dibutyl phthalate (DBP), nitrophenyl octyl ether (NPOE), nitrobenzene (NB), tetrahydrofuran (THF), and the chloride and nitrate salts of the used cations were all purchased from Merck Chemical Co. All solutions were prepared using deionized distilled water.
2.5. Ion-pair Preparation
Ion-pair complex of Prazosin-tetraphenyl borate was prepared by mixing 20 mL of 0.01 mol L-1 solution of Prazosin hydrochloride with 20 mL of tetraphenyl borate solution (0.01 mol L-1) under stirring. Then, the resulting precipitate was filtered off, washed with water and dried in room temperature [21,34,35].
2.6. Preparation of the electrode
The general procedure to prepare the PVC membrane was as follow: Different amounts of the Prazosin-tetraphenyl borate ion-pair along with appropriate amounts of PVC, plasticizer and additive were dissolved in tetrahydrofuran (THF), and the solution was mixed well. The resulting mixture was transferred into a glass dish of 2 cm diameter. The solvent was evaporated slowly until an oily concentrated mixture was obtained. A Pyrex tube (3-5 mm o.d.) was dipped into the mixture for about 10 s so that a transparent membrane of about 0.3 mm thickness was formed. The tube was then pulled out from the mixture and kept at room temperature for about 10 h. The tube was then filled with an internal filling solution (1.0×10⁻³ mol L-1 Prazosin hydrochloride). The electrode was finally conditioned for 24 h by soaking in a 1.0×10⁻³ mol L-1 Prazosin hydrochloride solution [44-46].
2.6. Stock solution of Prazosin hydrochloride
3. RESULTS AND DISCUSSION
3.1. Computational Study
Molecular parameters are controlled by the molecular geometry; consequently geometry optimization is the most important step for the calculation of the interaction energy. The optimized geometries and numeration of the atoms of the studied molecules, Drug for Prazosin (Fig. 2), TPB for NaTPB (Fig. 3), PTK for KTpClPB, and Drug-TPB for Prazosin-TPB (Fig. 4) and Drug-PTK for Prazosin-TpClPB are presented.
To obtain a clue on PM tendency for TPB and PTK as potential ionophores, DFTB calculations (B3LYP/6-31G*) were carried out. The pair wise interaction energy ∆EA–B between molecules A (TPB
or PTK) and B (the drug) was estimated as the difference between the energy of the formed complex and the energies of the isolated partners. The interaction energies were corrected for the basis set superposition error using the counterpoise method [47,48].
∆EA–B = EA−B − EA − EB
which obtained to be -47.056 and -47.931 kcal/mol for ∆EPTK and ∆ETPB, respectively that indicates
[image:5.612.184.475.405.527.2]TPB is a more appropriate ionophore for Prazosin sensor in comparison to PTK, which is contributed to its higher interaction energy. Thus, the main discussions are going to be on Drug-TPB interaction afterward.
Figure 2. Full optimized structure of Prazosin
[image:6.612.211.457.292.490.2]
Figure 3. Full optimized structure of TPB
Figure 4. Full optimized structure of Prazosin-TPB complex
toward B atom in TPB, Since B atom of TPB molecule interacts with the nearest heteroatoms in the district, charge changes are not significant in other heteroatoms of Drug or TPB primary pairs. In this analysis, the effect of the TPB and drugcharges change is considerably higher. The changes of the Drug-TPB charge density is much more important than the Drug-PTK.
[image:7.612.112.504.261.667.2]High values of polarizability (160.606 and 170.64 for TPB and drug, respectively) prove its effect role on interactions among TPB and the drug. While the low values of dipole-dipole interactions (especially for that of TPB=0.0D and for drug 19.864D) show that it does not play a significant role between TPB and the studied drug. Moreover, since the studied molecules are in form of ions, electrostatic interactions should also be considered.
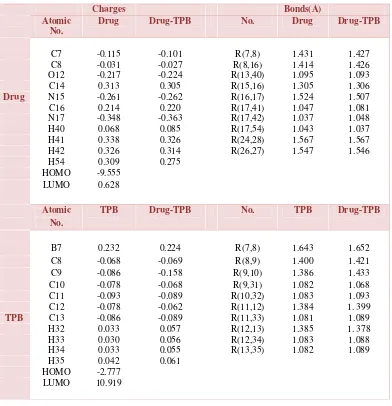
Table 1. Significant computed atomic charges and bond length for Prazosin and TPB before and after the complex formation
Charges Bonds(Å)
Atomic No.
Drug Drug-TPB No. Drug Drug-TPB
C7 -0.115 -0.101 R(7,8) 1.431 1.427 C8 -0.031 -0.027 R(8,16) 1.414 1.426 O12 -0.217 -0.224 R(13,40) 1.095 1.093 C14 0.313 0.305 R(15,16) 1.305 1.306
Drug N15 -0.261 -0.262 R(16,17) 1.524 1.507
C16 0.214 0.220 R(17,41) 1.047 1.081 N17 -0.348 -0.363 R(17,42) 1.037 1.048 H40 0.068 0.085 R(17,54) 1.043 1.037 H41 0.338 0.326 R(24,28) 1.567 1.567 H42 0.326 0.314 R(26,27) 1.547 1.546 H54 0.309 0.275
HOMO -9.555 LUMO 0.628
Atomic No.
TPB Drug-TPB No. TPB Drug-TPB
B7 0.232 0.224 R(7,8) 1.643 1.652 C8 -0.068 -0.069 R(8,9) 1.400 1.421 C9 -0.086 -0.158 R(9,10) 1.386 1.433 C10 -0.078 -0.068 R(9,31) 1.082 1.068 C11 -0.093 -0.089 R(10,32) 1.083 1.093 C12 -0.078 -0.062 R(11,12) 1.384 1. 399
TPB C13 -0.086 -0.089 R(11,33) 1.081 1.089 H32 0.033 0.057 R(12,13) 1.385 1. 378 H33 0.030 0.056 R(12,34) 1.083 1.088 H34 0.033 0.055 R(13,35) 1.082 1.089 H35 0.042 0.061
HOMO -2.777 LUMO 10.919
eigen values of LUMO and HOMO and their energy gap reflect the chemical activity of the molecule. LUMO as an electron acceptor represents the ability to obtain an electron, while HOMO as an electron donor represents the ability to donate an electron. From Table 1, the results illustrate that charge transfer interaction have between TPB and drug, because the HOMO energy of TPB close to LUMO energy of drug.
3.2. Nuclear magnetic resonance (NMR)
NMR spectroscopy is one of the principal techniques used to obtain physical, chemical, electronic and structural information about a molecule. The NMR chemical shift is a tensor quantity. The observed quantity depends on the relative orientation of the molecule with respect to the axis of the applied magnetic field. The expected chemical shifts for all the NMR active sitesshown in Table 2. For example N22 NMR shift change is seen from 212.243 to 243.558 ppm, H42 NMR shift change from 15.030 to 19.577 ppm, H54 from 138.276 to 141.473. Additional chemical shift data, although required for determining Drug-TPB assignments, were not used in the quantum-chemical structure determination. Accordingly, illustrated results of atom charges and bond lengths confirmed that NMR chemical shifts in the center of interactions in target molecule (Drug) and TPB displays the highest changes, these show that most dominate electrostatic interaction between the drug and TPB.
Table 2. Significant Computed nuclear magnetic resonance (NMR) database for Prazosin and TPB, before and after the complex formation
Atomic No. Drug TPB Drug-TPB
N22 212.243 - 243.558 H42 15.030 - 19.576 C23 159.805 - 164.425 H47 28.994 - 31.122 H42 138.276 - 141.476 H39 29.661 - 31.269 N12 153.433 - 148.461
N7 106.682 - 91.52 N8 4.757 - -12.26 B7 - 142.169 117.567 C4 - 91.638 38.877 C20 - 91.641 28.149 H41-H45 - 26.009-26.556 24.881-26.891
3.3. Membrane composition effect on potential response of the electrode
purpose, different membrane compositions are tested which the most important ones are shown in Table 3. As it can be seen from Table 3, the membrane with the composition of 30% PVC, 6% Prazosin-TPB, and 64% DBP (no. 3) showed the best potential response.
Prazosin extraction into the organic membrane was a result of ion-pair tendency to exchange with Prazosin cation from aqueous solution. From Table 3, 6 mg ion-pair (Prazosin-TPB) shows the best response. The second factor helps Prazosin extract from an aqueous solution to organic membrane is a plasticizer or solvent mediator. After testing three plasticizers, NB, NPOE and DBP, it was observed that they have not the same results if the optimum composition is used. DBP, with lower dielectric constant, shows better response than NPOE and NB. NB and NPOE have higher dielectric constant values than DBP, leading to extraction of the polar ions. It has a negative effect on the extraction of Prazosin ion which is a hydrophobic compound.
Table 3. Optimization of the membrane ingredients
3.4. Sensor properties
The properties of a potentiometric membrane sensor are characterized by parameters like measuring range, detection limit, response time, selectivity, lifetime, and accuracy [52-54].
The measuring range of a potentiometric membrane sensor includes the linear part of the calibration graph as shown in Fig. 5. The applicable measuring range of the proposed sensor is between 1×10⁻⁵ and 1×10⁻² mol L-1. By extrapolating the linear parts of the ion-selective calibration curve, the detection limit of an ion-selective electrode can be calculated. In this work the detection limit of the proposed membrane sensor was 6.3×10⁻⁶ mol L-1 which was calculated by extrapolating two segments of the calibration curve (Fig. 5). The slope of the calibration curve was 59.3±0.2 mV decade-1. The standard deviation of 10 replicate measurements is 0.2 mV decade-1. The potential drift of the sensor is 0.1 mV after 2 minutes.
Response time of an electrode is evaluated by measuring the average time required to achieve a potential within ±0.1 mV of the final steady-state potential, upon successive immersion of a series of
Membrane
no. (% wt.) PVC Prazosin-TPB (% wt.) Plasticizer (% wt.) Linear range (mol L-1) Response time (mV decadeSlope -1)
1 30 2 DBP, 68 8.0× 10⁻⁴ -5.0 × 10⁻³ 50.0±2.5 s 30.5±0.4
2 30 4 DBP, 66 4.5× 10⁻⁵ -1.0 × 10⁻² 32.0±2.0 s 51.2±0.5
3 30 6 DBP, 64 1.0× 10⁻⁵ -1.0 × 10⁻² 16.0±1.5 s 59.3±0.2
4 30 8 DBP, 62 3.5× 10⁻⁵ -1.0 × 10⁻² 25.0±2.0 s 54.3±0.3
5 30 6 NB, 64 5.5× 10⁻⁴ -3.0 × 10⁻² 43.0±3.0 s 21.7±0.2
6 30 6 NPOE, 64 1.0× 10⁻³ -1.0 × 10⁻² 1.2±0.2 min 17.7±0.3
7 30 6 (Prazosin-PTK) DBP, 64 5.0× 10⁻⁵ -5.0 × 10⁻² 33.0±2.5 s 52.3±0.4
[image:10.612.178.433.201.413.2]
interested ions, each having a ten-fold difference in concentration [50-52]. It is notable that the experimental conditions-like the stirring or flow rate, the ionic concentration and composition of the test solution, the concentration and composition of the solution to which the electrode was exposed before experiment measurement was performed, any previous usages or preconditioning of the electrode, and the testing temperature have an effort on the experimental response time of a sensor. In this work, 16.0±1.5 s response time was obtained for the proposed electrode when contacting different Prazosin solutions from 1.0×10⁻⁵ to 1.0×10⁻² mol L-1.
Figure 5. Calibration curve of Prazosin membrane sensor with membrane composition of no. 3; the results are based on 10 replicate measurements.
Selectivity of an ion-pair based membrane electrode depends on the physico-chemical characteristics of the ion-exchange process at the membrane interface, on the mobility of the respective ions in the membrane and on the hydrophobic interactions between the primary ion and the organic membrane [21]. Selectivity of Prazosin membrane electrode is related to the free energy of Prazosin cation transfer between aqueous and organic phases. The response of the electrode towards different substances has been checked and the selectivity coefficient values KABPot were used to evaluate the interference degree. The selectivity coefficient values were obtained using the matched potential method (MPM) [58,59].
In MPM method, a specified concentration of the primary ions (A, 10-2 mol L-1 of Prazosin solution) is added to a reference solution (10-5 mol L-1 of Prazosin solution), and then the potential is measured. Then, the interfering ions (B, 10-2 mol L-1) are consecutively added to the same reference solution, until the measured potential matches the one obtained before the addition of the primary ions. Then, selectivity coefficients, as defined by the matched potential method, KMPM, is equal to the ratio
of the resulting primary ion activity (concentration) to the interfering ion activity, KMPM = ∆aA/aB.
[image:11.612.213.403.156.306.2]
coefficient values, it was considered that the function of the Prazosin-selective membrane sensor would not be greatly disturbed.
Table 4. Selectivity coefficients of various interfering compound for Prazosin sensor
Interference Log KMPM
Na+ -3.24
K+ -3.52
Mg2+ -3.84
Ca2+ -3.76
Glucose -4.11
NH4+ -3.55
Lactose -4.31
CO32- -4.02
NO3- -3.41
Cl- -4.15
The average lifetime for most of the reported ion-selective sensors is in the range of 4–10 weeks. After this time the slope of the sensor will decrease, and the detection limit will increase. The sensors were tested for 7 weeks, during this time the electrodes were used extensively (one hour per day). The proposed sensors can be used for six weeks. After this time, there is a slight gradual decrease in the slopes (from 59.3 to 51.5 mV decade-1) and, an increase in the detection limit (from 6.3×10⁻⁶ mol L-1 to 4.1×10⁻⁴ mol L-1). It is well established that the loss of plasticizer, ionic site from the polymeric film due to leaching into the sample is a primary reason for the limited lifetimes of the sensors.
Literature survey reveals that there is only one report on Prazosin potentiometric sensor [60]. A comparison between the proposed Prazosin selective electrode and one reported in the literature, revealed some superiorities in terms of the easier ion-exchanger preparation, improved response time, lifetime, and sensitivity (a slope of 59.3 vs. 58.0 mV per decade).
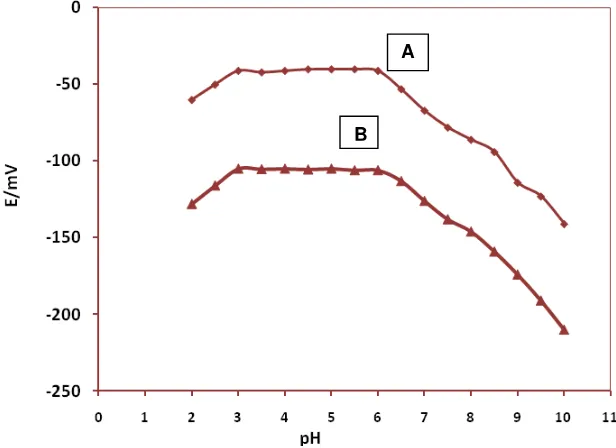
3.5. pHeffect on the electrode response
In an approach to understanding the impact of pH on the electrode response, the potential was measured at two particular concentrations of the Prazosin solution (1.0×10⁻³ and 1.0×10⁻⁴ mol L-1) from the pH value of 2 up to 10 (concentrated NaOH or HCl solutions were used for pH adjustment). As it can be seen from Fig. 5, the potential remained constant despite the pH changes in the range of 3.0 to 6.0, indicating the applicability of this electrode in the specific pH range. On the contrary, relatively noteworthy fluctuations in the potential vs. pH behavior took place below and above the
[image:12.612.166.474.131.355.2]
removing the positive charge on the drug molecule and the fluctuation below the pH value of 3.0 were attributed to the removing the ion-pair in the membrane.
Figure 6. pH effect of the test solutions (A:1.0×10⁻³ mol L-1; B: 1.0×10⁻⁴ mol L-1 ) on the potential response of Prazosin sensor with membrane composition of no. 3
3.6. Determination of Prazosin in pharmaceutical formulations
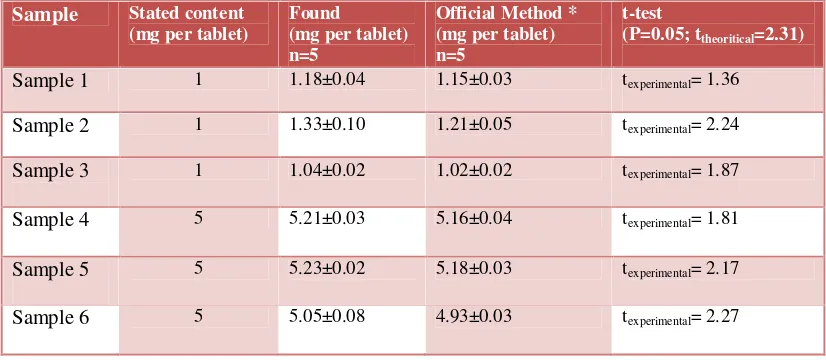
20 tablets of Prazosin were thoroughly milled and powdered. An appropriate amount of Prazosin tablet powder (10 mg) was carefully weighed and transferred into a 10-mL volumetric flask. The solution was then diluted to the mark with water and the proposed electrode determined Prazosin content by using the calibration method. The results for determination of Prazosin amount in some pharmaceutical samples from local pharmacy in Iran are shown in Table 5. As it is seen, the results are in satisfactory agreement with the stated content on tablets.
3.7. Method Validation
The linearity, limit of detection, precision, accuracy, and ruggedness/robustness were the parameters which were used for the method validation.
As mentioned before, the measuring range of the Prazosin sensor is between 1×10⁻⁵ and 1×10⁻² mol L-1. The detection limit of the sensor was calculated 6.3×10⁻⁶ mol L-1 (3 µg/mL).
The parameters of the repeatability and reproducibility were investigated in order to assess the precision of the technique. For the repeatability monitoring, 8 replicate standards samples 5, 50, 500 µg/mL were measured. Then, the mean concentrations were found to be 5.05, 52.1, 504.3 µg/mL and
A
[image:13.612.99.512.188.368.2]
with associated RSD values of 1.3, 0.9, and 0.65%, respectively. Regarding the inter-day precision, the same three concentrations were measured for 3 consecutive days, providing mean Prazosin concentrations of 5.07, 51.5, 505.7 µg/mL and associated RSD values of 1.21, 2.8, and 1.08%, respectively.
Table 5. Resultsof Prazosin HCl tablet assay by the Prazosin membrane sensor
*HPLC method
For determination of method accuracy four different tablets of Prazosin.HCl was analyzed with an official method (HPLC) and the proposed sensor. The results are shown in Table 5. At 95% confidence level the calculated t-value did not exceed the theoretical t-value indicating no significant difference between the four proposed methods and the reference method.
For ruggedness of the method a comparison was performed between the intra- and inter-day assay results for Prazosin obtained by two analysts.The RSD values for the intra- and inter-day assays of Prazosin in the cited formulations performed in the same laboratory by the two analysts did not exceed 3.23%. On the other hand, the robustness wasexamined while the parameter values (pH of the eluent and the laboratory temperature ) were being slightly changed. Prazosin recovery percentages were good under most conditions, not showing any significant change when the critical parameters were modified.
4. CONCLUSIONS
There is a growing need to make electrochemical sensors for fast and economical monitoring of pharmaceutical compounds in their formulations. In this work, types of interactions exist between a Prazosin compound and ion-pair reagents were studied by computational calculations. Since the studied molecules were in form of ions that resulted in ion pair formation, DFTB method which also considers dispersion energies in addition to those calculated using DFT was used for further
Sample Stated content (mg per tablet)
Found (mg per tablet) n=5
Official Method * (mg per tablet) n=5
t-test
(P=0.05; ttheoritical=2.31)
Sample 1 1 1.18±0.04 1.15±0.03 texperimental= 1.36
Sample 2 1 1.33±0.10 1.21±0.05 texperimental= 2.24
Sample 3 1 1.04±0.02 1.02±0.02 texperimental= 1.87
Sample 4 5 5.21±0.03 5.16±0.04 texperimental= 1.81
Sample 5 5 5.23±0.02 5.18±0.03 texperimental= 2.17
investigations. These computational methods help selecting appropriate ionophores and also predicting their selectivity for different drugs. After a series of experiments involving usage of Prazosin-TPB ion-pair complexes along with several plasticizers in the membrane design, it was concluded that Prazosin sensor exhibited excellent analytical performance characteristics. It demonstrated an advanced performance with a fast response time (~16 s), a lower detection limit (6.3×10⁻⁶ mol L-1) and pH independent potential responses across the range of 3.0–6.0. This sensitivity of the sensor enables Prazosin monitoring in pharmaceutical analysis.
ACKNOWLEDGEMENTS
The authors are grateful to the Research Council of University of Tehran for the financial support of this work.
References
1. A. C Moffat, M. D. Osselton, and B. Widdop, Clarke’s Analysis of Drugs and Poisons, Pharmaceutical Press (2005).
2. [Online] available: http://www.drugs.com/pro/prazosin.html
3. A. J. Fletcher, R. S. Addison, R. H. Mortimer, and G. R. Cannell, J. Liquid Chromatgr. Related Technol. 18 (1995) 2911.
4. A. Rathinavelu, and A. Malave, J. Chromatogr. B Biomed Appl. 670 (1995) 177. 5. M. Özgür and S. Sungur, Turk. J. Chem. 26 (2002) 691.
6. A. Arranz, S. Fernandez de Betono, C. Echevarria, J. M. Moreda, A. Cid, and J. F. Arranz Valentin, J. Pharm. Biomed. Anal. 21 (1999) 797.
7. T. M. Twomey, and D. C. Hobbs, J. Pharm. Sci. 67 (2006) 1468.
8. J. Lin, B. K. Zhang, and B. M. Chen, Chinese J. Pharm. Analysis 26 (2006) 621.
9. M. R. Ganjali, T. Razavi, F. Faridbod, S. Riahi, and P. Norouzi, Curr. Pharm. Anal. 5 (2009) 28.
10.F. Faridbod, M. R. Ganjali, R. Dinarvand, S. Riahi, P. Norouzi, M. B. A. Olia, J. Food Drug Anal.
17 (2009) 264.
11.S. Riahi, M. R. Ganjali, E. Pourbasheer, and P. Norouzi, Curr. Pharm. Anal. 3 (2007) 268. 12.P. Norouzi, M. R. Ganjali, B. Larijani, A. Mirabi-Semnakolaii, F. S. Mirnaghi, and A.
Mohammadi, Pharmazie 63 (2008) 633.
13.S. Riahi, M. R. Ganjali, E. Pourbasheer, F. Divsar, P. Norouzi, and M. Chaloosi, Curr. Pharm. Anal. 4 (2008) 231.
14.P. Norouzi, M. R. Ganjali, S. Shirvani-Arani, and A. Mohammad, J. Pharm. Sci. 96 (2007) 893. 15.F. Faridbod, M. R. Ganjali, L. Safaraliee, S. Riahi, M. Hosseini and P. Norouzi, Int. J.
Electrochem. Sci. 4 (2008) 1419.
16.M.R. Ganjali, P. Norouzi, R. Dinarvand, R. Farrokhi, and A.A. Moosavi-movahedi, Mater. Sci. Eng. C 28 (2008) 1311.
17.P. Norouzi, B. Larijani, M. Ezoddin and M. R. Ganjali, Mater. Sci. Eng. C 28(2008)87. 18.M. Shamsipur, F. Jalali, and S. Haghgoo, J. Pharm. Biomed. Anal. 27 (2002) 867.
19.K. G. Kumar, S. John, R. Poduval and P. Augustine, Chinese Pharm. J. 57 (2005) 29. 20.N. Alizadeh, R. Mehdipour, J. Pharm. Biomed. Anal. 30 (2002) 725.
21.M. R. Ganjali, A. Alipour, S. Riahi, B. Larijani, P. Norouzi, Int. J. Electrochem. Sci. 4 (2008) 1262.
22.Y. M. Issa, S. S. Badawy, and A. A. Mutair, Anal. Sci. 21 (2005) 1443. 23.A. Campiglio, Analyst 5 (1998) 1053.
25.M. R. Ganjali, T. Razavi, R. Dinarvand, S. Riahi and P. Norouzi, Int. J. Electrochem. Sci. 3 (2008)
1543.
26.S. Riahi, M. R. Ganjali, P. Norouzi and F. Jafari, Sens. Actuators B 132 (2008) 13.
27.H. Karami, M. F. Mousavi, M. Shamsipur and S. Riahi, J. Power Sources 154 (2006) 298. 28.M. R. Ganjali, M. Hariri, S. Riahi, P. Norouzi and M. Javaheri, Int. J. Electrochem. Sci. 4 (2009)
295.
29.S. Riahi, M. R. Ganjali, A. B. Moghaddam, P. Norouzi and S. S. Hosseiny Davarani, Spectrochim. Acta Part A70 (2008) 94.
30.S. Riahi, M. R. Ganjali and P. Norouzi, J. Theor. Comput. Chem. (JTCC),7 (2008) 317. 31.M. F. Mousavi, M. Shamsipur, S. Riahi, and M. S. Rahmanifar, Anal. Sci. 18 (2002) 137. 32.S. Riahi, M. F. Mousavi, M. Shamsipur, and H. Sharghi, Electroanalysis 15 (2003) 1561. 33.S. Riahi, E. Pourbasheer, M. R. Ganjali, and P. Norouzi, J. Hazard. Mater. 166 (2009) 853.
34.F. Faridbod, M. R. Ganjali, S. Labbafi, R. Dinarvand, S. Riahi, and P. Norouzi, Int. J. Electrochem. Sci. 4 (2009) 772.
35.M. R. Ganjali, B. Vesimohammadi, S. Riahi, and P. Norouzi, Int. J. Electrochem. Sci. 4 (2009) 740.
36.M. J. Frisch, G. W. Trucks, H. B. Schlegel, G. E. Scuseria, M. A. Robb, J. R. Cheeseman, and V. G. Zakrzewski, et al.,Gaussian Inc. Pittsburgh, PA (1998).
37.J. J. P. Stewart, J. Comp. Chem. 10 (1989) 221. 38.W. Yang and Q. Wu, Phys. Rev. Lett. (2002)
39.R. G. Parr and W. Yang, Annu Rev. Phys. Chem.46 (1995) 701.
40.F. B. Duijneveldt, R. J. G. C. M. Duijneveldt-van de and J. H. Lenthe, Chem. Rev.,94 (1994) 1873. 41.T. A. Nieaus, M. Elstner, T. Frauenheim and S. Suhai, J. Mol. Struct. (THEOCHEM) 541 (2001)
185.
42.H. Y. Zhou, E. Tajkhorshid, T. Frauenheim, S. Suhai and M. Elstner, Chem. Phys. 277 (2002) 91.
43.P. Hobza and R. Zahradnik, Intermolecular Complexes, Elsevier, Amsterdam(1988).
44.M. R. Ganjali, P. Norouzi, F. S. Mirnaghi, S. Riahi and F. Faridbod, IEEE Sens. J. 7 (2007) 1138.
45.M. R. Ganjali, H. Shams, F. Faridbod, L. Hajiaghababaei, P. Norouzi, Mater. Sci. Eng. C 29 (2009) 1380.
46.M. R. Ganjali, P. Norouzi, A. Atrian, F. Faridbod, S. Meghdadi, and M. Giahi, Mater. Sci. Eng. C
29 (2009) 205.
47.M. J. Frisch, J. E. Del Bene, J. S. Binkley and H. F. Schaefer, J. Chem. Phys. 84 (1986)2279 . 48.D. W. Schwenke and D. G. Truhlar, J. Chem. Phys. 82 (1985) 2418.
49.M. R. Ganjali, P. Norouzi, F. Faridbod, S. Riahi, J. Ravanshad, J. Tashkhourian, M. Salavati-Niasari and M. Javaheri, IEEE Sens. J., 7 (2007) 544.
50.F. Faridbod, M. R. Ganjali, R. Dinarvand, P. Norouzi and S. Riahi, Sensors, 8 (2008) 1645.
51.S. Riahi, F. Faridbod, and M. R. Ganjali, Sensor Lett., 7 (2009) 42.
52.F. Faridbod, M. R. Ganjali, R. Dinarvand, P. Norouzi and S. Riahi, Sensors 8 (2008) 1645.
53.V. K. Gupta, A. K. Jain and G. Maheshwari, Int. J. Electrochem. Sci. 2 (2007) 102.
54.M. R. Ganjali, R. Nemati, F. Faridbod, P. Norouzi, and F. Darviche, Int. J. Electrochem. Sci. 3
(2008) 1288.
55.V. K. Gupta, R. N. Goyal and R. A. Sharma, Int. J. Electrochem. Sci. 4 (2009) 156.
56.V. K. Gupta, M. Al Hayat, A. K. Singh and M. K. Pal, Anal Chim Acta 634 (2009) 36. 57.R. K. Mahajan and P. Sood, Int. J. Electrochem. Sci. 2 (2007) 832.
58.V. K. Gupta, S. Chandra, S. Agarwal and H. Lang, Sens. Actuators B, 107 (2005) 762
59.P. R. Buck and E. Lindneri, Pure Appl. Chem. 66 (1994) 2527.
60.S. Khalil, A. Kelzieh, S.A. Ibrahim, J. Pharm. Biomed. Anal. 33 (2003) 825.