eurostat
EUROPEANCOMMISSION
STATISTICS E U R O P E
ECONOMIC ACCOUNTS
OF THE
EUROPEAN UNION
1996
THE ECONOMIC ACCOUNTS
OF THE EUROPEAN UNION
A great deal of additional information on the European Union is available on the Internet. It can be accessed through the Europa server (http://europa.eu.int).
Cataloguing data can be found at the end of this publication.
Luxembourg: Office for Official Publications of the European Communities, 1997 ISBN 92-828-1881-0
© European Communities, 1997
Reproduction is authorised provided the source is acknowledged.
This publication on the Economic Accounts of the European Union for the year 1996 has been realised by the Eurostat Unit "Economic accounts and international markets; production and
analysis". It is the result of cooperation between Eurostat and the National Statistical Institutes of
the Member States.
The section on exchange rates and interest rates has been drafted by the Eurostat Unit "Accounts and financial indicators, statistics for the excessive deficits procedure" and the chapter on Gross domestic product and unemployment rates in the regions of the European Union by the Unit "Regional indicators and accounts, population and geographical information system".
The contributors from the Statistical Institutes of the Member States are Lucia Aiello from ISTAT (Italy) for the section "Economic cycle and global demand", Adrian Richards from the ONS (United Kingdom) for the "Private households as a receiver of income and as a saver" and Gert Buiten from the CBS (the Netherlands) for the part "Labour market in the Union".
The desktop publishing was carried out by Cindy Brockly and Sandrine Peton. Manuscript completed in September 1997.
For further information and for any sugges- Data requests should be addressed to: tions, please contact: ^ S H Q p L U X E M B 0 U R Q
Marco De March, Head of the Unit 2, Rue Jean Engling "Economic accounts and international mar- L-1466 Luxembourg kets; production and analysis" Tel. +352 4335-22 51 Bâtiment Jean Monnet Fax +352 4335-22 221
L-2920 Luxembourg Internet: AgnesN@eurostat.datashop.lu Tel.+352 4301-33207
Fax +352 4301-33879
PREFACE
This publication on the Economie Accounts of the European Union is the result of cooperation between Eurostat and the Statistical Institutes of the Member States. It thus represents one of the first milestones on the road to collaborative development of the European Statistical System (ESS), which involves the National Statistical Institutes of the Member States and Eurostat.
The logo of the European Statistical System reproduced on the cover page should symbolize the common efforts of the National Institutes and Eurostat to provide the European Union with statistical information of a high quality.
Beyond the work on the production of data and on the development of the statistical standards, the cooperation between Eurostat and the National Statistical Institutes should, with this document, open a new era of a more active and visible partnership before a wider audience.
This report, which was issued for the first time in 1996, involves the collaboration of various
National Statistical Institutes alternately. For this year's edition, Eurostat was joined by the statistical Institutes of Italy (ISTAT), the Netherlands (CBS) and the United Kingdom (ONS).
Compared with the economical analyses and forecasts made by other services of the European Commission, this report provides a descriptive analysis of the facts only.
Eurostat believes that by presenting and commenting in one single volume the main macroeconomic data of the Union and the Member States, this publication will render this data more accessible to users and will s i g n i f i c a n t l y c o n t r i b u t e to a better understanding of the economic phenomena of our time.
Any suggestions concerning improvement to the content or presentation of this publication will be most welcome and seriously taken into consideration.
Y. Franchet
Director general
C O N T E N T S
Introduction 7
I Main macro-economic data of the European Union 11
1.1 Economic growth in the international framework 13
1.2 Economy of the Union 15
1.2.1 Gross domestic product 15 1.2.2 Economic cycle 18 1.2.3 Global demand 23 1.2.4 External trade 26 1.2.5 Distribution of GDP, disposable income, saving and net lending/borrowing 36
1.3 Economy by branch in the Union 38
1.3.1 Gross value added and productivity 38
1.3.2 Employment 42 1.3.3 Compensation of employees 44
1.4 Private households in the Union 46
1.4.1 Private households as consumers 46 1.4.2 Private households as receivers of income 50
1.4.3 Private households as savers 53
1.5 General government in the Union 54
1.5.1 General government revenues and expenditures 54
1.6 Labour market in the Union 64
1.6.1 Population 64
1.6.2 Employment 66
1.6.3 Unemployment 69
1.7 Prices, conversion rates and interest rates in the Union 71
1.7.1 Consumer prices 71
1.7.2 Exchange rates and the ECU 74
1.7.3 Purchasing power parities 77
1.7.4 Interest rates 82
II Gross domestic product and unemployment rates In the 85
regions of the European Union
11.1 GDP and unemployment rates as strutural policy indicators 87
11.2 Current situation in the regions of the Union 89
11.3 Changes over time in the regions of the Union 95
INTRODUCTION
Features of the report
As with similar publications produced by cer-tain statistical institutes at national level, as for example in France, Italy, Luxembourg, the Netherlands and the United Kingdom, this document is designed to set out in a single volume wide-ranging macroeconomic data on the European Union and the Member States and to provide statistical analysis of those data. Along with business cycle effects, a study of structural differences between Member States and their developments will be made.
Although the statistical analysis makes refer-ence to specific national situations, its purpose is to draw a profile of the Union, comparing it, where possible, with its main trading partners.
In addition to the comments on the main eco-nomic variables, which will be a permanent feature, the report will contain a topical study which will vary from year to year. This year's subject concerns the treatment of Gross do-mestic product and unemployment in the re-gions of the European Union.
The present publication focuses on 1996, while also giving a broader view for retrospective series. In an age where up-to-the-minute infor-mation is crucial to our understanding of socio-e c o n o m i c p h socio-e n o m socio-e n a , it may ssocio-esocio-em inappropriate to publish and comment on rela-tively old data.
However, these data have certain advantages:
— they have been compiled on the basis of uniform definitions and methodologies -those used in the ESA (second edition, 1979);
— the data used have been largely obtained from the National Statistical Offices, the very bodies which, partly together with Eurostat, analyse them in this publication; — a knowledge of recent trends helps to
teach much about the present.
One of the major problems arising concerned data availability for all the countries at the time
of drafting the report. Furthermore, for many variables, certain countries do not transmit any data, or this data is available with a delay of one or more years compared with the refer-ence year.
It should also be mentioned that revisions of data by the National Institutes take place at different points in time; for this reason, the data available at the deadline for this report and used therein may not correspond to the latest data now available for certain countries.
Main results
Following the downturn in economic growth in the industrialised countries in 1995, economic activity worldwide recovered in 1996.
The European Union failed to match these rates, however, and growth slumped again from +2.4% in 1995 to only +1.7% in 1996. The Member States' growth rates range from +8.6% in Ireland to +0.7% in Italy.
The United States and Japan recorded, for 1996, high growth rates of +2.4% and +3.6% respectively as against +2.0% and a mere +0.9% in 1995.
As for the components of the Union's GDP, in the wake of the meagre increases of the last two years, private consumption increased by 2.0%, while gross fixed capital growth rate was falling to +1.1% and collective consumption remaind stable at +0.6%.
Imports rose by 3.7% and exports by 4.5%. The trade surplus thus grew from 1.6% of GDP in 1995 to 2.0% in 1996.
Introduction
3 2
Per capita GDP in purchasing power stand-ards (PPS) reveals substantial discrepancies between the countries, although these are con-siderably less than when the data are ex-pressed in ECU.
At 30 520 PPS, Luxembourg's per capita GDP in purchasing power standards is highest, out-stripping even the United States' (26 870 PPS). Of the potential future Member States, Slovenia, with 10 199 PPS, and the Czech Republic, with 9 857 PPS, can boast the best results.
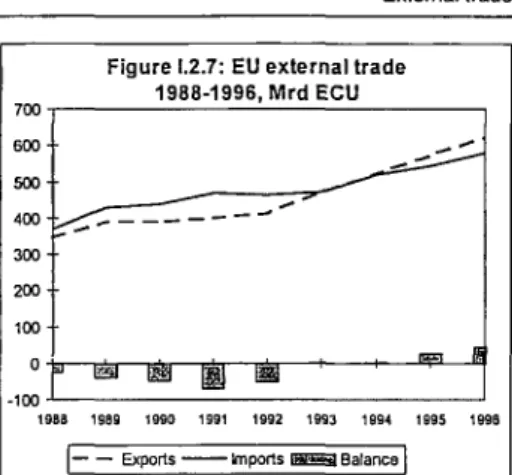
Economic activity in the Union in 1996 was sustained by external demand from third countries, and the Union's trade surplus with the rest of the world rose to ECU 43.4 Mrd, from ECU 27.4 Mrd in 1995.
In 1996, the European Union considerably im-proved its trading position over its main part-ners, like the USA and Japan. On the other hand, the structural trade deficit with China increased again to reach 34.3% of the total trade flows with this country.
Of the Member States, Germany recorded the greatest extra-EU surplus (ECU 32.6 Mrd) fol-lowed by Italy (ECU 24.7 Mrd) and France (ECU 16.4 Mrd), while the Netherlands and the United Kingdom incurred the largest deficits (ECU 27.2 Mrd and ECU 17.4 Mrd respec-tively).
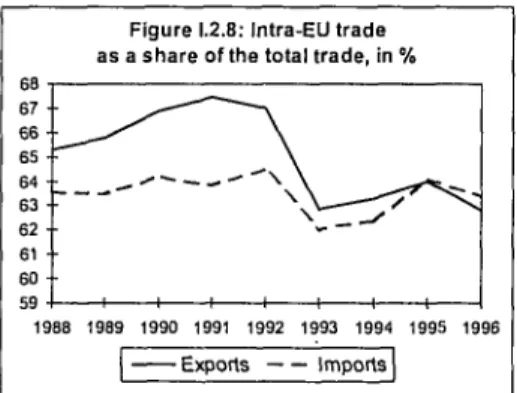
Intra-EU trade varies greatly from one Member State to another. Whereas the relatively small Member States show the highest percentages, Germany and the United Kingdom, more pre-sent on the world market, recorded the lowest rates of intra-EU trade.
Looking at the distribution of GDP, compensa-tion of employees accounts for more than one-half of the Union's GDP, although this proportion has been waning since 1980. The net operating surplus represents roughly one-quarter of GDP.
Real gross value added of the Union grew by 2.5% in 1995. By branch, Market services recorded the highest figure (+3.2%), but the Non-market services had a lower rate (+0.6%) and the total growth in Services was only of
+2.6%. Concerning employment by branch in the Union, Market services showed the high-est growth rate (+1.6%), while Manufactured products activity decreased (-0.5%).
In 1995, Services represented the main branch in the economy (64.8% of total value added), followed by Manufactured products (22.4%). Over the last 10 years, Services in-creased their importance in the economy of the Union by 3 percentage points. Shifts toward Services came homogeneously from all branches.
Concerning productivity by branch, defined in terms of value added by occupied person, in 1995, Fuel and power products showed by far the highest figure, followed by Services. Com-parison over 10 years period shows that only Services increased their productivity (+1.1 per-centage point).
Within private consumption of household, Gross rent, fuel and power represented for the Union in 1995 the main function of households consumption with a share of 19.8% of total consumption, followed by Food, drinks and tobacco (18.2%). Over 10 years, Gross rent fuel and power, Health services, Transport and communication and Other goods and services increased their share, roughly in the same proportion of 1.5 percentage points, other func-tions shrank and especially Food, drinks and tobacco reduced sharply its importance by 4.1 percentage points.
Private consumption per head shows, with 17103 PPS, the highest figure for Luxembourg in 1996. Considerable divergence persisted among Member States' figures, ranging from 34 points below the Union's average for Portu-gal to 52 percentage points above the Union's figure for Luxembourg, with a difference of some 87 percentage points.
av-IWiï
Introductionerage by far. Current transfers to households represented nearly 46% of public spending in 1995 (as against 40.7% in 1990), and the trend was clearly upwards.
Government receipts from taxes and social security contributions for the Union as a whole rose by 0.4 point to 42.4% of GDP in 1996. Taxes accounted for 64% and social security contributions for around 36%. The levy rates which were far above this average were in Sweden (55.2%), Denmark (52.0%), Finland (48.8%) and Belgium (47.0% of GDP).
In 1996, every Member State except Luxem-bourg faced public sector deficits, ranging from 0.4% in Ireland to 7.6% in Greece, although the general trend was for these to decline. On the other hand, seven Member States' national debts in 1996 were up on the previous year. Belgium (126.9% of GDP, Italy (123.8%) and Greece (112.7%) recorded the greatest public debts, while Luxembourg's 6.6% of GDP was the lowest.
In 1996, the labour market in the Union re-corded a modest growth in the number of peo-ple employed (+0.3%). The services sector still employed the majority of work force (64.5%). Since the beginning of 1990's employment in services increased its importance by more than 4 percentage points. Shifts came essen-tially from industry ( -2.8 percentage points) while agriculture played a less important role (-1.5 percentage points).
After the good resuit in 1995 (-3.1%), unem-ployment in the Union rose again in 1996 by +2.1 %. Within the Union, sharp increases took place especially in Germany, France, Austria and Sweden, with growth rates of more than 7%. The Union's unemployment rate rose from 10.8% to 10.9%, in 1996.
Even if the share of young people in total unemployment fell sharply since 1990, in 1996 more than a quarter of the unemployment in the Union consisted of young people between 15-24 years (26.3%). The proportion of women in the total number of jobless was of 48.6.
Substantial progress was made in holding down consumer prices in the Union, and in-flation rates have slowed consistently since the
early 1990s. In 1996, inflation, measured by harmonised consumer price indices, declined to +2.4%, as against +0.1% in Japan and +2.9% in the United States. This progress does, however, mask considerable discrepan-cies between Member States, with rates rang-ing from +0.8% for Sweden and +4.0% for Italy, Greece having a figure of +7.9%.
On the exchange markets in 1996, seven currencies rose against the ECU, by around 1 % (the French franc, the Portuguese escudo and the Spanish peseta) and by as much as 7% (Swedish krona). All the other currencies depreciated, however, by 0.5% in the case of the Danish krone and by more than 2% for the Belgian/Luxembourg franc, German mark, Dutch guilder and the Austrian schilling.
Government bond prices reached peak levels in most Member States in January 1996. These good performances were sustained throughout the year, and a degree of conver-gence was observed in both short- and long-term interest rates.
Gross domestic product per head and unem-ployment rate in the regions of the European Union are crucial indicators for European structural policies. An analysis of these indica-tors shows that there are still substantial differ-ences, both from one Member State to another and within some of the Member States.
In 1994, GDP at national level was relatively close to the Union's average for 11 of the 15 Member States, but, considering regional GDP per head, differences were much broader. Considering mean deviation as an indicator of the size of regional disparity from national fi-gures, it is possible to distinguish two groups of countries. The Netherlands, Greece, Swe-den and the United Kingdom with rather low values (between 9% and 12%), while the other countries have a mean deviation ranging from 16% (in Finland) to 22% (in Italy).
In 1996, regional unemployment rates varied from 3.2% in Luxembourg to 32.4% in Andalu-sia and mean deviation indicator shows re-markable differences among regions.
uni-Introduction
MAIN MACRO-ECONOMIC DATA OF THE
m
The international framework1.1. Economie growth in the international framework
Following the slowdown in growth, which marked the industrialised countries in 1995, the year 1996 is characterised by a recovery in the main international economic areas. In deed, while all these areas recorded major drops in 1995, table 1.1.1 shows an increase of GDP in volume of 2.5% for OECD, 2.3% for the BIG7 countries, 2.6% for NAFTA and 3.9% for OCEANIA.
This rise in growth rates is not borne out in the European Union; rates flagged compared to the two previous years (+2.9% in 1994, +2.4% in 1995 and only +1.7% in 1996).
[image:17.595.308.481.318.521.2]The same trend is observed in Canada: +4.1% in 1994, +2.3% in 1995 and +1.4% in 1996.
Figure 1.1.1 : Volume indices of GDP, 1990=100
1985 1936 1987 1988 1989 1990 1991 1992 1993 1994 1995 1996
Source : Eurostat
Among the main economic partners of the Un ion, the United States which had a significant drop in 1995 (+2.0% compared to + 4 . 1 % in 1994), display a growth rate of 2.4% in 1996.
In Japan, the modest growth which began in 1992 and continued with a quasistagnation in 1993, returned to a slight recovery in 1995 (+0.9%). This trend is confirmed in 1996 by a high growth rate increase (+3.6%).
Furthermore, it should be pointed out that the high growth rates of groupings of countries such as NIC 1 (newly industrialised countries of the first wave of industrialisation) and NIC 2 (newly industrialised countries of the second wave of industrialisation), which were ob served during the last few years (+7.7% and
+8.0% respectively in 1994 and +7.4% and + 8 . 1 % respectively in 1995) slightly de creased. However, 1996 growth rates of +6.4% for NIC 1 and +6.8% for NIC 2 are still very high.
In China, a slowdown in growth may be also observed; it slipped from +13.5% in 1993 to +9.2% in 1996. The same trend is observed, although to a lesser extent, in India.
Finally, the spectacular reversal of trend in Mexico should be highlighted; rates rose from 6.2% in 1995 to + 5 . 1 % in 1996 (see table 1.1.1).
Table l.1;1 EUR15(1| OECD(1) Canada USA ..:., Japan BIG7(1) Mexico NAFTA.... OCEANIA NIC1 NIC2 China .... India
.'.■'■■■■'. ;' International comparison.of growth ..i;: ;' : rates of GBP at constant prices. In % i 1991)
2.9 _.2.β.:·
■0.3 ._.1.2..
5.1 2.4. 4.5 ....1.3...
1.0 8.0. 8.6 ...3.B..
5 7 1991
1.5 ...1.Ο..
•1.8 ._.0,5...
4.0 .0.9 3.S :...0.3_
0.2 ...5.5 .
6.2 9.2... 0 4
;1992 0.9 ..:1·.7...
0.8 _.2.5..;
1.1
..i.e :
2.8 ...2.4_.
2.3 ¿5.8 ..
6.2 ..14.2..
5 4 1993 •0.5 ...1.:4.:
2.3 . .3.4. :
0.1 ..1.4...
0.6 _.3..1„
2.9 _ . 6 . 3 . .
6.9 ...13.5.
4 8 1994
2.9 2.9 4.1 _ A . 1 . . .
0.5 . 3 . 0 ,
3.5 _ . . . 4 . 0 _ 5.1 ...7.7.
8,0 . 1 2 . 7 .
7.6 1995
2.4 .1.8 2.3 .L2.0._" _ 0 . 9 . .
..1.9 ·. • 6 2 ....1.4...
2.1 .7.4 .
8,1 . 1 0 . 6 .
7 3 •1996
1.7 '„•2.5.:.
1.4 :.2V4..:
3.6 .. 2.3 ..
5.1 . . . 2 . 6 . .
3.9 ...6.4..
6.8 .λ 9.2
(1 ) new German Lander included starting from 1992
NAFTA : USA, Canada, Mexico
NIC 1 : Newly industrialised countries, (Singapore, Taiwan, Hong Kong, South Korea)
NIC 2 : Newly industrialised countries of the sec ond wave of industrialisation (Philippines, Malaysia, Thailand)
OCEANIA : New Zealand, Australia
Sources : Eurostat, OECD and national sources
Among Member States, Ireland displayed the highest growth rate (+8.6%), as was the case in the lastthree years, followed by Luxembourg (+3.6%) and Finland (+3.3%). It should be noted that, in comparison to the previous year, Ireland and Finland faced a slowdown in their rate of growth, while Luxembourg increased slightly (see table 1.1.2).
[image:17.595.110.288.334.490.2]The international framework
L^
T a b l e . l · : I.Ï.2 Β
DK " S R
D
IRL L A
p.::'iV.s¿:? FIN
liH2¡
UK EURI 5(1) A n n u a l growth r a t e s o f GDP, * 'constant prices"of Ì 9 9 0 . In % ' •1990
3.0
¡SÌA".
5.7
i':?.·0.·.,
3.7
M l l es Ϋ:2.2. ·
2.2
":SÍ-4.6 ΐ>Ε£§ '
0.0 ^ 1 . 4 . "
0.4 : 2.9
1991 -. 1.6
Τί"3;'
5.0 .-3,0_.
2.3
'¿p.e..
2.4
ΤΙΤΤΛ7 6.1 3.4 ~r3~3 ·'
•7.1
_..k1.i 2.0
' . " Í : 5 '
.1992 1.5 2.2
.'.¡SAZ
0.7
'
1ill
4.S
aÆL·
4.5
ι.
2:**-':
1.3
gSXaS
•3.6
0.5
■ 0Ϊ9 · '1993
-1.5 ~ ~ Í 5 . "
1.1 0.2 1.2 "1..3 '
3~6~
Τί·1·.2" 8.7
0.5
Τι.2
»mu
" 2 . 1 ~ -0.5"
.1994 2.4
ΙϋίΓ
~ 2 . 9ϊϋ§2
2.1 ' * 2 J '
7.6
4.2 ' 3.4
2.3
4 5
lì?.:3 3.9
« 2 . 9 ?
1995 2.1
;J.6_
" 1.9 " 2.8 •;.2._1^
11.1
:i?£
3.8
_2.r ~i.s" Li?.."
5.1 ,3~6 ;
2 5
~¿4:'
1996 1.5 1.4
J2TJ.
2.2~ ■ '1.5 '
8.6
...q'ïl·
3.6 2 6 ' .
1.0 3.3 1.1 2.1
':Ί . 7 ' "
(1) new German Länder included starting from
1992 Source : Eurostat
Regarding the Candidate Countries for the accession, to the European Union (CC), data for the' year 1996 are not yet available. Thus, the following analysis will be restricted to the year 1995.
Figure 1.1.2: Growth rates of GDP, 1996, in%
0 1 2 3 5 9 7 6
Table 1.1.3 shows that in 1995, the Candidate Countries have a fairly sustained economic growth at a higher level than that of the Euro pean Union for the third year running. How ever, the rates vary from country to country.
T a b l e , "
1.1.3
Bulaaria
Czech RebubUc^W'".* Cyprus
Estonia ■ Hungary
Latvia ;
Lithuania Poland ':
Romania Slovak Republic Slovenia Total C C '
Annual GDP.growth ratesjn the CC. bflces:of 1990. In %
1990
: Ì2
7.4
K2'.9
5.6 1991 11.5 0.6 13.6 ^10.4 ■7.0 12.9 ' Í 4 . 8 8.9
1992 7.3 3:3 9.3 •14.2 3.1 34:9
''■•'Ϊ.6 -8.8 -6.5 -5.5
' 1 9 9 3 -1.5
y>ó.e
0.4
ίΐ.έ
-0.6 '-ΐ:4.9 -30.4
^••3.8 1.5 '•"'-3·9 2.8 1.0
' 1 9 9 4 1.8
¡ftrjfîi
6.3
■'iï Ve
2.9 " 0.8 1.0 5.2 3.9
5 Ó
5.3 4.0
1995 2.1
'·!4.ί
5.8 i ·;4.3 1.5 -0.8 3.0 7.0 7.1
'•'"ftÖ
4.1 5.2
Source : Eurostat
Source : Eurostat
The large majority of Candidate Countries saw a growth rate for 1995 which was higher than that of the European Union (+2.4%).The only countries where the growth rate was below this average were Bulgaria, Hungary and Latvia, the last two also experienced a fall in growth compared with 1994. In addition, Latvia, where growth had resumed in 1994 to achieve the first positive rate since 1991, again showed a nega-tive rate of -0.8%.
On the other hand, four Candidate Countries -Romania, The Slovak Republic, Poland and Cyprus - had a 1995 growth rate which was higher than the average for the Candidate Countries (+5.2 %).
Ε1Ξ
Gross domestic product1.2. Economy of the Union
1.2.1. Gross domestic product
GDP in absolute value
In 1996, the GDP of the Union as a whole worked out at 6 764.1 Mrd ECU compared with 5 966.6 Mrd ECU for the USA and 3 623.6 Mrd ECU for Japan.
The share of the GDP of the Union (in PPS) in the worldGDP, was in 1995 of 23.3% and the share of the USA 20.6%. The share of Japan was 7.7% while Canada held 1.8%, Mexico 2 . 1 % and the Central Eastern European Coun tries 2.3%.
Within the Union, Germany had the highest GDP (1 854.4 Mrd ECU), representing 27.4% of the GDP of EUR 15.
Four EUeconomies (Germany, France, Italy and the United Kingdom) accounted for nearly 73% of the total GDP of the Union, while at the other end of the scale the five countries (Greece, Ireland, Luxembourg, Portugal and Finland) contributed only about 5 . 1 % to the total GDP of the Union.
Concerning the per capita data, it is Luxem bourg which has in 1996 the highest level (33 280 ECU) while Portugal, with 8 270 ECU falls below the Union's average (18 070 ECU)
Table 1.2.1 Β DK '■·.. D EL E F IRL I ·: L NS . ; .
A P ' FIN S UK EUR15 USA JPN
GOP at current prices and exchange rates, In Mrd E C U
1990 152.6 .101.7 1 182.2 65.3 387.5 ' 9 4 1 . 5 35.9 861.2 8.1 223.4 124.7 53.1 106.2 180.8 772.0 5 196.3 4 510.5 2 341.5
1991 160.6 104.7 1 391.5
.72 1 427.6 971.7 37.5 931.1 8.8 234.8 133.5 ...', 81.8 98.1 193.5 821.2 5 648.4 4 774.8 2 752.7
1992 171.7 109.6 1 522.3 _ 75.6 446.0 1 022.1 40.4 941.7 9.8 248.9 144.0
: 71.1 82.1 191.4 811.9 5 888.6 4 810.4 2 868.5
1993 180.8 .115.1 1 630.9
_...71·6
408.6 1 066.8 41.5 842.0 11.0 267,3 155.9 S9.9 72.0 158.5 808.8 5 907.9 5 596.0 3 652.6
1994 193.6 .122.7 1 725.3 _ 82.5 407.1 1 122.6 45.4 855,7 12.3 284.0 167.1 .71.3 82.5 : 167.1 860.5 6 199.8 5 830.7 3 950.3
1995 205.9 132.1 1 845.2 _._.87.4 428.1 1174.3 49.2 831.4 13.3 . 302.5 178.4 77.1 95.6 176.3 844.8 6 441.5 5 545.7 3 9 2 5 . 9
1996 208.5 137.3 1 854.4 ....S6.8 458.2 1211.4 55.3 956.4 13.8 309.3 179.8 82.2 97.7 197.1 905.9 6 764.1 5 966.6 3 623.6
(see table 1.2.1 and I.2.2) (A more detailed analysis of GDP per head, in particular in PPS, is given in section I.7.3).
Table I.2.2 Β DK O EL . E F IRL I L NL A Ρ FIN S UK EURI 5 USA JPN 1990 15 320 ..19 790 18 690 6 420 9 970 16 590 10 240 14 930 2 1 3 4 0 14 950 16 140 5 370 21 290 21 130 13 410 14 870 18 050 18 950
. 1 9 9 1 16 060 20 310 17 400 7 030 10 990 17 030 10 630 16 110 22 790 15 580 17 090 6 260 19 570 22 460 14210 1.5.380 18 900 22 210
■ 1992 17 100 21200 18 890 .. 7 330 1 1 4 3 0 17 810 11 380 16 270 24 850 16 390 18 200 7 210 16 280 22 080 14 000 15 960 18 830 .23 080
:. 1993 17 930 22 190 20 090 7.570 10 450 .18,500 1 1 6 5 0 14 490 27 580 17 480 19 510 . 7 070 14 220 18 180 13 900 15 930 21 670 29 310
1994 19 140 23 580 21 190 . 7 910 10 400 19 390 12 720 14 690 30 450 18 470 20 810 7 200 16 220 1 9 0 3 0 14 740 16 670 22 340 31 640
1995 20 310 25 260 22 600 8 360 10 920 .20.200 13 740 14 250 32 370 .19 570 2 2 1 8 0 . 7 770 18 720 18 970 1 4 4 1 0 17 260 21 030 31 340
1996 20 500 2 6 1 4 0 22 640 9 210 1 1 6 7 0 20 780 15 350 16 360 33 280 1 9 920 22 260 " 8 270 1 9 0 7 0 '22 280 15 400 18 070 22 420 28 890
Source : Eurostat
Source : Eurostat
Main components of GDP — Evolution and structure
Values of the main aggregates of GDP are presented for the years 1990 to 1996 in table I.2.3.
Table I.2.4 shows, for the same period, the evolution of the main aggregates of the Union, the United States and Japan and also within the Union itself on the basis of the average annual growth rates.
The figures show that the GDP growth ob served between 1990 and 1996 in the Union and Japan is mainly due to the vigorous expan sion of final consumption.
Contrary to Japan and within the Union, where the levels of growth of private and public con sumption expenditure are fairly close, the USA show a large contrast between these two fig ures, in excess of two percentage points.
Gross domestic product
L^
Table I.2.3" Β D K 0 E L ' . " E F . . . I R L L l J üL NL;,.'.. A
ρ ;".■ F I N S U K EURtS U S A J P N
Main c o m p o n e n t s o f G D P at current prices and e x c h a n g e rates, in Mrd E C U Private Consumption:«>;.*K';
:<:1990 S5.B sze 716.4 47.a 241.9
: ,556,5 21.2 _ 529.0 5.1 £i3i:i 69.1 . ¡SI 55.6 •;92.1 488.8 3 136 0 3 014.9 1356.7
:Y1991 1 0 2 1 « ■ U s i 687.8 52.6 266.7 , 5 7 9 ; o 2 2 3 __575.3 5 6 139S 7 3 6 54.9 Mo3J 521.3 3 478,4 3 207 9 1 5 7 2 3
: 1 9 9 2 108.4
XC3£
977.3 ■"■ 55.2 281.3 ,„611.8 24.1 IHK? S B ..149 9 7 9 7
I 'J)6.3 46.9 '103.2 5 1 9 9 3 653 5 3 250.7 1658.2
1 9 9 3 113.7 ..f 60.5 1061.3 . 58.8 258.0 J64.6J 23.8 {522.2 6.3 161.7 8 6 7 44.8 41.1 __._8Λ3 521.0 3 694.0 3 803 7 2 141.2
1 9 9 4 121.3 1 116.3 "· 61.7 255.9
L&åa
26.3 5 S 2 9 J 6.7 '171.1 92.1 45.5 45.9 . 9 1 . 1 550.7 3 855 3 3 9 5 1 9 2 35B.3
: 1 9 9 5 128.3 1 1 9 2 0 .65.1 265.2 ■¡■702.9 27.0 V510Í5 7.1 . 3 5 ώ 98.6 4 8 1 51.8 ■ 9 2 3 538 6 3 979 9 3 765.2 2 360 7
1 9 9 6 130.2 & 7 J 9 1 2 1 2 4 71.5 284.0 ■734.2 30.2 .;'.565.3 7.3 ΛΚ2 100.2 v.;50.9 53.1 .104.0 580.9 4 204.2 4 057.0 216B.1
... : Collective C o n s u m p t i o n . 1 9 9 0
21.5 _ 25JI 143.6
mo
60.4 171.8 5.3 .JA1i? 1.1 . . 3 2 5 22.2 8.4 2 2 4 49.5 158.2 883.6 767.0 210.4
. 1 9 9 1 23.3 ,:j267 178.7 r10.4 69.1 1180,3 5.8 _163v9 1.2 '.34.0
2A1
10.9 23.7 ' 5 2 7 177.0 9B1.8 827.5 247.7
1 9 9 2 24.5 _ 2 8 . 1 196.3 ■ 10.4
76.2 JJ95.5 6.4
: 166.4 1.3 ■36.5 26.4 _'..12;6 20.4 53.4 17B.B 1 0 3 2 9 B12.5 263.0
1 9 9 3 26.7 303 211.2 10.B 71.B ■ ?1A?
6.6 vÙJLS 1.4 39Í6 29.7 1 2 8 16.8 44.S 176.7 1041.6 9 2 2 1 344.1
1 9 9 4 28.5 31.6 210.3 11.5 69.0 ■22.1.4 7.0 ,146.5 1.5 ; 40,5 31.5 •13.0 1B.4 45.4 185.0 1061.3 926.6 377.4 1995 30.4 33.3 2 2 2 3 12.4 71.1 "2292 7.2 1.7 ".43.3 33.7 „:Λ4:3 21.0 ' 45.5 179.B 1 079.2 868.8 387.1 1996 30.6 34.5 219.7 ■ 13.3
74.3 i.23?.1
7.8 • 1 5 6 , 4 1.Θ .43.2 33.8 15.5 21.6 ; 51.0 18B.7 1.130,4 923.Θ 355,0
. G F C F " 1 9 9 0
31.2
JU
247.4 : 15.0 94.7 201,2 8.4 \ i 7 4 . ; a 2 0 .. :.*6J
30.6
Λ' 1 4 · « 2B.7 38.9 150.7 1 100.6 77Θ.3 742.4
[image:20.595.98.498.96.559.2]1 9 9 1 3 0 4 J™ 319.9 16.2 101.7 .,206.1 6.1 ^ 1 6 4 . 3 2 3 :' 4?.β 33.8 ..J?..? 22.0 " 3 7 . 5 139.4 1 180.7 757.8 865.0
1992 3 2 3 351.1 ' 1 6 . 3 97.3 205.2 6.3 ;: 180.6 2 2 .49.8 36.1 15.1 32.5 126.9 1186.4 764.6 873.7
1 9 9 3 32.1 '. Ι.7:3
355.9 1 6 . 2 81.1 ,.197,7 £ 9
¿142J7
2 6 . .51.3 37. Β 'ΐβ.3 10.6 ' 2 2 6 120.9 1J1J.2 906.2 1 078.6 1994 33.6 379.0
¿}β>4
80.3 %Ê2&A 6.6 2 5 .:.53.:ΐ 41.4
1 2 0 . : 22.8 127.9 1 155.6 981.3 1 133.2 1995 36.2 jfejb,7 400.6
. ^ i7-6
88.4 ; 21 O.J 7.4
2 8 " • 5 8 . 7 44.1
. '..18..e
14.6 ' 2 5 , 6 127.6 1217.7 955.8 1110.6
Ϊ 9 9 6 36.8 . 2 2 8 389.4 20.8 91.5 ¿2.122 8.6 2 8 . βν.5
44.5 15.1 29.3 135.6 1 2 5 4 6 1051.3 1 075.3 Source : Eurostat
Table ! ï.2.4
Β DK _ . _ D EL E F . · ' IRL I L NL '.".. A Ρ ' " ΐ ™ FIN
S
UK
EU R I S .
USA
JPN
Yearly growth ra
, 1 9 Private consumption
1.4
' - . 2.7
4.5 1.6 . 1.2 1.3. 4.3 0.6 2.3 '2.3 : 2.1 -0.5
¿¿ JDJ
1.3 _ : ' · . 2.0 2.1 2.1 '
tes of the main a jgregates of GOP, 9096 , at 1990 prices
Collective consumption
1.2 _ . , ; i , 3 . . . . ·...·
3.3 1.0 ; 2.1 ■ ■. 2.0 ; . ,
2.4 0.3 · . 2.8 ' 1.0 2.1
0.2 _ _ q . i _
1.1 0.2 2.4 GFCF 0.5 0.6 4.0 3.4 0.6 1 . 1 . 2.4 1.1
1.6
1.9 2.8 2 9 ·■
7.8 3.7 1.2 0.4 3.7 1.4
Source : Eurostat
one for Japan (+1.4%) while the USA recorded a considerable growth rate (+3.7%).
Within the Union, sizeable differences among Member States may be noted.
Indeed, between 1990 and 1996, six Member States (Luxembourg, Denmark, Ireland, Ger many, Austria and the Netherlands) have growth rates for private consumption expen diture higher than the EU average (+2.0%).
For eight countries, rates varied between +0.1% (Sweden) and +1.6% (Greece and Por tugal). Finland is the only State which records a negative rate (0.5%).
Differences between Member States also ap pear when comparing yearly growth rates for collective consumption expenditure. Two groups may be distinguished. The first contains Member States which have growth rates lower than the EU average (+1.5%), eight rates range between 0.2% (Finland) and +1.3% (Denmark). The second group is composed of seven Member States whose rates are higher than the EU average with rates varying bet ween +2.0% (France) and +3.3% (Germany).
Comparison between rates of gross fixed capital formation within Member States dur ing the same period also shows certain diffe rences in evolution. Thus, seven Member States have negative rates lower than the EU average (+0.4%), ranging between 7.8% (Fin land) and 0.5% (Belgium). The eight other countries recorded higher rates than this ave rage, between +0.6% (Denmark) and +4.0% (Germany).
The main aggregates in percent of GDP
sa
Gross domestic product In 1986 and 1996, private consumption expenditure in percent of GDP is higher in the USA than in the Union or Japan. In ten years, the share of household consumption of the Union has increased by 1.2 percentage points against 2.6 points for the USA.
Table I.2.5
Β DK 0 EL E F ' IRL I L
NL ν
A Ρ FIN S UK EUR15 USA JPN
Main aggregates, In % of GDP
Private v¿. Consumption!
1986 64.4 55.0 61.9 , .70.8 63.2 60.2 61.7 61.1 62.8 ¿ ;59.4 56.5 64.5 54.7 51.4 62.8 6JÏ0 65.4 58:6
1996 62.5 , 53:8 65.4 ¥73.9 62.0 60.6 54.6 61.2 52.8 ' 60.2 55.7 62.0 54.3 : 52.8 64.1 _J_6_2.2 68.0 59.8
..· Collective Consumption • 1986
16.8 ■23:9 13.4 .14.0 14.7 ·.· 19.2 18.0 16.4 12.8 15.5 19.0 14.2 20.5 27.5 21.0
...1Z·4.
17.5 9.7
1996 14.7 25.2 11.8 13.8 16.2 ...19.7 14.2 ' 16.4 13.1 14.0 18.8 18.9 22.1 ■ 25.9 20.8 _.L 16.7 15.5 9.8
GFCF
1986 15.6 20.8 19.4 23.0 19.5 19.3 17.4 19.8 19.6 20.4 22.8 24.2 23.4 18.5 16.9 . 1 9 . 2 19.8 27.3
1996 17.7 16.6 21.0 21.4 20.0 17.5 15.5 17.0 20.3 19.9 24.7 25.3 15.5 14.9 15.0 18.5 17.6 29.7 Source : Eurostat
Among the Member States, it is interesting to note apparent changes in the structure of GDP. In 1986, for instance, Luxembourg had a share of household consumption of 62.8%. In 1996, this share had fallen to 52.8%, which is a decrease of ten percentage points. The same tendency may be observed for Ireland which lost seven percentage points (54.6% in 1996 against 61.7% in 1986).
By contrast, in 1996 Germany and Greece show higher shares than those prevailing in 1986, by +3.5 points and +3.1 points respec tively.
Always in comparison with the structure pre vailing in 1986, the number of Member States
under the EU average had slightly increased by 1996, i.e. Denmark, France, Ireland, Lux embourg, the Netherlands, Austria, Finland and Sweden.
For the two years observed, it is the Union and the USA, which have alternately the highest share of collective consumption in GDP, while for Japan, this share does not reach 10%.
On the whole, it should be mentioned that the general tendency is downwards. The share of collective consumption in GDP loses ground, not only in the Union where it drops by 0.7 points (going from 17.4% in 1986 to 16.7% in 1996), but also in the USA where it falls by 2.0 points, dropping from 17.5% in 1986 to 15.5% in 1996. Only in Japan a slight increase of 0.1 points may be discerned.
Within the Union, the largest shares have been recorded in Sweden, both in 1986 and 1996, (27.5% and 25.9% respectively).
As far as the share of the gross fixed capital formation in GDP is concerned, it may be observed that the Union has both in 1986 and 1996 a structure closer to that of the USA than that of Japan.
Capital formation represented more than 27% of the GDP in Japan in 1986 and, in 1996, more than 29%. On the other hand, in the Union and USA, in 1986, it only exceeded 19% of GDP and in 1996 approximately 1718% of GDP.
Economie cyde
L=E3
1.2.2. Economic cycle
Shortterm trends in the Union, the United States and Japan in 1996: comparison with the period 19911995
For the European Union as a whole, the up
turn in the cycle which had started moving upwards after bottoming out in 1993 had already shown some signs of easing off during 1995, thereby prompting a general decline in growth rates, which in most of the Member States economies was mainly concentrated in the second half of the year. Exports, although continuing to be the most vigorous component in demand, had began to ease up.
Measured in constant prices, GDP in 1996 grew by 1.7%, a further drop in relation to the average of +2.4% recorded in 1995.
However, the second half of the year saw a gradual recovery in production, led primarily by a solid export performance.
The annualised trend in the GDP figures in the Union as a whole moved steadily upwards,
Table L2.6 ;.: for til
Quarterly .variations of GDP aggregates e European Union, the United States and Japan,
. . . i n % , 1 9 9 6 ■ : ' : Quarterly variations
,.:. compared with the . . '
;:.,:· .previous quarter :;...: . 0 1 . Q2 | :Q3 | : Q 4
Quarterly variations ' compared with the same : quarter of the previous
year
:Q 1 | Q2 | Q3 | C M . ■"·:■' GDP
EUR15 USA JPN
0.4 0.5 2.1
0.4 1.2 0.3
0.8 0.5 0.3
0.4 0.9 1.0
1.2 1.7 4.8
1 3 2 7 3.4
1.8 2.2 3.5
2.0 3.1 3.1 Private Consumption .
EUR15 USA JPN
1.3 0.9 2.0
0.1 0.8 1.0
0.7 0.1 0.2
0.3 0.8 1.2
2.6 2.5 4.7
1.3 2.6 3.1
2.0 2.1 1.8
2.3 2.7 2.0 " ; Collective Consumption '■
EUR15 USA JPN
0.7 0.2 OS
0.8 1.9 0.1
0.3 0.1 1.3
0.2 0.4 0.6
0.0 1.1 2.1
1.0 0.8
1.a
0.9 0.9 2.4
0.5 1.3 2.9 G F C F
EUR15 USA JPN
1.0 2.Θ 3.4
1.3 1.8 2.4
0.8 2.0 0.3
0.4 0.9 0.5
0.8 4.1 10.1
1.0 6.0 10.4
1.3 6.8 10.1
1.5 7.5 5.7 Export (Including IntraEUR 15)
EUR15 USA JPN
1.4 0.5 0.7
1.0 1.4 0.1
2.5 0.2 1.6
1.9 5.7 4.3
2.7 7.2 2.3
2.7 7.2 1.2
5.3 4.2 2.1
6.8 7.5 5.4 Imports (including IntraEUR 15)
EUR15 USA JPN
1.6 2 6 2 0
0.7 2.4 1.9
1.8 2.2 0.3
2.0 0.8 1.1
4.3 4.1 15.5
2.0 5.4 13.4
2.9 7.8 8.4
4.7 8.3 4.7
rising from 1.2% in the first quarter of the year to 2.0% in the last quarter. The shortterm pattern was still patchy, however, with excel lent figures in the third quarter of the year followed by another downturn in the final quar ter, when some of the Member States were hit by particularly bad weather (see table 1.2.6).
The rise in GDP in the Union as a whole was accompanied by an increase of +3.7% in im ports, the lowest figure since 1993, when there had been a drop. Exports were also slowing down considerably after the performance in 1994 and 1995, but still managed to achieve a rate of +4.5%, ahead of the import figure.
With regard to domestic demand, private con sumption was the most vigorous component (+2.1%), while both gross capital fixed forma tion (+1.1%) and collective consumption (+0.6%) grew at a slower rate (see table 1.2.7).
There was a patchy performance during the year by almost all the components of GDP. A look at the trend pattern shows that the two middle quarters of 1996 were the weakest pe riod, with both private consumption and im ports affected.
After falling in the first quarter, investment sub sequently recovered steadily. Exports rose sig nificantly in the last two quarters of the year, and by the end of the year they generally matched the figures for the growth in real terms of world trade (see figure 1.2.1 and 1.2.2).
In the United States, the growth which began in the second quarter of 1996 continued at a rate which closely matched potential growth.
Figure 1.2.1: GDP growth rates compared with the same quarter of the previous
year, in %, 19921996
0.1 02 33 04 0.1 02 03 04 01 02 03 CM Q1 02 03 Q4 Q1 02 03 Q4
EUR15 USA ■
\m
Economic cycleFigure I.2.2.: GDP growth rates compared with the previous quarter,
in %, 1992-1996
Q1 02 0.3 04 Q1 02 0.3 04 Q1 02 03 04 Q1 Q2 Q3 Q4 Ql 02 03 Q4
-EUR15 USA.
Source : Eurostat
The figure for 1996 was +2.4%, compared with +2% a year earlier.
The upturn involved both private consumption and investment. When the current period of expansion is compared with the previous eco-nomic recovery in the 1980s, when there was a surge in investment in construction, it can be seen that the current recovery, although more moderate, reveals stronger investment in equipment. In 1996, in particular, the rise of 4.6% in investment in construction was out-stripped by a figure of +7.6% for investment in equipment and means of transport.
A look at the US figures for 1996 also shows that there was a sharp rise in growth towards the end of the year. In the last quarter, espe-cially, there was an increase of 0.9% in GDP, fuelled not only by investment but also by pri-vate consumption and net exports. This re-sulted in an annualised figure of +3.1%, the highest since the end of 1994.
In comparison, GDP growth in the first quarter of 1996 had produced figures of +0.5% and +1.7% respectively. In spite of fears that the economy could overheat, based on faster growth during the year, prices were kept in check, thanks mainly to strong gains in produc-tivity and greater efficiency of plant installed during the current phase, together with an ex-pansion of production capacity and moderate increases in labour costs.
After four years of relative stagnation in Japan, GDP grew by +3.6% for 1996 as a whole. The primary reason was the sharp upturn (+2.1%) in the first quarter. In the middle quarters of the year, private consumption slipped for two suc-cessive quarters and investment began to slow down, eventually recording a negative per-formance (-0.5%) in the final quarter of the year.
The economic situation in the Member States in 1996
The recovery from the recession of the early 1990s, which had begun back in the second half of 1993, faltered in the two-year period 1995-1996, which meant that real growth rates for the Union as a whole were lower.
In Germany, the slowdown in growth stemmed mainly from declining investment. The latter was down by 0.8% as a result of a drop of -2.7% in investment in construction which offset a rise of +2.4% in equipment.
Exports, in particular, produced a performance in the second quarter that indicated a healthy cyclical and long-term recovery, as they be-came more competitive because of a weaker deutschmark and greater world demand. In spite of this, the economy flagged in the final quarter of the year, with GDP falling by -0.1%, mainly because of the adverse weather condi-tions that above all affected the building sector.
In France, the downturn in GDP recorded in the second quarter (-0.2%) reflected declining exports and weak domestic demand, caused both by a decrease in consumption (-1.0%) and by a decline in investment, especially in the construction sector (-2.1%). GDP started grow-ing again in the third quarter (+0.8%) but again weakened towards the end of the year (+0.2%). Although exports performed errati-cally, the second quarter of the year saw them moving ahead strongly in terms of the overall trend.
Economic cycle
Ξ 2
by -0.3% over the year) recovered in the sec ond and third quarters, only to suffer a further downturn in the final three months of the year. Private consumption (+1.1% over the year) produced a fairly steady performance in each quarter, although there were signs that spen ding on consumer durables was rising in the second half of the year. After the sharp rise in investment in 1995 (+6.9%), gross fixed capital formation rose by 1.2% in 1996.
The buoyant cycle that the United Kingdom
has been enjoying for more than five years now continued during 1996, with growth registering +2.1%. Exports were boosted by the earlier depreciation of the pound sterling, which lost 14.3% of its value between September 1992 and the end of 1995. The subsequent harden ing of th& pound failed to curb the growth rate of
exports.-Investment performance was rather patchy, with a sharp downturn in the third quarter fol lowed by a recovery in the fourth. Private con sumption was more buoyant than among the UK's main partners and the general trend was upwards in the second half of the year.
On the whole, 1996 was a good year for the economy in Spain. The previous cycle had bottomed out in the second quarter of 1993, about three years after the previous cycle had peaked. There was solid growth in 1994, which was led by foreign demand, encouraged in part by the devaluation of the peseta. Foreign de mand remained strong in 1995 and was ac companied by a clear increase in productive investment.
GDP growth in 1996 amounted to +2.2% (com pared with +2.8% in 1995), with a quarterly figure of +0.6% in the first three quarters of the year, followed by a slightly better figure of +0.8% in the final quarter. The trend in gross fixed capital formation was reversed, with slight downturns in the short-term trend from the second quarter and in the annual trend from the third.
In the Netherlands as well, after the trough in the previous cycle at the end of 1993, the export-led recovery continued at a good rate, with every component contributing. Unlike
most of the Member States, GDP growth ac celerated in 1996, producing a figure of +2.8%. The most buoyant component during the year was investment in machinery and equipment.
GDP growth in Belgium was +1.5% in 1996, more or less in line with growth in Germany. Private consumption edged slightly upwards, while collective consumption continued to ex pand at the same rate as in 1995. There was an increase of 2.4% in gross fixed capital for mation. In Luxembourg, GDP growth regis tered +3.6%.
In Austria, the slowdown that had started dur ing 1995 stemmed mainly from the adverse effects on exports of the appreciation of the schilling and the cyclical decline of demand in the construction sector. The economy contin ued to slow down in 1996, when GDP growth was only +1.0%.
The economies of the Scandinavian countries showed different patterns of development. Growth in real terms was most pronounced in Finland (+3.3%), although the figure was down on the average achieved in 1995 (+5.1 %). The quarterly figures revealed an im proving situation in the second half of 1996. This trend is even clearer in the annual figures, which show a steady rise in GDP growth from +1.5% in the first quarter to +5.8% in the final quarter of the year. In conjunction with a solid consumption record and a lessening rate of investment in machinery and equipment during the year, the better performance in the second six months was prompted by strong growth, both in exports and in construction investment. The year-on-year figures for both these com ponents were negative in the first quarter of 1996 but reached double figures by the last quarter of the year.
In Sweden, on the other hand, there was a
CT
Economic cyclequarter to a downturn of 0.6% in the last three months of the year.
After peaking in the first few months of 1986, the economy in Denmark made fairly modest progress in real terms throughout the period between 1987 and 1993. The cycle reached its lowest point between the second and third quarters of 1992, about a year ahead of most of the Member States. Growth began to pick up only from the third quarter of 1993 and reached +4.2% in 1994. In the next two years there was a further easing back, and GDP growth changed from +2.6% in 1995 to +2.7% in 1996. The quarterly pattern reveals gradual consoli dation, borne out by the annualised figures for GDP growth that moved from +1.0% in the first quarter of 1996 to +3.3% in the final quarter of the year.
Ireland maintained the performance that it has been showing since 1994. After growing by +11.1% in 1995, GDP in 1996 was up by +8.6%, easily the highest figure of any member of the Union. Growth was sustained by net exports, but also by strong domestic demand and vigorous gross fixed capital formation (up by 15.9%).
Unlike most of the Member States, Portugal . and Greece boosted their growth rates, which rose between 1995 and 1996 from +2.0% to +2.6% in Portugal and from +1.9% to +3.0% in Greece. Portugal had emerged from the re cession in 1994 thanks to its export perform ance, but over the next two years the economy was fuelled mainly by investment (up by 7.4% ir 1996). Exports were stationary in Greece, but private consumption grew by +2.2% and gross fixed capital formation by +11.8%.
The growth trend and the cycle of the Union since 1980
Although alternating periods of expansion and recession were more evident in the 1970s than subsequently, the average rate of growth among the members of the Union was rela tively more marked in the period 19711980 (see figure 1.2.3). The disparity in the pattern of expansion between the two subperiods af fected every Member State except Luxem bourg, the United Kingdom, Ireland and to a
Figure I.2.3: Average GDP growth rates of the Union, USA and Japan for the years 19711980
and 19811996, in %
4.5
4.0 3.5
1 0 i n
σ» 3.0 en 5 2'5" o> " 2.0
1.5 1.0
0.5
IRL /
/
/
♦ L / » JPN
/ ♦ USA % E
U K> < . D 'N L™ . A / " ♦ · . 1 / DK EUHIS . ♦ 1
/ ♦ S
· /
0.0 1.0 2.0 3.0 4.0 5.0
19711980
Note : The horizontal and vertical axes represent the growth over the periods 19711980 and 1981
1996 respectively. A countryin the upper area had a stronger growth in the second period while a countryin the lower area had a stronger growth in the first one.
Source : Eurostat
lesser extent Germany and Denmark. It was particularly evident, however, in the economies where initial GDP levels had been lower but which then moved closer to the EU average.
A feature of the cyclical development of the European Union in the last 16 years was an initial process of decline to the trough reached in the second half of 1982, followed by a long period of expansion (19831987), which in creased in pace after a slow start but then died out after about eight years, in the second half of 1990.
The latest period of recession lasted three years, reaching its lowest point in the second quarter of 1993. The start of the downturn and the subsequent move out of recession oc curred over a period which was roughly 15 months shorter than the corresponding period at the beginning of the 1980s, when the slip into recession had been less sudden.
Economic cycle
aa
eurostat Among the Member States, Italy, Germany
and the United Kingdom reached the bottom of the recession in the second half of 1982, about a year after Denmark and a few months ahead of the Netherlands and Spain.
France ran counter to the trend, benefiting from a negative growth differential in relation to its main European partners.
In Austria, Finland and Sweden the cycle bot-tomed out in 1981. The recession was particu-larly marked in Austria and Sweden, whereas the Finnish economy continued to record posi-tive growth rates in spite of the dip.
The subsequent contraction of the economy affected Austria, where the cycle was more in line with the EU trend, in 1992 and 1993, whereas it had affected Finland and Sweden at least two years earlier.
In Finland the contraction of economic activity came immediately after the collapse of exports to the Soviet Union in 1989. In Sweden the economy stagnated after the strong period of expansion between 1984 and 1989.
The period from 1983 to the end of 1986 was marked, in general, by a trend pattern that was not always clear and uniform. This phase con-tinued in Germany until 1989 when — in the wake of unification — it was followed by a period of vigorous expansion that culminated in early 1991. In Denmark, the recovery was steady throughout the 1984-1986 period.
The subsequent period of expansion reached its zenith between the end of 1990 (the Nether-lands and Spain) and the first half of 1991 (Italy and Germany). The United Kingdom had reached that point two years earlier.
The interdependence of the Member States
; The interdependence of the European
j Union's economies, which developed partly as a result of the spontaneous trend towards ; the "intemalisation" of trade between the I Member States, has intensified throughout i the period from the early 1970s until now. | Apart from making the economies more
vul-nerable to external events, it has contributed | to a substantial degree of alignment between I the medium- and long-term rates of develop-! ment of the various economic systems. The ! cross-correlations of the growth rates of GDP in real terms between 1971 and 1995 reveal [ the existence of groups of countries which ; are more interrelated, especially where short- and medium-term fluctuations are concerned. There are four groups of coun-! tries:
- a first group comprising the economies of the Netherlands, Belgium, Luxem-bourg and Austria, whose growth rates are strongly interrelated, with average cross-correlations around 0.7;
- a second group consisting of France, Italy and Germany, with average cross-correlations just below 0.6;
I - a third group comprising the economies
of Spain, Greece and Portugal, which are "moderately" interrelated with the other economies of the Union (cross-correla-tions between 0.4 and 0.5) and with each other (0.4);
3 0
Global demand1.2.3. Global demand
The pattern of domestic demand
For the European Union as a whole, a combi nation of factors accounted for the slackening of domestic demand that started in 1995 and got worse in 1996. The slowdown was due partly to a physical reduction in stocks and partly to a significant easing in the growth of gross fixed capital formation, only partly offset by a slight increase in private consumption.
After growing by+2.1% in 1995, total domestic demand rose by 1.4% overall in 1996. Of the components of demand, private consumption grew by +2.0% in 1996 (compared with +1.7% in 1995), while collective consumption in 1996 repeated the previous year's figure of +0.6%.
Total investment rose by 1.1 %, compared with +3.6% in 1995. Although investment in equip ment and means of transport continued to be the main factor in the growth of total invest ment, it slackened considerably and, accor ding to Commission estimates, fell from the 1995 figure of +6.5% to +2.7% in 1996. In the construction sector, investment was down by 0 . 1 % after a rise of 1.6% in 1995.
In the United States, overall domestic demand grew by +2.5% in 1996, half a point higher than in the previous year. The increased economic activity, boosted by a slight rise in stocks, af fected both consumption with private con sumption up by +2.5% compared with +2.4% in 1995, and collective consumption up by +0.5% after falling by 0.3% the year before and particularly investment, which saw an in crease in real terms of more than 6%. The most telling factor was again investment in equip ment and transport.
In Japan, the period of stagnant domestic de mand that had been a feature of 1992 and 1993 had given way to a period of steady rise, with a growth rate of +4.6% in 1996. Both private and collective consumption rose: by +2.8% and +2.3% respectively. After three years of contraction between 1992 and 1994 and the slight recovery in 1995, total investment surged ahead in 1996 (+9%), thanks to greater invest
ment in construction (+12.5%) and equipment and transport (+6.7%) (see table I.2.7).
Table I.2.7 .:
Growth rates of domestic demand,
at constant pr
1993 1994
ces 199C 1995
. In %
1996 EUR15
Domestic demand Privale consumption Collective consumption GFCF
Construction Equipment and transport
1.9 0.4 1.1 6.8
2.5
1.6 0.5 2.4 0.9 4.0
2.1 1.7 0.6 3.6 1.6 6.5
1.4 2.0 0.6 1.1 0.1
2.7
USA : Domestic demand
Privale consumption Collective consumption GFCF
Construction Equipment and Iransport
3.0 2.8 0.0 5.1 3.4 7.0
4.0 3.1 0.2 7.9 5.7 10.2
2.0 2.4 0.3 5.2
2.2
8.6 2.5 2.S 0.5 6.1 4.6 7.6 • JPN·::· ■'·?:: :
Domestic demand Private consumption Collective consumption GFCF
Conslruclion Equipment and transport
0.1 1.2 2.3 1.9
0.9 1.9 2.4 0.7
2.2
2.0 3.5 1.1
4.6 2.8 2.3 9.0 12.5 6.7
Source: Eurostat and European Commission
Investment
Starting in early 1995, the confidence indicator based on monthly surveys of businesses in the European Union steadily deteriorated until July 1996. The average figure for 1996 was thus well below the 1995 level. Views concerning the size of orders in hand and the ideas of business on how production was likely to de velop also showed signs of pessimism. This reflected a slowdown in investment that was affecting the entire Union. In August 1996, however, the trend began to turn and led to an improvement in the climate of business opinion in the last two quarters of the year. This greater optimism also applied to orders in hand and the outlook for production (see figure I.2.4).
Global demand
ΠΞΡ/1
Figure 1.2.4: Growth rates oí GFCF compared with the results of business surveys on enterprises in the Union, in %
1995 1996 rmGFCF
κ— Industrial confidence Indicator —·— Production expectations «— Orderbooks
Note: on the vertical axis, the left scale refers to the growth rates of GFCF while the right scale re fers to the results of the business survey. Source : European Commission
Table 1.2.8
1992 1993'' 1994 1995 1990"
,: ..Growth rates of some determinants of GFCF 'in the European Union, ás a % of the previous year
·· Profits...
0.4 " " T . : Í . 4 " ".'
8.3
3.1
Longterm : interest rate.
(%)
9.8
B.2
7.1
Real unit labour costs
0.0 ~^0.9 "■''
2.4 1.6
'Labour productivity
2.4 " l . 5r":
3.2 '"' 1.8 V:
i's"
Source: European Commission
In conjunction with a slight downturn in overall investment in Germany and France, coupled with a modest rise in the United Kingdom and Italy, fixed assets made a big contribution to
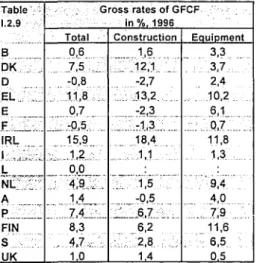
Table I.2.9
Β DK ,.·_. . D EL,.;:,..: E
F ,
IRL
ι. ',..;;
L ÑL:.7; A
Q
.
FIN S UK
Gross rates of GFCF
Total _ 0,6 . _ _7,5 .,:...
.. 0.8 .1.1,8. .
0,7 . , 0 , 5 .
15.9 .'... ..1,2.;
0,0
OAA¿
1,4 7,4 8,3 ... 4 , 7 , .
1.0
in%.1996 Construction
1,6 J .12,1 .'.
2,7 . .13,2.
..2,3 :._I:1,3_...._
18,4 1,1 '
1,5 0,5 J3.7 6,2 2,8 1,4
Eouipment 3,3 3 , 7 , 2,4 10,2:. .6,1. 0,7 11.8
1,3
9,4 ' 4,0 7,9 11,6
6,5 0.5
total GDP growth in Greece, Ireland, Denmark and Portugal.
Growth was driven in most countries by the relatively more buoyant performance of the machinery and equipment sector. Investment in construction, on the other hand, led the way in Denmark, Greece, Ireland, Luxembourg and the United Kingdom (see table I.2.9).
Private consumption
Private consumption also showed growth matching the main indicators compiled from the shortterm household surveys in the Union. The variation in household consumption, while edging upwards, nevertheless remained fairly modest in most Member States, apart from Ireland (+6.3%), Finland (+3.2%), the United Kingdom (+2.9%) and the Netherlands (+2.8%) (see table I.2.5).
Figure I.2.5: Growth rates of private consumption compared with the results of
opinion polls of consumers In the Union, ¡n%
2 0
1.5
1 0
0.5 X.
V
V /
\
/.
-1D92 1993 1994 1995 19W
U Private Consumption Consumer confidence indicator
General economic situation (ovar last 12 months) Financial situation of households (over last 12 months)
Source : Eurostat and European Commission
Note: on the vertical axis, the left scale refers to the growth rates of private consumption while the right scale refers to the results of the opinion polls of consumers
Source : European Commission
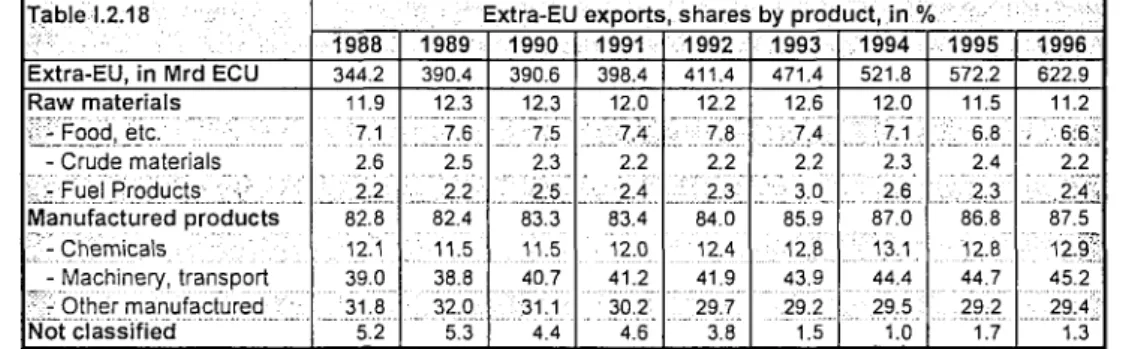
External demand