LOGGING INDUSTRY
by
K.W. GROVES
This thesis was submitted for the degree of Master of Science in the Australian National University
Except as recognised in the acknowledgements this thesis is my own original work.
K.W. Groves
ACKNOWLEDGEMENTS
I wish to record my thanks to my supervisor, Dr L.T. Carron of the Department of Forestry, Australian National University.
I should like to acknowledge my particular debt to Mr E.D. Parkes of the Department of Forestry, Australian National University for valuable discussions on discounting
and the theory of a single investment.
I should like to thank Mr T. Johnson of the Department of Forestry, Australian National University for his help in devising a computer program to calculate taxation payments.
In the general background to my thesis I have had
useful discussions over the years with Messrs A.G. Hanson, D.L. Craker and J. de Vries of the .Forestry and Timber
Bureau, Department of National Development. I should like to express my appreciation for their help.
i i i ABSTRACT
An accurate knowledge of costs and returns is of
importance to the logging industry as a means of assessing the efficiency and profitability of a logging operation and as an aid in the selection and management of new machines.
Likely returns are known or can be predicted with
reasonable accuracy since they are usually based on contract rates per unit volume felled, snigged, loaded and/or delivered to mill and the annual volume which can be logged in most
hardwood operations in Australia is controlled within fairly restricted limits. Costs, on the other hand, are frequently not known in sufficient detail by logging contractors and there is often some doubt about the exact nature of some of the costs and the way in which they should be defined and
determined. Survival becomes the only measure of efficiency, an unsatisfactory criterion in any ~ndustry but particularly in one which has been described as ailing.
The logging research section of the Forestry and
Timber Bureau, Department of National Development, developed a costing procedure in the nineteen sixties intended to
help any small contractors to allocate actual costs in a rational way; to estimate likely costs for a given logging machine; and to determine average hourly costs, which could then be related to hourly rates of production, from which unit costs could be derived.
This procedure suffered from a number of shortcomings; the main one that i t did not take account of possible year by year variations in costs which could have an important effect on a contractor's net cash flow and thus his
financial liquidity. Furthermore i t did not permit a
sufficiently rigorous examination of alternative methods of acquiring logging machinery as an investment. This thesis presents another approach which not only takes account of year by year variations in costs and net cash flows but s t i l l enables an average hourly cost at any specified rate of return to be calculated by discounting costs to year zero at the required rate of return and converting the total discounted cost to an annuity over the life of a
advantage of allowing analysis of both cost and investment at the same time. I t s t i l l suffers from the same disadvantage as the Forestry and Timber Bureau's procedure in that i t gives only an average annual or hourly cost over the life of a machine. However , since annual costs must be known
or predicted in order to calculate average hourly cost these important variations from year to year must be apparent.
The costing procedure also permits before-tax and after-tax analysis of the internal rate of return and net present value at various rates of interest of investment
in a single logging machine at three proposed levels of
revenue. Carrying the analysis a stage further, and taking as an example a tracklaying tractor commonly used through-out the logging industry, those levels of production
which will give an adequate return at specific contract rates are estimated.
Chapter 1
Chapter 2
Chapter 3
CONTENTS
Estimating, recording and allocating costs Estimating likely costs
Recording actual costs
Allocation of costs to each phase of a logging operation
Methods of stating machine costs Productive and unproductive time Fixed and variable or owning and
operating costs Associated costs
Fixed costs when purchasing for cash or hire purchase
Depreciation
The straight line method
The declining balance or diminishing value method
The sum of the years digits method The sinking fund method
Increases in the purchase price of logging machinery as these affect depreciation
Selection of a method of depreciation Hire purchase
Interest charges
Equivalence of various methods of depreciation
Equivalent capital recovery depreciation Insurance, registration and other
statutory charges
Leasing
Leasing as a means of acquiring
equipment without capital investment Leasing and taxation
Simplification of cost accounting Leasing as a hedge against inflation Leasing methods for the logging
industry
V
Page 1
12
Chapter 4
Chapter 5
Chapter 6
Chapter 7
Chapter 8
Page
A comparison of total annual fixed costs under various purchasing or leasing
schemes
Proposed purchasing or leasing options Analysis of proposed options
The current situation in the logging
industry , and the economic life of machines
Variable or operating costs Fuel and oil
Maintenance and repairs
Associated costs Wages
Wage rates in snigging Wage rates in felling
Wage rates in haulage operations Workers' compensation insurance Overheads
Taxation
Primary producers
Investment and depreciation allowances Interest paid on borrowed money
Leasing Averaging
Terminating averaging Provisional tax
The effect of income tax on a logging contractor
Productivity and profitability in the logging industry
The present situation Costs and productivity
Unit costs of production and unit contract rates
Total annual costs of production
Break-even levels of annual production Investment appraisal based on discounting
techniques
Benefit/cost ratio
53
62
72
85
Chapter 9
Annual capital charge Net present value
Internal rate of return
Investment analysis of a single logging tractor
Estimates of net cash flow, net present value and internal rate of return before tax
Hourly costs
Net present value and internal rate of return after tax
Determining taxation
The effect of provisional tax After tax returns
Summary and concluding discussion
References
Appendices
vii
Page
141
152
TABLES
1. Depreciation provisions for a machine costing
$55,000 a 'logging' life of eight years and a resale
Page
value at the end of eight years of $13,000 16 2 •
3 •
4 •
5 •
6 •
7 • 8.
9.
10.
F.o.b. ' port of shipment', values for a selected range of crawler tractors imported to Australia in 1957/58 and 1967/68
Increase in purchase price of two models of crawler tractor from 1964 to 1969
Depreciation provisions , as in Table 1, but making allowance for an increase in purchase price of
4% p.a.
Number of crawler tractors, by horsepower classes, in the Australian logging industry
Number of rubber tyre~ tractors, by horsepower classes, in the Australian logging industry Resale value of a $55,000 crawler tractor
Resale value year by year according to tractor distributor, and book values as determined by different methods of depreciation
Comparison of interest charges on average capital and unrecovered capital for various methods of depreciation
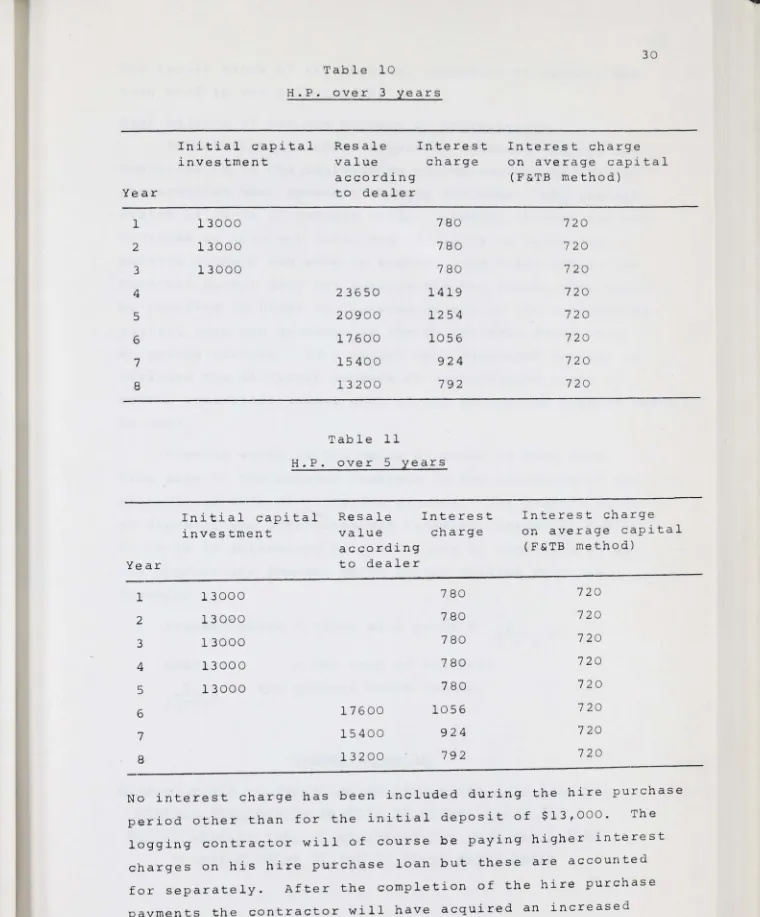
Interest charges on invested capital for hire purchase over three years
11. Interest charges on invested capital for hire purchase over five years
12. 13. 14. 15. 16. 17.
Present worth of depreciation provisions plus interest assuming straight line depreciation
As for Table 12, but assuming sum of years digits depreciation
As for Table 12, but assuming declining balance depreciation
As for Table 12, but assuming sinking fund depreciation
As for Table 12, but assuming depreciation according to dealer's resale value
Insurance on a tracklaying tractor costing $55,000 18. Resale and residual values for a $55,000 tracklaying
18 19 20 21 21 22 23 29 30 30 32 33 34 35 36 39
i
ix Page 19. Annual lease charges for a five year lease followed
by another five year lease 48
20. Annual fi xed costs for a five year lease followed by ownership for three years
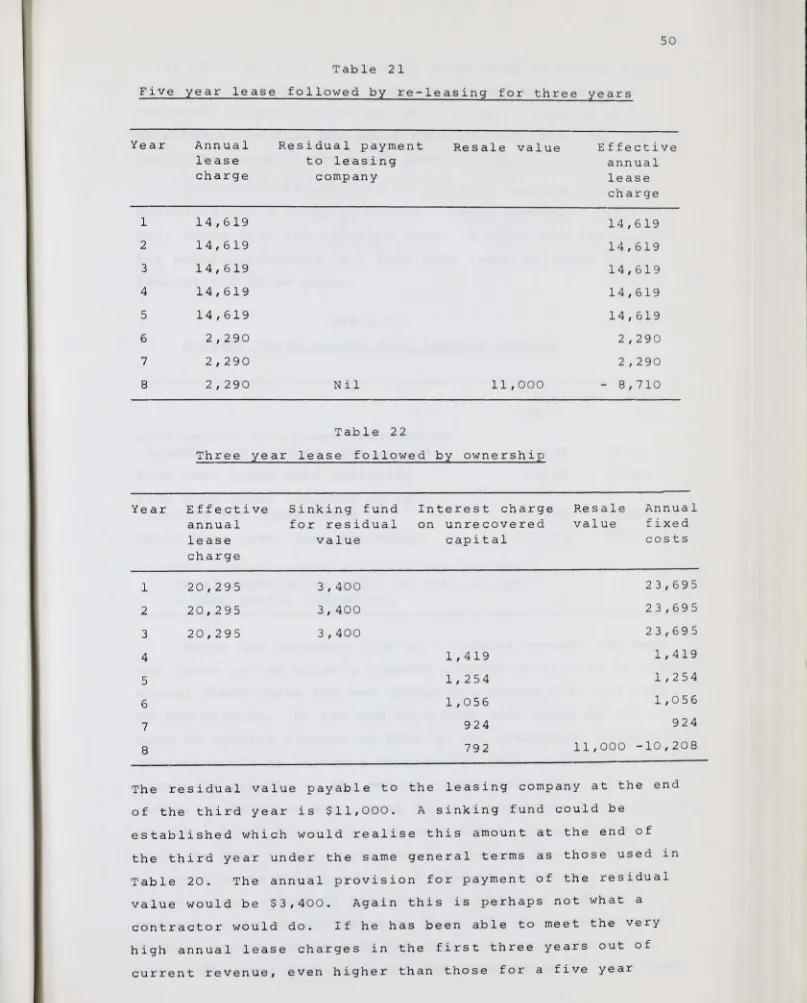
21. Annual lease charges for a five year lease
49
followed by re-leasing for three years 50 22. Annual fixed costs for a t hree year lease followed
by ownership 2 3 ~
24.
2 5.
Present worth of four leasing options
Annual fixed costs for outright cash purchase assuming capital recovery depreciation at 6% Annual fixed costs for hire purchase over three years assuming a total life of eight years
26. As for Table 25 but for hire purchase over five years
2 7.
2 8.
29.
As for Table 25 but for leasing for five years followed by leasing for another five years
As for Table 25 but for leasing for five years followed by ownership
As for Table 25 but for leasing for five years followed by re-leasing for three years
30. As for Table 25 but for leasing for three years followed by ownership
31. 3 2. 33. 34. 35. 36. 37. 38.
Crawler tractors by age classes , working in the Australian logging industry
As for Table 31 but for rubber tyred tractors Fue l and oil consumption in gallons per machine hour for logging tractors
Fuel and oil consumption in gallons per mile for logging trucks
Annual sums required for track overhaul fund assuming a two year cycle
Two methods of estimating repair charges for a crawler tractor costing $55,000 having a resale value of $11 , 000
Maintenance and repair of logging trucks as a percentage of depreciation
Average annual wages in the sawmilling industry 1946/47 to 1967/68
39.
40.
41.
4 2.
4 3.
Average annual percentage increases in wages in the sawmilling industry
Average annual wage in manufacturing industries 1954/55 to 1965/66
Workers' compensation insurance rates for logging operations in Australia
Determining taxable income from average income assuming averaging from 1965/66
The start of averaging
44. The effect of averaging incomes on the tax paid by primary producers
45. Total annual costs for cash purchase
46. Total annual costs for hire purchase over three years
47. Total annual costs for hire pu~chase over fi ve years
48.
49.
50.
Total annual costs for leasing over five years then re-leasing for three
Total annual costs for leasing over three years followed by ownership for five
Minimum and maximum hourly costs for each method of acquisition
51. Break-even annual log volume for each method of acquisition for various contract rates
52. Minimum and maximum hourly costs assuming four tractors each having an economic life of eight years X Page 80 80 84 87 88 89 99 99 100 100 101 101 103 105 53. Break-even annual
a fleet of four
log volumes per tractor assuming 106 54. Average hourly costs assuming a fleet of eight
tractors 107
55. Break-even annual log volumes per tractor of cubic feet assuming a fleet of eight
in 000 's 107 56. Net cash flows for three levels of gross annual
revenue when purchasing for cash
57. As for Table 56 but when hire purchasing over five years
58 . As for Table 56 but when hire purchasing over three years
113
114
59. As for Table 56 but when leasing for five years followed by re-leasing for three years
60. As for Table 56 but when leasing for three years followed by ownership
61. NPV's and IRR' s for level 1 of gross annual revenue
62. NPV's and IRR's for level 2 of gross annual revenue
63. NPV's and IRR ' s for level 3 of gross annual revenue
6 4. Before tax analysis of net cash flows, NPV and IRR
65. Annual log volumes required for three levels of gross annual revenue and a range of five contract
xi Page 116 117 119 120 121 124
rates 126
66.
67.
68.
&9.
Average hourly cost to include- a rate of return of 10%
Average hourly cost to include a rate of return of 15%
Average hourly cost to include a rate of return of 20%
Total allowable deductions from gross taxable
income for the various acquisition procedures for level 1 of gross annual revenue
70. As for Table 69 but for level 2 of gross annual revenue
71. As for Table 69 but for level 3 of gross annual revenue
7 2. 7 3.
Tax payable without averaging
Tax payable with averaging
74 . . NPV and IRR before and after tax at three levels of return for cash purchase
75. As for Table 74 but for hire purchase over five years
76. As for Table 74 but for hire purchase over three years
77. As for Table 74 but leasing for five years followed by re-leasing for three years
78. As for Table 74 but leasing for three years followed by ownership
79.
80.
I
Specialised functions of some machines in hardwood logging in Australia
Sawlogs removed from crown land in 1967/68 expressed as a percentage of total sawlog removals
Page
146
1 .
2 •
3 •
FIGURES
Book value by various methods of depreciation compared with dealer ' s resale value
Average hourly costs for various methods of acquisition for a $55,000 tracklaying tractor, assuming a life of eight years and a resale value of $11,000
After tax NPV's for five feasible methods of acquisition at two levels of production
Xl l l
Page
23a
130a
ESTIMATING, RECORDING AND ALLOCATING COSTS
Introduction
In assessing the profitability of a logging operation the cost of owning and operating the machines used must be known. Since this can involve more or less complex
calculations the many small sawmillers* and logging
contractors who make up the greater part of the industry may be uncertain of some of their more important costs and the effects these have on profitability. There are other associated aspects. The problems of selection and
management of new logging machines are becoming increasingly more economic rather than mechanical. New machines are
usually much more complex than they were even a few years ago so that they are less well understood by the contractor or his operator who therefore has to depend much more on outside services for adjustments, maintenance and repairs, a contributory factor in rising operating costs. The
traditional figure of the contractor or his machine
operator who was also a good 'bush' mechanic is disappearing from hardwood logging operations. Another recent develop-ment has been the introduction of specialised machines such as rubber-tyred skidders which are highly productive in one particular phase of a logging operation but lack versatility. They are usually expensive and may be
difficult to dispose of at the end of their economic
logging life . The fact that a machine may have very l i t t l e resale or real trade-in value can only increase s t i l l
further the cost of owning i t .
*Sawmillers may e i ther log their own timber entirely, owning or leasing their machines and employing labour on day wages or incentive bonuses ; or they may use one or se~eral contractors to fell , snig , load, haul and con-struct roads ; or they may use a combination of direct
labour for some phases of logging and contract for others. For this thesis these differences are unimportant and I shall use the term 'logging contractor ' to cover all these cases .
Estimating likely costs
The basic method of costing machinery which will be used as a starting point in this chapter, an example of which is given in Appendix 1, has been developed over
recent years by the hardwood logging research section of the Forestry and Timber Bureau (F&TB), Department of
National Development (1 and 2). For three of those years the writer of this thesis was Officer in Charge of the section. The method suffers from a number of serious shortcomings as will be made apparent but i t had to be straightforward, simple to manipulate and easy to grasp, at least in its application, since i t was intended for use by small contractors. In fact i t has rarely been used by these people directly,possibly because i t
represented a too generalised approach to costing which, in particular circumstances, might give misleading answers. However they frequently consult officers of the F&TB
about what should be the costs of their machines under their own conditions or of new machines which they may
think of buying. In other words the costing procedure has become a yardstick against which supposedly actual costs or costs predicted by other methods could be compared.
The costing system is used by the F&TB as an aid in assessing a logging operation or in comparing different logging methods or for that matter any mechanised forestry operation (3) in any given set of conditions. By refining
2
procedures over the years,taking account of local variations, i t has been assumed that greater accuracy has been achieved. Whatever its accuracy may be i t has been used as the basis of all the reports and predictions of both hardw.ood and softwood logging research sections where costs have been derived and discussed over recent years , and has exercised strong influence over many people involved in logging.
does provide a basis for estimating likely costs provided certain basic data can be ascertained. Frequently getting the basic data is a major difficultly since many small
logging contractors have no systematic cost accounting
system.
However estimating likely costs sufficiently accurately is essential for a number of reasons:
(i) Checking the allowed logging costs as estimated by a forestry authority using a stumpage appraisal
system which takes these costs into account.
(ii) Ensuring that when tendering for or accepting a contract the contractor will recover all his operating costs and overheads, has allowed
sufficient for depreciation of the assets employed to protect the capital invested in those assets and will have sufficient surplus to make a profit. The contractor might also take into account the possibility of capital accumulation to expand his business i f this is feasible.
(iii) Even in districts where there is a well defined going-rate for logging operations and the final rate, which may be above or below the going rate, is struck by negotiation , the contractor should try to estimate his . likely costs otherwise he might find himself working for wages or less.
Recording actual costs
When work is under way a contractor ought to record his actual costs, although the mere recording of these costs will be of l i t t l e value un~ess the costs are not only
recorded systematically but allocated accurately to a
specific operation, e.g. felling, trimming, cross-cutting, snigging , loading, carting and so on; and, i f possible, to a specific product, e.g. pulpwood, sawlogs or peelers,
which may have very different market values per unit volume. Actual costs should then be converted to unit costs e.g.
snigging costs may be calculated from the total labour, machinery and overhead costs , then expressed in terms of unit volume and/or unit volume per unit distance snigged i f this gives a better representation of how the operation is going.
expansion can be built up. This is, of course, the basis of budgetary control systems in which estimated costs are checked from time to time against actual costs, either at regular intervals or, for example, for particular capital purchases of uncertain delivery date spread over a period at indefinite intervals within that period. The optimum
frequency of checking would depend upon the nature of the costs, the rate at which they are likely to change, the size of the organisation and other factors. For a small contractor in hardwood logging operations in Eastern
Australia, where wide variations in logging conditions can occur from day to day, a check once per week might not be too often whilst in the jarrah bush of Western Australia where more uniform conditions prevail once per fortnight or per month might suffice. A common period in industry is a month. In the hardwood logging industry effective
budgetary control systems would be almost unknown.
Allocation of costs to each phase of a logging operation Logging consists of a number of different operations all of them interrelated but each having different cost
4
characteristics. Some, such as felling, trimming and cross-cutting using conventional tools such as chainsaws are
labour intensive whilst others, such as snigging and loading might entail expensive equipment and be capital intensive. I t is important at the planning stage of a logging operation, when major decisions must be taken regarding the road
system to be installed and the method of logging to be employed, that reasonably accurate allocations of costs between the various phases of logging can be made. For example an optimum solution to the problem of road spacing in logging operations can only be derived i f the variable snigging cost and the cost of road construction and haulage can be determined accurately (4,5 and 6). Very l i t t l e of this kind of analysis has been done in Australia, not
because i t would not be useful but because the basic cost data are inadequate or not in the form required.
Machine costs in logging are important even in countries with low labour costs such as those of south and central
Africa and southeast Asia since logs are so heavy and
of machines. Furthermore low labour costs are usually associated with poor diet; men on a poor diet cannot do
the hard physical work which relatively unmechanised logging would consistently demand, and a logging company or
contractor is often compelled to mechanise for this reason. In Australia widespread mechanisation of logging operations started in the decade before the second World War, gained impetus in the decade after the war in response to the heavy demand for timber for housing, sagged for a while when the demand slackened and the market became more dis-criminating, but has gained impetus again since the credit squeeze of 1961/62 as a condition of survival in an
increasingly competitive industry. High labour costs and a distaste for logging work, are also exerting strong pressures to mechanise more thoroughly.
Methods of stating machine costs
Machine costs may be stated in a number of ways, e.g. chainsaws or tractors at so much per hour, vehicles at so much per mile. However the logging contractor also needs to know his machinery costs in terms of the unit in which he is paid for his work, e.g. per unit volume of wood in
the case of sawlogs, per unit weight or per unit volume of stacked wood in the case of pulpwood. This implies a know-ledge of likely production rates for any given area. Often past experience can help but i t may be misleading i f new
ideas, methods and machines are being developed. Rule of thumb methods and past experience may throw l i t t l e light on likely costs and production rates for proposed logging
operations which have dissimilarities to previous operations. Such a situation is implicit in the proposed chip export
programmes for the Japanese pulp industry.
At Eden , on the south coast of New South Wales, extensive areas of predominantly silvertop ash
EuaaZyptus
sieberi,
yellow stringybarkE
.
mueZZeriana
and monkey gumE
.
aypeZloaarpa
from which sawlogs and sleeper logs have been removed for many years are to beclear-felled to provide chips. The trees which are to be removed
•
are mainly those which have been rejected in the past bycutters going through for sawlogs either because they were
be too defective. Logging in these areas will be different from most hardwood operati ons for a number of reasons some of which may be summarised as follows:
(i) The areas are to be clearfelled, instead of selectively logged for sawlogs only.
(ii) The yield per acre will probably be higher than in the previous selection logging operations in the Eden district but the trees removed will genera1ly be smaller. On the other hand where messmate stringybark
Eu
aaly
ptu
s
obl
iqua
occurs t here will be many big, matur e and overmatur e trees. Me s·sma te s tr ingyb ark has never been utilised by south coast sawmillers because of r ing shake and gum veins.(iii)The percentage defect in the smaller trees and big overmature trees is unknown. The percentage defect at which i t becomes uneconomical to log at the negotiated prices is unknown.
(iv) Although these areas have yielded sawlog~ for many years on a "cutter selection system" many of the previously rejected trees will yield sawlogs. These will have to be sorted out either in the bush or at the chip factory and sent to local sawmills assuming the financial yield to the Forest
7
y Commission from a givenlog as a sawlog is better than that from the same log producing chips. However i t seems likely the quality of logs delivered to the Eden sawmills will improve. It will be more profitable to sell many of the poorer quality sawlogs, currently delivered to these mills, as pulp logs.
All the above factors and a number of others may have an important effect on production rates and unit costs.
The extent of their influence can only be surmised.
Productive and unproductive time
6
In order to determine hourly owning and operating costs
what is meant by ' an hour' in the context of logging
operations should be defined. This is important whin doing time studiep and deriving production data and unit costs from them. There is a variety of interpretations and some confusion within the industry and amongst those who have an interest in the industry in one way or another such as
Forestry Departments, machinery manufacturers and distributors ,
service agencies and such like. Hardwood logging operations r ctrely run smoothly for a number of reasons many of them
example, the extreme variability of conditions which can be encountered from one area to another and indeed from hour to hour within the same area often prevents the free flow of logs from the stump to the landing and on to a truck. Many different jobs have to be done and frequent practical, sometimes unpredictable difficulties have to be surmounted. The factory or production engineer 's ideal of a controlled flow of material preferably with long runs , so that all machines and all phases of the ~reduction process are working as a system at optimum efficiency, is impossible
in the conditions of hardwood logging in Australia. Men and machines often stop for a number of reasons such as
inadequate planning and organisation, insufficient incentive for workmen to do their best, or as a result of delays such as some kinds of mechanical breakdowns which could not have been foreseen.
as avoidable;
The two former conditions will be described the latter, assuming ·that preventative
maintenance is done, might fairly be described as unavoid-able. In practice i t is sometimes difficult to distinguish between the two kinds of delays although they do have an
important bearing when trying to measure efficiency and productivity.
The standard working week in Australia is forty hours or eight hours per day. It would be misleading to assume men and machines work this amount in hardwood logging. The machines would frequently do less since there is s t i l l
quite a lot of work in all phases of logging in which machines have l i t t l e or no part, such as measuring logs, reconnoitring the ground, aligning spur roads and siting snig tracks and landing dumps. Actual machine working time, as distinct from the potential working time of forty hours per week, is defined as the number of hours per day during which the engine is running and the machine is doing productive work. This can give a machine time efficiency rating which can be a useful indicator, subject to certain qualifications, of either the overall efficiency of an operation or the level of effective mechanisation. An example of the former would be a crawler tractor snigging and loading logs and working six hours per day, in which case the efficiency rating
average for most hardwood logging operations in Australi a. If time study revealed the crawler tractor was only working four hours per day then the machine time eff iciency rati ng would be only 50% and one might perhaps suspect mismanage-ment, inadequate supervision , insufficient incentive t o
machine operators , a low level of preventative maintenance, a machine which was too big for the log allocation, or
other factors leading to lost t ime. An example of an efficiency rating
in Appendix 2.
taken from an actual t i me study i s gi ven 8
In many cutting operations in eucalypt pulpwood a
chainsaw may only work for about two hours per day, i n whi ch case the machine time efficiency rating would be only 25%. However, the chainsaw operator might be emp loyed for t he rest of the day in debarking with an axe and stacking
billets into pallets by hand, so that whilst the chainsaw is not fully utilised i t is nonetheless a much cheaper item of equipment than a crawler tractor and would not necessar -ily have to be used as intensively to ensure profitabili ty. Nonetheless the low machine time efficiency rating may
indicate a low level of effective mechanisation.
Costs throughout this thesis are based on the actual productive time worked, unless otherwise stated. An
example will clarify the intent. If a tractor works six out of the eight hours per working day then hourly costs can be determined from annual, monthly weekly or daily costs by dividing by the appropriate number of hours, e.g. Depreciation
Total number of working days per year= 200 Number of productive hours per day
Total hours worked annually Hourly cost
Fuel and oil
Number of hours per week Hourly cost
Other distinctions should be made .
=
6 =1200= Annual depreciation 1200
=
=
30Weekly fuel and oil costs
30
logging equipment, f i t timing devices to their machines. These tractor clocks only come into effect at high engine idling speeds but cannot distinguish between productive and unnecessary work and are sometimes unreliable on old machines. These times should not be used in costing
procedures or productivity studies but can be useful as
'built-in' supervisors or, under certain circumstances, for giving a rough comparison between different operators using the same machine under similar conditions.
Manufacturers and distributors also talk about machine availability. If the total number of possible hours= x
= y and the time lost through repairs and maintenance
Machine availability
=
100(~)%X The only lost time deducted is for repairs and maintenance, so that machine availabilities may be as high as 95% and although poor management and unskilful operation may reduce the availability, time, lost for other reasons is not taken into account.
Fixed and variable or owning and operating costs
Hourly owning and operating costs will vary according to the manner in which the logging contractor provides
himself with the necessary machinery. There are three ways of doing this whether the machinery is new or secondhand. These are:
(i) outright cash purchase
(ii) an initial deposit of 25% or more of the cash purchase price, the rest on hire purchase
(iii) leasing.
Leasing may have some advantages and has been used over recent years by some of the bigger logging contractors, or sawmillers, who have sufficient collateral and security of tenure to satisfy a finance house and have a big enough and consistent throughput of logs to ensure a leased machine can work profitably for both the lessor and the lessee. The
rate of interest currently levied by the finance houses for supply of the necessary funds is about 13.5%. Leasing will be discussed in more detail later.
contractor purchases either for cash or by hire purchase, hourly machine costs may be divided into two categories. These are:
(i) fixed costs associated with ownership of the machine ,
(ii) variable costs associated with operating the machine
Fixed or owning costs consist of depreciation,* hire purchase charges, interest on capital, registration,
insurance and garaging.
10
Variable or operating costs consist of repair and
maintenance charges, fuel and oil bills, tyre replacements, and road tax i f this is related to mileage, as i t usually is for logging vehicles.
Associated costs
There are three other important costs associated with the use of machinery which may have characteristics of both fixed and variable costs. These are operators' wages,
workers' compensation insurance and overheads.
Wages may be paid on a time basis, i.e. so much per hour, per day or per week irrespective of the output of the machine, in which case they may be regarded as a fixed cost although they are in fact an operating cost. On the other hand machine operators may be paid on a piecework or
incentive bonus scheme relate-d to the output of the machine in which case wages may be regarded as a variable cost.
Workers' compensation insurance payments in Australia are set as a fixed percent of the gross wages paid so that these again may be a fixed or variable cost depending on the way in which wages are determined. Because of the poor safety record in the logging industry Workers' compensation
insurance payments are a very important item of the total labour cost.
Overheads are often a difficult cost to allocate
accurately. In the case of a small logging contractor who will either do most of his own clerical work or get his
wife to do i t , actual cash outflows which can be debited to overheads are usually quite small. In the present analysis they will be estimated as 25% of the wages bill for any one machine and may therefore be either a fixed or variable
cost. This is in accordance with the procedure adopted and retained by the F&TB. The writer has no additional
[image:25.832.31.816.38.1057.2]information to suggest that thi s is anything but a reasonable figure. Because of the variability in wage levels, workers' compensation insurance premiums and overheads throughout
Australia, i t is intended to use figures pertaining to N.S.W. throughout the thesis. Where incentive bonuses are paid
they can have only a limited effect in most small logging operations, certainly in the eastern States, where
contractors are usually restricted to a particular volume of logs per year. In a normal year logs should f low into the mill from month to month at as even a rate as possible. However during extended wet periods log deliveries will
drop and i f the sawmiller becomes concerned about the
level of log supplies needed at the mill an incentive scheme may encourage his logging crews to put more time and effort into maintaining supplies at a safe level. In the north eastern ranges of Victoria, snow prevents logging of the valuable alphine ash stands
Eucalyptus delegantens
i
s
for about four to five months of the year and some additional financial incentive may be necessary to keep men working hard for the remaining months of the year to ensuresufficient log stocks are held at the mill to keep i t
working throughout the year. Nonetheless where a contractor is working on a fixed log allocation and, assuming there
are no great variations in logging conditions from one year to the next, wages, workers' compensation insurance payments and overheads should be reasonably predictable,
at least for one year in advance. Where climatic conditions are very variable, particularly with respect to rainfall, accurate predictions may become more difficult. Severe and prolonged wet weather can create havoc in even the best planned operations causing serious delays and
CHAPTER 2
FIXED COSTS WHEN PURCHASING FOR CASH OR HIRE PURCHAS~NG
Introduction
Fixed costs have been defined in Chapter 1 as those associated with ownership of a machine. If machines are leased i t is possible for the lessee to have fixed costs
without ownership in the form of fixed monthly lease charges under a net lease agreement. Basically fixed costs are
those costs which the owner or lessee of a machine should take into account irrespective of how much work the machine does. For an owner these are depreciation, hire purchase charges, interest on capital, registration, insurance and garaging. For a lessee they are the fixed monthly lease charges. Since leasing is s t i l l comparatively new to the logging industry I propose to discuss this in Chapter 3. Chapter 2 will deal with fixed costs for cash and hire purchase only.
Depreciation
There are a number of different forms of depreciation and methods of determining i t . The actual depreciation of any machine is the difference between the original purchase price and the resale value at disposal. The hourly
depreciation may then be averaged by dividing this figure by the number of hours worked by the machine. This can only be calculated in retrospect. P~t in another way depreciation may be defined as the loss in value as a result of wear and tear or obsolescence, which cannot be restored by current maintenance. In practice, of course, depreciation provisions are or should be made out of
earnings in advance of disposal.
The process of depreciation from an accountant's
point of view involves making charges against incoming cash flows so that by the end of the life of a machine an
amount sufficient to replace the machine has been retained in the business either as cash or other assets. If the
original machine was bought for cash depreciation should cover the original purchase price plus an additional amount for the increased cost of a similar or improved replacement. A replacement usually costs more than the original machine for a number of reasons, the main ones being:
(i) that manufacturers want to recoup the additional costs of improvements arising from research and development. Occasionally research and
development might allow manufacturers to reduce the cost to the purchaser but in practice logging machines have been increasing in cost for many years so that depreciation should take account of this factor:
(ii) inflation
If the original machine was acquired through hire
purchase the contractor needs to cover, through depreciation, his deposit plus some of the increased cost of a similar or improved replacement at least sufficient to maintain his equity in the same proportion ~sin the original purchase. If in fact he can increase this proportion his capital will have appreciated.
capital.
If the proportion drops he is consuming
If a contractor leases a machine he does not need to concern himself with provision for depreciation.
does this, but recovers i t in the monthly rental.
The lessor
There are a number of methods of calculating provision for depreciation. Those which I intend to describe are:
(i) The straight line
(ii) The declining balance or diminishing value
(iii)The sum of the years' digits
(iv) The sinking fund.
The symbols used in the development of the formulae are P
=
purchase priceR
=
resale value at the end of the machine's life n=
economic life in yearsN
=
number of years of depreciation from date of purchaseThe straight line method
Depreciation is assessed at an even rate per year, based on an assumed life of the machine. This method has
the advantage of simplicity and is widely used because of this .
The annual depreciation provision= P - R n The book value of the machine at the
end of year N
=
P - N ( P - R) nThe declining balance or diminishing value method
14
Depreciation is calculated as a percentage of the book value of the machine at the beginning of each financial year. This percentage may vary from year to year e.g. 30% in the first year, 20% in the second year and so on, but quite often i t is a fixed percentage throughout the life of the machine. There will always be some residual book value.
If the depreciation rate is series is generated and the rate
constant, a geometric
=
1 1- [ : ] n
or
1:
nn
If this rate is multiplied by 100 the percentage depreciation is obtained and the book value at the end of year N
The sum of the year's digit method
= P (1 - depreciation N
rate)
This allows a faster rate of depreciation in the early years and may leave no residual book value. It is derived by adding up the digits of the number of years of the
depreciation period, e.g. 1 + 2+ 3+ 4+ 5+ 6+ 7+ 8 = 36
and allowing depreciation in the first year at 8/36 of the capital cost, in the second year at 7/36 and so on until the final year's depreciation would amount to only 1/36 of
The sinking fund method
This takes into account that money has a time value, i.e. that a given sum at a particular date is worth more than an equal and certain sum at a later date since i t permits profitable investment between the two dates. The
full amount of capital invested in a machine will however only be recovered at the end of the machine's life.
Let A= sum set aside each year as depreciation provision
r = rate of interest
n = the life of the machine.
The sum of A arising at the end of the first year will have grown to A (l+r)n-l by the end of the life of the machine. Similarly the sum A arising at the end of the second
year will have grown to A (l+r)n-2 by the end of the life of the machine and so on.
If S = the total termi~al value of all the depreciation pr6visions plus interest then
S = A(l+r)n-l + A(l+r)n-2 • • • • + A(l+r) + A (i) If we multiply both sides of the above equation by (l+r) then
S ( l+r) = A(l+r) n + A(l+r) n-1 . . . A(l+r) 2 + A(l+r) If we subtract (i) from (ii) then
s
( 1 + rJ -s
= A(l+r)n -A Sr = A[(l+r)n -1] ands
= All!_+r)n -1]r
(ii)
(iii) Where A is a series 0 f 1 ( e . g . $1 per year) then equation
(iii) is written conventionally as S / = n r
n ( l+r) -1
r (iv)
where S i s the symbol for the terminal value of an annual payment of 1 per year for n years at r% p.a. S can be
n/r
presented in tables, giving its value for any values of r and n.
From equation (iv) the annual investment necessary to accumulate $1 at the end of n years
=
1s
n/rSince P-R = the depreciation provision for a machine then the annual investment necessary to provide this sum P-R at the end of n years
=
P-R s16
annual depreciation provision= (P-R)r
(l+r)n-1 ( V)
I t would , of course, be possible to take into account the time value of money without assuming the same annual
depreciation provision but this would involve separate calculations for each year.
Comparison of various methods of depreciation
Table 1 shows how the various methods of providing for depreciation would work out for a machine costing $55,000, a 'logging' life of eight years and a resale value at the end of eight years of $13,000 . In the sinking fund
calculations the rate of interest has been taken as 6% since the return from a safe investment need not be less than this in Australia. In an expanding organisation
depreciation provisions could be used within the business and would earn substantially more than 6% but since most
hardwood logging operations are not expanding I have adopted ,
a conservative approach and assumed a 'safe' return on depreciation provisions.
Table 1
Depreciation Provisions
Year l 2 3 4 5 6 7 8
Straight line method at 12½%
per year 5250 5250 5250 5250 5250 5 2 5_o 5250 5250
Declining balance method at 16½%
per year 9075 7578 6327 5283 4412 3684 3076 2568
Sum of the years
dig;i.ts 9333 8167 7000 5833 4667 3500 2333 1167
Sinking fund at 6% interest
-
per year 4244 4244 4244 4244 4244 4244 4244 4244Increases in the purchase price of logging machinery as these affect depreciation
The purchase price of logging machinery , in common with many other goods has been increasing over the years in
[image:30.827.37.816.23.984.2]sufficient for depreciation unless he takes account of this. I t is impossible to say precisely what the rate of increase has been but some indication can be given from the Overseas Trade Bulletin No. 65 of the Commonwealth Bureau of Census and Statistics which gives values of
exports from and imports into Australia each year. These values are determined on a "free on board (f.o.b.) port of shipment" basis so that all charges , 1.n particular freight and insurance, incurred after the goods have been exported from the port of shipment are not included. The value of goods imported is the amount on which duty is payable or would be payable i f the duty were 'ad valorem'.*
Crawler type tractors have been selected for comparison since these are commonly used throughout the bush. The
figures in Table 2 are for all tractors of the type specified imported into Australia for the years shown.
*Value for duty is the f.o.b. port of shipment equivalent of either
(a) the actual price paid or to be paid by the Australian importer plus any special deductions (transactions value); or
(b) the 'current domestic value' of the goods; whichever is the higher.
'Current domestic value' is defined as 'the amount for which the seller of the goods to the purchaser in
Table 2
'F.o . b., 12ort of shi,Ernent', values for a selected range of crawler tractors irn,Eorted to Australia in 1957/58 and 1967/68
,
Crawler ty12e tractors 1957/58
1967/68 Category No . Tot. value Unit
No. Tot. value Unit Increase Gross % increase in
in $000 Cost in $000 Cost in unit unit
cost over 10 year
cost period
45- 60HP 719 3614 5026
2627 52
10001-15000 lbs . ( shipp
-ing wt . ) 527
4033 7653 6l- 85HP 291 2718 9340
15001-25000
3304 35
l bs .
194 2453 12644 86- 170HP 333 4542 13640
25001- 40000
5669 42
l bs .
320 6179 19309 Over 170HP 18 390 21667
I--' 0) 40001- 60000
5465 25
l bs .
From Table 2 the weighted average% increase= 43.84 The compound rate of increase per annum
=
3.7%This rate of increase will be inaccurate for a number of reasons. These include:
(i) Since 1965/66 the Bureau of Census and Statistics has changed the basis on which crawler tractors categorished, i.e. from horsepower to shipping weight. Nonetheless the two are related and I have been able to make comparisons.
are
(ii) I have selected from the exhaustive figures of the Bureau of Census and Statistics only those which
relate to tractor sizes commonly found in hardwood logging operations. However the import figures pertain to all crawler tractors, not those
specifically brought in for logging, and the distribution by weight or horsepower for all tractors and those for logging will differ. There is no way of resolving this.
(iii) The rate of increase of 3.7% excludes the effect of increases in freight and insurance from port o f shipment, charges at port of arrival and
dealers and distributors' charges.
Figures derived from a major crawler tractor distributor in New South Wales suggest t hat 3.7% may be too low.
3 shows this.
Table
Table 3
Increase in purchase price of two models of crawler tractor from 1964 to 1969
Increase Gross
in
in-Wholesale price wholesale crease price in 5 yr
1964 1969 period
Model I A' 35,752 43,499 7,749 21. 7 % Model I BI 83,338 106,383 23,045 27 . 7%
Compound rate of lincrease
per annum
4% 5%
The size of tractor r epresented by Model 'B' is s t i l l uncommon in logging operations. Model 'A' i s a popular machine
throughout hardwood logging operations so that a rate of
increase in the wholesale price of crawler tractors of 4% will be used in subsequent calculations.
Returning to our previous example of a logging machine costing $55,000 in the year x having a logging life of eight
20
years and a resale value at the end of that period of $13,000,
the replacement cost in the year x+8 will have risen to
$75 , 271 increasing at the rate of 4% per year. The
depreciable amount is therefore $62,271, and Table 4 shows
the depreciation provisions for the four methods described.
Table 4
Depreciation provisions making allowance for
increase in the purchase p rice of 4% p.a.
Year 1 2 3 4 5 6
Straight line
method at
12~% p.a. 7784 7784 7784 7784 7784 7784
Declining balance method at
19.7%p.a. 14828 11907 9562 7678 6165 4951
Sum of years
digits 13838 12108 tl..0379 8649 6919 5189
Sinking
fund 6291 6291 6291 6291 6291 6291
an
7 8
7784 7784
3975 3192
3460 1730
6291 6291
The machine costing $75,271 in year x+8 will be an
improved version of that costing $55,000 in year x although
i t will carry the same designation. It may be bigger and
more powerful and have refinements such as power steering,
power braking, some kind of automatic or semi-automatic
transmission, more comfortable seating arrangements, better
safety canopies and protective devices, especially for
those machines such as crawler tractors which have to move
the· logs from stump to roadside , and so on. There has
been a tendency amongst logging contractors in recent years
in Australia either to purchase a particular model with
which they are familiar despite the increasing price and
despite the fact the model itself may be a more powerful
and complex machine than its predecessor; or, as the
difficulties of logging have increased in the less accessible
areas , to purchase bigger, more powerful and more expensive
by the F&TB in 1960 and 1965 i l lustrate this tendency . (7) Since there was no legal compulsion to submit returns the data will be incomplete. However the State Forest Services cooperated in both censuses so that the figures will at
least give a reliable guide .
Tab le 5
Number of crawler tractors by horsepower classes*
Horsepower 0-49 50-99 100-149 150-199 Total number
class of tractors
1960 Census 797 1011 199 35 2042
Horsepower 0-50 51-100 100-150 150 class
319 874
1965 Census 379 53 1625
Table 6
Number of rubber-tyred tractors by horsepower classes*
Horsepower 0_49 class
1960 census 797 797
Horsepower 0- 50HP 51-100 101-150 class
1965 census 408** 63 7** 478
*Rated engine horsepower according to the makers' specifica -tions. The horsepower classes are those given in each
census. The slight difference from census to census is unlikely to affect the distribution . seriously.
** These figures also include articulated tractors and
conventional tractors with half tracks, none of which had been introduced to Australian logging operations in 1960.
A justification for re-investing in more powerful , more expensive machines is they should be more productive and unit costs need not necessarily increase. Whether this applies to Australian hardwood logging operations or not, restricted logging contracts wi l l certainly reduce the effect which more productive machines and more productive methods of using them might have.
Selection of a method of depreciation
22
In most hardwood logging operations gross receipts would not
vary very much from year to year, apart from increases
arising from general inflation, the contractor would receive
a monthly cheque for logs delivered and provision for
depreciation assuming cash purchase might best be made on
a same amount per year basis, i.e. the straight line or
sinking fund method although such provisions will not keep
pace with actual depreciation in the early years. The
other two methods recommend themselves for investments which
pay large early returns diminishing later on. The large
initial provisions for depreciation also reflect more
accurately the rapid loss in actual saleable value of a
machine early in its life.
A tractor distributor in New South Wales has provided
the left hand half of Table 7 to show the drop in value
year by year. The right hand half shows the resale value
which the distributor would be willing to offer in normal
circumstances on a $55,000 crawler tractor, the depreciation
derived from these values, and the annual provision
necessary for this depreciation, assuming these provisions
earn no interest.
Year
1
2
3
4·
5
6
7
8
Table 7
Resale value of a $55,000 crawler tractor
for a life of eight years
Resale value Resale value Depreciation as a % of the
purchase price
73 40,150 14,850
58 31,900 23,100
43 23,650 31,350
38 20,900 34,100
32 17,600 37,400
28 15,400 39,600
24 13,200 41,800
20 11,000 44,000
The most obvious characteristic of Table 7 is
Provision for
depreciation
14,850
8,250
8,250
2,750
3,300
2,200
2,200
2,200
the very
rapid rate of depreciation in the first three years,
closely approximated by either the declining balance
most
of the years digits method. A comparison of the book values
determined by the various methods of depreciation discussed
previously and the resale value suggested by the tractor
dealer is given in Table 8 and the accompanying Figure 1.
The increasing cost of
a
replacement has not been taken into account.Table 8
Resale value year by year according to tractor distributor and book values as determined by
different methods of depreciation for a $55 ,000 crawler tractor having a resale value of $11,000
after 8 years
Book values
End of Year
Resale value according to
dealer
Straight
line
Declining Sum of balance year' s
deprecia- at 18.2%p.a. digits
tion
1 40150 49500 44977 45222
2 31900 44000 36781 36667
3 23650 38500 30078 29333
4 20900 33000 24596 23222
5 17600 27500 20115 18333
6 15400 22000 16449 14667
7 13200 16500 13451 12222
8 11000 11000 11000 11000
Sinking
fund
50554 45841 40846
35550
29937
23988
17681
11000
From Figure 1 the sum of the years digits method gives
the book value closest to the dealer's resale value. However,
i t does mean large provisions for depreciation in the
early years of the machine's life and this might impose a serious handicap on a small logging contractor of limited
financial resources and a fixed log quota. If he is assured
of security of tenure of contract he would probably prefer
to use a method of depreciation which involves making the
same provision each year. However if he went out of
business in the earlier years of the life of the machine he
would have to make up a substantial deficit between the
book value and the actual resale value.
he might be forced into bankruptcy.
60
50
40
30
..:::0
10
Resale or book value in thousands of dollars
1 2 3
Figure 1
Book value by various methods of depreciation
compared with dealer's resale value
Declining balance at 18.2%
Sum of the years' digits
resale value
fund at 6%
Straight line
4 5 6 7 8
Age in years
Hire purchase
The discussion on depreciation has assumed a logging contractor will pay cash for the entire purchase price of a
machine. In fact i t is more common for contractors in
hardwood logging operations to acquire machines through some
kind of hire purchase arrangement. These arrangements are controlled by State government legislation and may vary from time to time according to the financial condition of
the State concerned. Such is the huge volume of hire purchase business transacted throughout Australia, State governments can exercise strong fiscal influence on the country's economy by controllong hire purchase rates of interest and the maximum periods for which agreements may run, e.g. larger minimum deposits with high hire purchase rates of interest and short pay-back periods will tend to
reduce consumer demand. Conversely, easy credit will
stimulate demand. Depending on the ·financial strength of a potential borrower, money-lenders may also vary hire
purchase ·conditions within the limits imposed by State
governments. The Commonwealth may also exert influence by its control of credit, the bank rate, government bond rate,
statutory reserves and so on.
The next three paragraphs summarise the situation in
the latter half of 1970. The information has been derived from correspondence with the Australian Finance Conference
and other interested bodies.
Statutory ceiling rates of interest on hire purchase
vary between States. New South Wales imposes a maximum flat rate of 7% per year for new equipment such as crawler
tractors and rubber tyred skidders and 9% for used equipment. The finance companies would generally regard 7% as too low.
Queensland has a maximum rate of 20% simple interest per
year but the usual flat rate on new logging equipment would
be about 8%, on used equipment about 10%. There are no
ceiling rates in other States but rises in industry borrowing
rates as a result of monetary measures of the commonwealth
government to damp down inflation would suggest that interest
rates would be at least 8%.
Tasmania is the only State which sets a maximum
25
companies would keep repayment periods on logging equipment
to between three and four years, possibly five years in
very favourable circumstances.
Statutory minimum deposits again vary. These are 10%
of the purchase price in New South Wales, South Australia
and Queensland, 20% in Tasmania, and no statutory deposits
in the other States. Industry practice however would
regard a 25% deposit as satisfactory on new equipment, 33 1 /3%
on used. A logging contractor may, of course, pay
consid-erably more than this to reduce interest charges on the
outstanding debt.
Hire purchase agreements may attract additional charges.
In New South Wales and the Australian Capital Territory the
customer has to pay stamp duty equal to 1¼% of the total
funds borrowed. In all other States the finance companies
are responsible for stamp duties. Other additional charges
may be associated with insurance though in the logging
industry this would only apply to road vehicles or equipment
such as a rubber tyred skidder which i t is intended to move
under its own power along a road. In such cases finance
companies would insist the hire purchaser takes out
comprehensive insurance.
The time period over which hire purchase payments must
be made could be a crucial factor in the economy of a
logging operation where a contractor only owns one or two
machines and where the volume of logs, hence the gross
receipts, is strictly controlled and may vary l i t t l e from year to
year. For example let us assume an initial cash purchase
price of $55,000 of which the contractor pays $13,000 leaving
$42,000 to be borrowed on hire purchase (a) over three years
(b) over five years both at 9% p.a. flat rate of interest.
annual repayments of capital and interest
=
17780 over three years= 12180 over five years
( a) ( b)
as compared with annual provisions for depreciation over
eight years when purchasing for cash of $6291.00 per year
assuming the contractor establishes a sinking fund,
Leinvesting this amount each year at 6% p.a. to cover