Exciton-Polariton Gap Solitons in Two-Dimensional Lattices
E. A. Cerda-Me´ndez,1,*D. Sarkar,2,†D. N. Krizhanovskii,2S. S. Gavrilov,3K. Biermann,1 M. S. Skolnick,2and P. V. Santos1
1Paul-Drude-Institut fu¨r Festko¨rperelektronik, 10117 Berlin, Germany 2
University of Sheffield, Sheffield S37RH, United Kingdom 3Institute of Solid State Physics, Chernogolovka 142432, Russia
(Received 23 May 2013; revised manuscript received 16 August 2013; published 2 October 2013)
We report on the two-dimensional gap-soliton nature of exciton-polariton macroscopic coherent phases (PMCP) in a square lattice with a tunable amplitude. The resonantly excited PMCP forms close to the negative massMpoint of the lattice band structure with energy within the lattice band gap and its wave function localized within a few lattice periods. The PMCPs are well described as gap solitons resulting from the interplay between repulsive polariton-polariton interactions and effective attractive forces due to the negative mass. The solitonic nature accounts for the reduction of the PMCP coherence length and optical excitation threshold with increasing lattice amplitude.
DOI:10.1103/PhysRevLett.111.146401 PACS numbers: 71.36.+c, 42.65.Yj, 63.20.kk, 73.21.Cd
The periodic spatial modulation of a medium creates an artificial band structure with energy gaps and anomalous (i.e., negative) dispersion. In the presence of nonlinearity, spatially self-localized states may appear within the energy gaps as the result of the interplay between the anomalous dispersion and interparticle interactions. This takes place when the kinetic energy contribution [EK ¼ 2@2=ð2m
b2Þ] due to localization of particles with a negative mass mb within a radius compensates the repulsive interparticle interaction energyEI. These states, known as gap solitons (GSs), are metastable solutions of the Gross-Pitaevskii equation [1]. GSs have been explored in optical fibers [2], nonlinear photonic crystals [3–6], atomic Bose Einstein condensates (BECs) in optical lattices [7,8], and, very recently, also in the hybrid light-matter polariton system [9]. Polaritons result from the strong coupling of photons and quantum well (QW) exci-tons in a semiconductor microcavity (MC). Being bosonic light-matter quasiparticles, they advantageously combine features from both species. Namely, the small mass arising from the photonic component allows them to form polar-iton macroscopic coherent phases (PMCPs) at low den-sities and high temperatures, while the interexcitonic interactions provide a nonlinearity several orders of mag-nitude stronger than in purely photonic systems [10]. While GSs in one-dimensional (1D) potentials have been extensively studied [2,3,5,7–9], GSs in 2D lattices have so far only been reported for purely photonic systems [4,6]. GSs in 2D potentials are qualitatively different from their 1D counterparts, for example, opening the way to the realization of novel topological phases [6,11].
In this Letter, we demonstrate the formation and ma-nipulation of GSs of PMCPs in a 2D tunable lattice. The studies were carried out in PMCPs resonantly excited in a tunable square lattice created by surface acoustic waves (SAWs). While PMCPs in a homogeneous MC normally
appear at the lowest energy state with zero in-plane momentum, PMCPs in a shallow (i.e., low amplitude) lattice have a GS character and are excited via the accu-mulation of particles at critical points of negative mass and energy above the ground state [12]. The PMCP forms close to the negative effective massMstates of the lattice band structure, its energy lies within the band gap and its wave function is localized within a few lattice periods, i.e., over a region smaller than the optical excitation area. By taking advantage of the tunability of the acoustic lattice, we show that increasing the lattice amplitude reduces the coherence lengthLcohas well as the optical threshold power (Pth) for
the excitation of the PMCP. These properties are well described using a simple analytical energetic model [7,13]. The sample is an (Al,Ga)As-based MC [14] where a 170170m2sinusoidal square lattice is created by inter-fering two SAWs [Fig.1(a)]. The MC consists of two Bragg reflectors [stacks of (Al,Ga)As=4layers with a different index of refraction] embedding a =2 cavity with three pairs of 15 nm-thick GaAs QWs ( is the wavelength of the confined photon). SAWs with wavelength SAW¼ 8m, frequency of 370 MHz, and propagation velocity of3m=nswere excited by acoustic transducers deposited on the sample surface. The formation of the lattice results from the modulation of the excitonic band gap and the microcavity optical resonance by the SAW strain field [14]. The polaritons were resonantly excited within a 70 m spot using a single-mode, continuous-wave Gaussian pump laser delivering photons with energy Epump¼1:5353 meV and in-plane momentum kpump¼
ðkpx; kpyÞ ¼ ð0;1:7Þm
1. The studies were performed
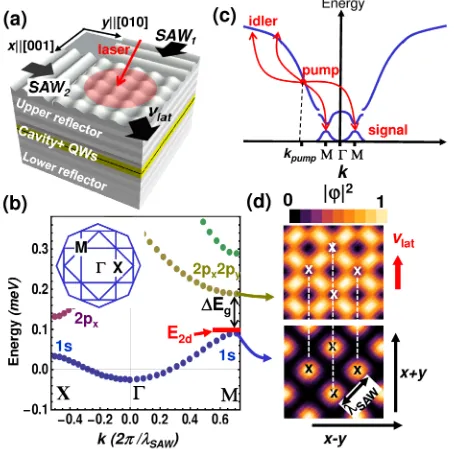
[cf. inset Fig. 1(b)] [15]. Figure 1(b) displays the band diagram along theX!!Mdirection calculated for a shallow lattice, where the curvature of thes band inverts close toX andM. In the shallow lattice, where the modu-lation amplitude 2SAW¼0:1 meV is smaller than the energetic width of the lowest branch ð@kSAWÞ2=2mp 0:4 meV (mp¼6105m
e and me are the polariton
mass atand free electron mass, respectively)Xis a saddle point with positive massmpalongX!Mand negative mass mb¼ 0:5ðmpSAW=@Þ2Eg along X! [see
Supplemental Material (SM), Sec. I, [16]]. Here, Eg 2SAWis the energy gap between the first and second folded
bands [14]. M, in contrast, has a negative effective mass equal tomb along bothM!andM!X.SAW can
be controlled by the radio-frequency powerPrfapplied to the
acoustic transducers sinceSAW/
ffiffiffiffiffiffiffi
Prf
p
[14].
The lattice emission properties below Pth are
summa-rized in the leftmost panels of Fig.2. Thek-space image of Fig. 2(a) is dominated by the bright spots around kpump, which are the diffracted replicas of the pump polariton state. Since this image is not energy resolved, the emission around k¼ ð0;0Þ appears as a weak and unstructured background. The white lines delineate, for reference, the contours of the first four MBZs, as in Fig.1(b).
The real-space emission map in Fig. 2(b) shows an intensity distribution reflecting the Gaussian shape of the pump laser beam. Finally, Fig.2(c)displays the PL spectral distribution along the slit delineated in panel (b). The broad energy range of the emission indicates that the level popu-lation belowPthessentially reflects the polariton density of
states and is mainly governed by incoherent (multistep) energy relaxation rather than by direct scattering of parti-cles from the pump states.
FIG. 1 (color online). (a) Square lattice for polaritons created by the interference of two surface acoustic waves (SAWs) propagating along the x^¼ ½010 andy^¼ ½001surface direc-tions of a (100)-(Al,Ga)As MC. The lattice moves along the
ðx^þyÞ ¼ ½^ 110 direction with a velocity of vlat¼pffiffiffi2vSAW, wherevSAW¼3m=nsis the SAW phase velocity. (b)
One-particle band structure for polaritons in a shallow lattice (SAW¼50eV). E2d denotes the soliton energy and wave vector range. The energy is relative to the bottom of the un-modulated dispersion. The inset is a diagram of the first four mini-Brillouin zones of the square lattice. (c) Schematic repre-sentation of the OPO process in the modulated polariton disper-sion along!M. The pump state is generated by tuning the laser energy and angle of incidence. Above the threshold of formation of the PMCP polaritons scatter into the signal and idler states, as indicated by the arrows. (d) Calculated squared moduli of the wave functionjcj2of the1sand2p
x2pystates at
the M point. The crosses mark the minima of the potential lattice. The whole pattern moves along the vertical direction with velocityvlat.
FIG. 2 (color online). (a)k-space PL image of an incoherent polariton gas. The red point at kp¼ ðkpx; kpyÞ ¼ ð0;1:7Þm1
marks the pump state, which was blocked during the experiment. The PL peaks at k¼ ðkSAW; kpyÞ ¼ ð0:78;1:7Þm1 and at k¼ ðkSAW; kpykSAWÞ ¼ ð0:78;0:9Þm1are the diffracted
pump beams. The white lines delineate the first four MBZs. (b) Real-space PL image of an incoherent polariton gas at a pump power P‘< Pth. (c) Spatially resolved spectrum along the slit in (b). The dotted lines mark the positions of the lattice
sandpstates. (d)–(f) and (g)–(i) are the corresponding images at
P‘¼Pthand atP‘¼1:4Pth. The image intensities were
[image:2.612.316.558.48.353.2] [image:2.612.62.291.49.274.2]A closer examination of Fig. 2(b) also reveals faint diagonal lines, which trace the paths of the moving sites of the lattice [cf. Fig.1(a)] [15]. The PL from the lowest energy bonding (s) and anti-bonding (p) lattice states in Fig. 2(c) are spatially shifted (white lines) in agreement with the calculations in Fig.1(d). The latter shows that the maxima of the s and pwave functions follow separated paths [17].
For higher excitation intensities, a PMCP forms via an optical parametric oscillator (OPO) process [18] depicted in Fig. 1(c). Here, polaritons in the pump state scatter into states with a lower (signal) and a higher (idler) energy conserving energy [2Epump¼EsignalþEidler] and in-plane
wave vector [2kpump¼ksignalþkidler]. Interestingly, the ex-perimentalk-space map of Fig. 2(d)shows that the signal PMCP in a shallow square lattice forms at the negative mass M points [i.e.,ksignal¼ ð0:5;0:5ÞkSAW), cf. Fig.1(c)].
Further results included in the Supplemental Material (Sec. III) [16] prove that the formation of a PMCP atMis insensitive to the orientation of kpump with respect to the
lattice and that all theM-point peaks emit at the same energy within the experimental spectral resolution of 60eV. The real space map of Fig. 2(e) indicates that the PMCP emission extends over approximately three central lattice sites with an intensity orders of magnitude stronger than below Pth. Finally, the spectrum in panel (f) shows the energy blueshift and linewidth reduction characteristic of the formation of a PMCP.
The OPO stimulated scattering requires a critical density N2D;min of signal particles. Since no selective scattering takes place below Pth, the preferential accumulation of particles at M is attributed to its anomalous (negative) dispersion. This behavior contrasts to PMCPs in unmodu-lated MCs, whereN2D;minis typically achieved by particle
accumulation close to the minimum of the dispersion [i.e., ksignal ¼ ð0;0Þ].
In order to determine the energy of the PMCP relative to thesandpband states, we have increasedP‘to1:4Pth
to enhance the residual emission from these states. The amplified insets of the energy region below and above the PMCP [boxes in Fig.2(i)] reveal that the emission peaks of the PMCP are aligned with the positions of thesstates and displaced with respect to thepstates. Although the exact PMCP emission energy cannot be determined due to the limited spectral resolution, Fig.2(i)shows that it appears above of thesand below thepbands.
So far, we have shown that the PMCP forms close to the negative-massMstates of the lowest energy band. Another important feature is the limited size of the PMCP wave function, which is quantified by the spatial coherence length Lcohof the PL.Lcohcan be extracted from thek-space maps in Fig. 2 by using Heisenberg’s uncertainty relationship xk2, wherex¼Lcohandkis the full width at half maximum (FWHM) of the emission peaks. At threshold [cf. Fig.2(d)],Lcoh27m3SAW coincides with the
diameter of the real-space image in Fig. 2(e). A 40% increase in P‘ doubles the PMCP diameter [Fig.2(h)], but changes only slightly the FWHM of the diffraction peaks [cf. Fig. 2(g)], thus indicating thatLcohis essentially inde-pendent of the total size of the PMCP.
While the preferential accumulation of particles at M results from the negative mass, the formation of a PMCP with a limitedLcohis attributed to the excitation of a GS in
the shallow lattice. The GS consist of a superposition ofM states with an energyE2d within the band gap and close to the top of thesband. The observation of a large emission area (Lcoh) for light fluxes above threshold [cf. Fig.2(h)]
can thus be accounted for by the excitation of several GSs with similarLcohat random positions of the potential.
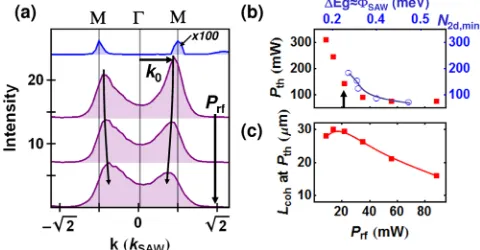
The tunability of the potential provides a powerful tool to investigate the dependence of the GS properties, in particular those related to self-localization, on the lattice amplitude SAW. Figure3(a) compares k-space intensity profiles along M!!M for the pump and signal PMCP states recorded along the dashed lines in Fig.2(g). The coordinatek0of the peaks in the pump profile (topmost
line) defines the limits of the 1st MBZ and does not change withSAW. The GS peaks (lower lines), however, broaden,
and their maxima k0 move inwards within the MBZ. Both
features are ascribed to the self-localization of the GS wave packet, as discussed in detail below. Sincek0 for the pump
replicas remains fixed for all SAW, we conclude that the
k-space configuration of the GS is mainly determined by its particle density and by SAW, rather than by interactions
with the pump states.
It is notable that increasing SAW also reduces the optical threshold Pth for GS excitation, as indicated by
FIG. 3 (color online). (a) Intensity profiles along aM!!M direction [cf. dashed lines 1 and 2 in Fig.2(f)]. The topmost curve for the diffracted pump beam (line 1) defines the limits of the first MBZ. The additional curves are profiles for the signal PMCP (line 2) in lattices created withPrf¼22, 35, and 56 mW (from the second to the bottom curves). (b) Experimental dependence of
Pth on Prf (squares). The empty circles show the calculated
dependence of the minimum number of polaritons N2d;min to
form the soliton withSAW. The line is a guide to the eye. The
[image:3.612.317.557.460.585.2]the squares in Fig.3(b). This behavior can be understood by settingEIðN2dÞ ¼N2dg2d=2in the equalityE
IðN2dÞ ¼EK defined in the introduction, whereN2dis the particle number and g2d>0 their characteristic interaction constant. The latter yields a number of particles in a stable GS ofN2d ¼ 2@2=ð2g
2dmbÞ. Sincejmbjincreases withSAW(see SM,
Sec. I [16]), N2d, and consequently Pth, must decrease.
Finally, Fig. 3(c)shows that the reduction in Pth withPrf
is accompanied by a decrease of the value of Lcoh at
threshold.
In order to quantitatively support the GS description we have used a variational approach [13] to calculate metastable states in a square lattice defined by a potential Vðx; yÞ ¼ SAW½cosðkSAWxÞ þcosðkSAWyÞ. This approach has
been shown to be compatible with numerical solutions of the Gross-Pitaevskii equation for BECs out of equilibrium [7]. Despite the fact that the OPO is a nonequilibrium three-state system, this simple approach gives a consistent physical picture of the main experimental findings by describing only the energetic configuration of the signal PMCP state. The results are also well reproduced by full numerical solution of the Gross-Pitaevskii equation (see Supplemental Material, Sec. II [16]). We assume a trial wave function consisting of Bloch states of the square lattice with an envelope function given by
2dðx; yÞ ¼
ffiffiffiffiffiffiffiffi
N2d r2 0
s
2eðx2þy2Þ=ð2r2 0Þ ðeðk0r0Þ2þ1Þ
cosðk0xÞcosðk0yÞ: (1)
This expression includes, in addition to the Gaussian term with widthr0proposed in Ref. [13], two oscillating cosine terms with wave vectork0.r0 is related to the coherence lengthLcohof the state byLcoh¼
ffiffiffiffiffiffiffiffiffiffi
2 ln2 p
r0.
Figure 4(a) displays the energy for the state 2d as a function of the parametersr0 andk0 calculated for a fixed
number of particlesN2d. The ground state corresponds to the extended (s) band state atk0¼0andr0 ! 1(out of
the scale of the plot). The potential landscape also exhibits a valley indicated by the dashed line. For particular combi-nations ofN2dandSAW, local minima (M1andM2) may appear within this valley. These minima correspond to GS states with coherence lengthLcoh, effective wave vectork0,
and energy within the lattice band gapEg[cf. Fig.1(c)]. WhileM1 is a GS localized within a single unit cell,M2is an extended mode spreading over several lattice unit cells (see Supplemental Material, Sec. IV [16]). The position of the minima changes withN2dand/orSAW.
The PMCP at the M point reported in this work is ascribed to an M2 GS mode with k0< kSAW=2¼
=SAW andLcohof a few SAW periods. The open circles
in Fig.4(b) display the dependence of k0 of M2 on Lcoh
(open circles) calculated for a fixed value of N2d while varying SAW. The squares display the corresponding
experimental values obtained from Fig. 3(c) (i.e., k0 vs
Lcoh). The calculations reproduce well the observed
displacement of the PMCP k-space peaks with SAW. Physically, the reduction of k0 withLcoh is analogous to the downwards shift in frequency of a harmonic oscillator with increasing damping. Finally, the model can also qualitatively account for the observed reduction of Pth
with increasingPrfdisplayed in Fig.3(b). Here, the circles
show that the calculated minimum particle numberN2d;min
required for the formation of the M2 states reduces as SAW increases.
In conclusion, we have presented experimental evidence for the gap solitonic nature of PMCPs resonantly excited in a 2D shallow tunable lattice. The soliton PMCP forms at a critical point of negative mass due to the combined effects of particle attraction and repulsive interparticle interac-tions. This work opens the way for the study of lattice vortex solitons and other polariton quantum phases such as a Bose glass.
The authors wish to thank L. Schrottke and D. Skryabin for fruitful discussions and A. Tahraoui, S. Rauwerdink, W. Seidel, and B. Drescher for sample processing. This work was supported by ESF-POLATOM Grants No. 5111 and No. 5369, EPSRC Grants No. EP/G001642 and No. EP/ J007544, DFG Grant No. CE 191/2-1, EU ITN Clermont 4 Grant and RFBR Grant No. 13-02-12139.
*ecerda@pdi-berlin.de
†Present address: Universidad Auto´noma de Madrid,
Madrid, Spain.
[1] Y. V. Kartashov, B. A. Malomed, and L. Torner,Rev. Mod. Phys.83, 247 (2011).
[2] B. J. Eggleton, R. E. Slusher, C. M. de Sterke, P. A. Krug, and J. E. Sipe,Phys. Rev. Lett.76, 1627 (1996).
[3] W. Chen and D. L. Mills,Phys. Rev. Lett.58, 160 (1987). [4] J. W. Fleischer, M. Segev, N. K. Efremidis, and D. N.
Christodoulides,Nature (London)422, 147 (2003). FIG. 4 (color online). (a) Energy map of the state defined by Eq. (1) (color scale) as a function of parameters r0 and k0
calculated forN2d¼150polaritons, SAW¼200eV,mp¼
6105m
e, SAW¼8m, and particle interaction constant g2d¼10eVm2. M1 and M2 mark local energy minima
corresponding to GS solutions. The white line is a guide to the eye. (b) Experimental (squares) and calculated (circles) depen-dence of thek-coordinates of the maxima of the emission of peaks
k0onLcoh. The red squares are the experimental points obtained
[image:4.612.319.559.47.151.2][5] D. Neshev, E. Ostrovskaya, Y. Kivshar, and W. Krolikowski,Opt. Lett.28, 710 (2003).
[6] D. N. Neshev, T. J. Alexander, E. A. Ostrovskaya, Y. S. Kivshar, H. Martin, I. Makasyuk, and Z. Chen, Phys. Rev. Lett.92, 123903 (2004).
[7] E. A. Ostrovskaya and Y. S. Kivshar,Phys. Rev. Lett.90, 160407 (2003).
[8] B. Eiermann, T. Anker, M. Albiez, M. Taglieber, P. Treutlein, K.-P. Marzlin, and M. K. Oberthaler, Phys. Rev. Lett.92, 230401 (2004).
[9] D. Tanese, H. Flayac, D. Solnyshkov, A. Amo, A. Lemaıˆtre, E. Galopin, R. Braive, P. Senellart, I. Sagnes, G. Malpuech, and J. Bloch,Nat. Commun.4, 1749 (2013). [10] D. M. Whittaker,Phys. Rev. B71, 115301 (2005). [11] R. Driben and B. A. Malomed, Eur. Phys. J. D 50, 317
(2008).
[12] A. Gorbach, B. Malomed, and D. Skryabin,Phys. Lett. A
373, 3024 (2009).
[13] B. B. Baizakov, B. A. Malomed, and M. Salerno,
Europhys. Lett.63, 642 (2003).
[14] E. A. Cerda-Me´ndez, D. N. Krizhanovskii, M. Wouters, R. Bradley, K. Biermann, K. Guda, R. Hey, P. V. Santos, D. Sarkar, and M. S. Skolnick,Phys. Rev. Lett.105, 116402 (2010).
[15] E. A. Cerda-Me´ndez, D. N. Krizhanovskii, K. Biermann, R. Hey, M. S. Skolnick, and P. V. Santos,Phys. Rev. B86, 100301 (2012).
[16] See Supplemental Material at http://link.aps.org/ supplemental/10.1103/PhysRevLett.111.146401 for details. Here, the calculation for the expression for the effective mass at the band edges mb, the numerical solution of the Gross-Pitaevskii equation, the experimental results for excitation with different pump orientation and the calculations of the gap soliton wave functions are shown. [17] Althoughjcj2 has been calculated atM, the profiles are
essentially the same over the whole branch.