UNIVERSITI TEKNIKAL MALAYSIA MELAKA
Design satellite simulation tool using Matlab
This report is submitted in accordance with the requirement of Universiti Teknikal Malaysia Melaka (UTeM) for the Bachelor of Electronic Engineering Technology
(Telecommunication) with Honours
By
NUR NABILAH BT MOHD AKHIR B071210252
930903085094
i
DECLARATION
I hereby, declared this report entitled “Design Satellite Simulation Tool by using Matlab” is the results of my own research except as cited in references.
Signature :
Author’s Name :
ii
APPROVAL
This report is submitted to the Faculty of Engineering Technology of UTeM as a partial fulfilment of the requirement for the degree of Bachelor of Engineering Technology (Bachelor of Electronic Engineering Technology (Telecommunication)) (Hons). The member of the supervisory is as follow:
iii ABSTRAK
Komunikasi adalah pemindahan maklumat dari sumber ke destinasi seperti penghantar kepada penerima. Komunikasi satelit adalah contoh yang terbaik untuk komunikasi wayarles.
iv ABSTRACT
v DEDICATIONS
To my beloved parents
Mohd Ahir B.Mohd Isa
Supiah Bt Jaafar
To my supervisor
vi ACKNOWLEDGEMENT
I would like to express my sincere to my supervisor En. Abd Halim B Dahalan for the continuous support of my bachelor degree project for his patience, motivation, and immense knowledge. His guidence helped me in all the time of research and writing of this thesis. I could not have imagined having a better advisor and mentor for my bachelor degree project.
Beside my supervisor, I would like to thank the rest of my thesis support: En Chairulsyah B Wasli for his comments and guideline towards my project.
I thank my fellow friends for the stimulating discussion, for the sleepless nights we were working together before deadlines, and for all the fun we have had in the last four years.
vii TABLE OF CONTENT
Declaration vii
Approval vii
Abstrak viiii
Abstarct iv
Dedications v
Acknowledgement vi
Table of Content ix
List of tables x
List of figure xii
CHAPTER 1: INTRODUCTION 1.1 Background of the project 1
1.2 Problem statement 2
1.3 Objective(s) 2
1.4 Scope 2
1.5 Organization of the project 3
CHAPTER 2: LITERATURE REVIEW 2.1 Introduction 4
viii 2.2.1 A nowcasting integrated display platform for
FY satellite data based on Matlab GUI 4
2.2.2 Research on satellite interference geolocation based on satellite system 5
2.2.3 Research and performance simulation on a carrier recovery
phase error detection algorithms in satellite communications 5
2.2.4 Satellite design model based on modularization 5
2.3 Theory of satellite performance
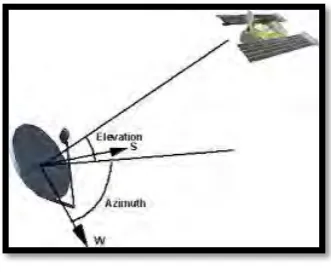
2.3.1 Look angle
2.3.1.1 Angle of elevation 6
2.3.1.2 Azimuth angle 6
2.3.2 Link design 7
2.3.3 Uplink & downlink 7
2.3.4 Link budget 9
2.3.5 Interference
2.3.5.1 Interference types 11
2.3.5.2 Source of interference 11
2.3.5.3 Cause of interference 12
2.3.6 Matlab graphical user interface (GUI) 12
CHAPTER 3: METHODOLOGY
3.1 Method
3.1.1 Method that had been used
ix
3.1.1.2 Book 14
3.1.1.3 Internet 15
3.2 Flowchart of project planning 16
3.2.1 Literature review 17
3.2.2 Data collection 18
3.2.3 Design and simulation 21
3.3 Gantt chart 22
CHAPTER 4: RESULT AND DISCUSSION
4.1 Result
4.1.1 Introduction 23
4.1.2 Result of project 23
4.2 Discussion
4.2.1 Introduction 26
4.2.2 Coordinate 27
4.2.3 Look angle 28
4.2.4 Link budget 29
CHAPTER 5: CONCLUSION
5.1 Introduction 32
5.2 Conclusion Chapter 3 32
x
REFERENCE(S) 35
xi LIST OF TABLES
3.1 Information of satellite 19
4.2.1 Comparison look angle 29
4.2.2 Comparison value of Gt, Pt, and Lf 30
4.2.3 Comparison parameter of path loss 31
xii LIST OF FIGURES
2.1 Azimuth angle 7
2.2 Uplink and downlink 8
2.3 Block diagram uplink 8
2.4 Block diagram downlink 9
2.5 Uplink and downlink interference 11
2.6 Simple GUI 13
2.7 GUIDE of GUI 13
3.1 Flowchart of planning the project 16
3.2 Uplink and downlink 17
3.3 Satellite communication earth station 18
3.4 Characteristic of MEASAT 19
3.5 Chracteristic of Palapa-D 19
3.6 Characteristic IRNSS-1D 20
3.7 Chracteristic Optus 20
4.1.1 Design of satellite GUI 23
4.1.2 Simulation of GUI 24
4.1.3 Location of ES1 and ES2 with Sat A 24
4.1.4 Path loss of Langkawi with 14GHz 25
4.1.5 Path loss of Pahang with 13GHz 25
4.1.6 Path loss of Johor with 12.2GHz 26
4.2.1 Elevation and azimuth angle 28
1
CHAPTER 1
INTRODUCTION
This chapter presents an overview of the project. This chapter will explain about the background project, problems statements, objectives of the project, scope of project, and the outline report.
1.1 Background of the project
2
1.2 Problem Statement
In the present, an engineer had difficult to get information for satellite communication design. Like coordinate and performance of the satellite and earth station on the map (world). Otherwise, it is also difficult to get accurate location and performance from satellite to earth station by using calculation. For example, the formula of look angle likes azimuth angle and elevation angle and link design like equivalent isotropic radiated power (EIRP) and path loss. Last but not least, nowadays tool for satellite are expensive.
1.3 Objective(s)
The main objective of this project is to design satellite simulation tool by using GUI in the Matlab. In order to make this project successful, the objectives have been declared these objectives must be achieved in completing this project. Objectives are a guidance of any project, so the objectives have been listed below:
1) To study the coordinate satellite (MEASAT) and earth station 2) To analysis satellite performance by using GUI in Matlab software 3) To develop simulation of satellite communication design.
1.4 Scope
3 position of satellite and earth station in the map (world). Lastly, to perform the simulation by using GUI software this is because it is easy to analyse than calculate by using formula so that it can make sure the simulation tool well function as stated in the objective.
1.5 Organization of the project
This report will be conducted in few chapters and each stated as below:
Chapter 1: Introduction
This chapter will simply introduce about the project. This chapter contains introduction, objectives, scope of project and problem statement.
Chapter 2: Literature Reviews
This chapter shows about the studies and research that relevant to the project.
Chapter 3: Methodology
This part will show the flow about the project methodology used in this project.
Chapter 4: Result and Discussion
This chapter will talk about the discussion of the result of the project.
Chapter 5: Summary and Conclusion
4
CHAPTER 2
LITERATURE REVIEW
2.1 Introduction
In this chapter, reviews of the previous researches project that are related with this project will be discussed. The information will be become additional source for the project in becoming more successful. To have a brief understanding of the researches related to the project, a few literature reviews had been done. This chapter will describe the related literature reviews based on the project.
2.2 Past Related Research
The main sources for this project are the previous project and thesis that related to the project. The aim of this chapter towards this project it is still same but the tool their uses are different.
2.2.1 A nowcasting integrated display platform for FY satellite data based on Matlab GUI
5 2.2.2 Research on satellite interference geolocation based on satellite system.
In this article (2009), author want to introduced new method of earth surface passive geo-location with TDOA (Time Differential of Arrival) for fixed interfering source where it is based on traditional way. In this article also it has more focus to study the method which includes introducing temporary variable, and analyzing its performance. In this article had use Matlab to do the simulation where the result proves that the new method is able to reduce the computations and the possibility of not clear solution. It is also study the relationship between the interference source location and the precision of the geo-location results for quadruple satellite system at the precision of 10 and 20ns. (Han Jianying)
2.2.3 Research and performance simulation on a carrier recovery phase error detection algorithms in satellite communications
In this article (2007), it is about how to the deduce the general architectures of recovery loop, which is based on the maximum aposteriori estimation. Next, it also introduced and analyses the characteristic of the carrier phase error detection algorithm and carrier recovery loop in high speed demodulator using in satellite communication. To get the result this article had used the Matlab simulation that obtained the figure between the phase demodulation characteristic and the theory calculation thus at the end the result shows that under low signal-to-noise ratio situation, QPSK is more appropriate to this carrier recovery loop (Zhang Zhenchuan).
2.2.4 Satellite design model based on modularization
6 cooperation simulation platform and apply it into new concept satellite. The software that had been used to construct the powerful platform of satellite integrative modelling, simulation and analysis is Matlab (DU Yunxi).
2.3 Theory of satellite performance
2.3.1 Look angle
Look angle is required such that the earth station antenna points or “looks at” the satellite directly. From a location on earth, the 2 look angles that are needed are Azimuth and angle elevation. Angle of elevation and azimuth both depend on the latitude of the earth station and the longitude of both earth station and the orbiting satellite.
2.3.1.1 Angle of elevation
The angle of elevation is the angle formed between the plane of a wave radiated from an earth station antenna and the horizon, or the angle delimit at the earth, station antenna between the satellite and the earth’s horizon. The smaller the angle of elevation, the greater the distance a propagated wave must pass through the earth’s atmosphere. Otherwise, if the angle of elevation is too small and the distance the wave is within the earth’s atmosphere is too long, the wave may down to a degree that it provides insufficient transmission.
2.2.1.2 Azimuth angle
7 Figure 2.1: Azimuth angle
2.3.2 Link design
Link design is a communications subsystem that involves a link between a transmitting earth station and a receiving earth station via a communications satellite. The four factors related to satellite system design:
1. The weight of satellite
2. The choice frequency band
3. Atmospheric propagation effects
4. Multiple access technique
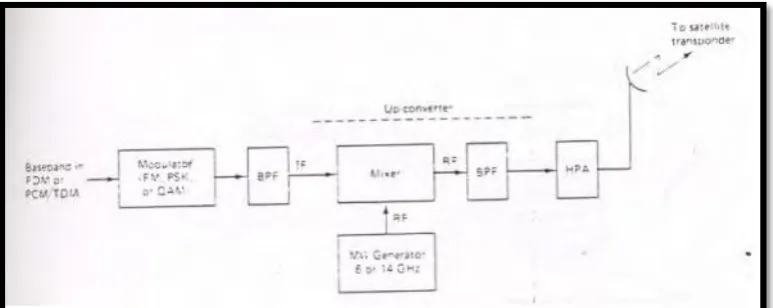
2.3.3 Uplink & Downlink
8 Figure 2.2: Uplink & Downlink
The uplink section of a satellite system is the earth station transmitter consist of an IF modulator, an IF to RF microwave up-converter, a high-power amplifier (HPA) and filter. In figure 2.3 shows the block diagram of a satellite earth station transmitter. Where IF modulator converts the input baseband signals to either an FM, a PSK, or a QAM modulated intermediate frequency. The up-converter converts the IF to an appropriate RF carrier frequency while the HPA provide enough input sensitivity and output power to propagate the signal to the satellite transponder.
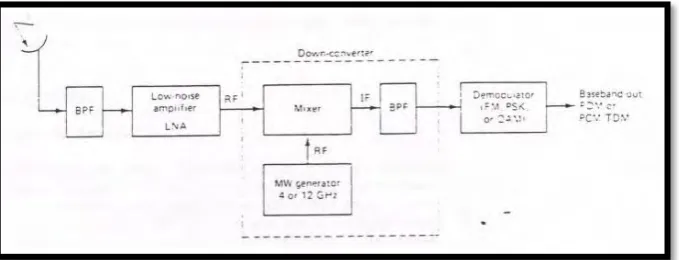
[image:21.595.118.505.542.696.2]9 Downlink is an earth station receiver includes an input BPF and low noise amplifier (LNA) and an RF-to-IF down-converter. In figure 2.4 shows a block diagram of earth station receiver. The BPF is to limits the input noise power to the LNA where the LNA is highly sensitive like tunnel diode amplifier. Next, the RF-to-IF down-converter is a mixer/bandpass filter combination which converts the received RF signal to an IF frequency.
Figure 2.4: Block diagram downlink
2.3.4 Link budget
Link budget is calculated of all the gains and losses from the transmitter, through the medium (waveguide, fiber, etc.) to the receiver in a telecommunication system. The satellite link is composed primarily of three segments:
1. The transmitting earth station and the uplink media; 2. The satellite; and
3. The downlink media and the receiving earth station.
10 C/N = C- 10log(kTB)
Where:
C = Received power in dBW
K = Boltzman constant, 1.38*10-23 W/0K/Hz
B = Noise bandwidth (or occupied bandwidth) in Hz
T = Absolute temperature (0K)
The link equation in its general form is:
C/N = EIRP – L + G – 10log(kTB)
Where:
EIRP = Equivalent isotropically radiated power (dBW)
L = Tranmission losses (dB)
G = Gain of the receive antenna (dB)
2.3.5 Interference
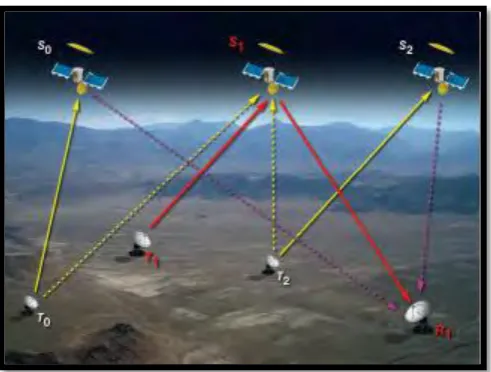
The interferences are mainly caused by the secondary lobes in the radiation pattern of the antennas. The interference is mainly concern on:
11 Figure 2.5: Uplink and downlink interference due to small-antenna-aperture terminals. S1 is the desired satellite and S0 and S2 are the adjacent satellites: T1 and R1 are the transmit and receive terminals that communicate with S1 and T0 and T2 are the transmit terminals that are linked to S0 and S2 respectively.
2.3.5.1 Interference types:
- Digital
- Cross Polarization
- TDMA
- Intermodulation
2.3.5.2 Source of interferences:
- Neighbouring customer
- Adjacent Satellite
[image:24.595.206.452.71.257.2]