Prediction of bulk particle breakage due to naturally formed shear bands
Colin Hare
and
Mojtaba Ghadiri
Citation:
AIP Conf. Proc.
1542, 487 (2013); doi: 10.1063/1.4811974
View online:
http://dx.doi.org/10.1063/1.4811974
View Table of Contents:
http://proceedings.aip.org/dbt/dbt.jsp?KEY=APCPCS&Volume=1542&Issue=1
Published by the
AIP Publishing LLC.
Additional information on AIP Conf. Proc.
Journal Homepage:
http://proceedings.aip.org/
Journal Information:
http://proceedings.aip.org/about/about_the_proceedings
Top downloads:
http://proceedings.aip.org/dbt/most_downloaded.jsp?KEY=APCPCS
Prediction of Bulk Particle Breakage due to Naturally
Formed Shear Bands
Colin Hare and Mojtaba Ghadiri
The Institute of Particle Science and Engineering, The University of Leeds, Leeds, LS2 9JT, UK
Abstract.
In many particle processes there exist both stagnant and flowing regions. Shear bands naturally form between these regions as a transition from zero to full velocity. Particles within shear bands are prone to breakage through surface erosion, chipping and fragmentation when exposed to substantial shear stresses. The precise nature and extent of breakage is difficult to describe mechanistically, due to the distribution of particle strengths and forces acting upon them. Consequently the breakage of particles within shear bands is typically defined empirically using an attrition shear cell. The use of such empirical relationships to predict breakage in larger processes is severely limited in the literature.
This paper describes a method of predicting bulk breakage in an agitated vessel by establishing particle breakage caused by applied stress and strain in a shear cell. The Distinct Element Method (DEM) is utilised to estimate the distribution of stresses and strains within the agitated bed, this distribution is then applied to the breakage relationship to predict total attrition. The DEM analysis requires a number of measurement cells to be considered within the bed. It is imperative that the dimensions of these cells are comparable to that of a naturally occurring shear band. With this measure in place the method outlined here describes the experimental breakage well. This method can be applied to any system where particles break due to shear deformation.
Keywords: Attrition, Breakage, Shear, DEM.
PACS: 83.80.Fg, 89.20.Bb
INTRODUCTION
In many particle processes the movement of particles relative to each other is inevitable. In the transition from relatively stagnant regions to more rapidly flowing regions of a bed, shear bands naturally develop. These shear bands are typically of the order of 5 – 10 particle diameters in length [1]. The contact forces that exist within these regions can lead to significant damage to the particles, ultimately resulting in an undesirable product and reduced efficiency of the process. Several empirical relationships have been developed to describe particle breakage as a function of applied stress and strain [2-4], using an attrition shear cell similar in design to that introduced by Paramanathan and Bridgwater [5].
An example process in which damage occurs due to shear deformation is in agitated drying of active pharmaceutical ingredients (APIs). Following the crystallisation of an API the slurry is commonly filtered and then particles are dried in an agitated contact dryer. Moisture is evolved from the bed by heat supplied to the vessel walls, whilst the bed is gently agitated by a vertically aligned impeller to ensure the remaining moisture is evenly distributed throughout the bed. However this agitation leads to breakage of the API [6], which in some cases may be so pronounced that agitated contact drying is not a viable process route for production. It is therefore of
interest to develop a method for predicting the extent of breakage that would occur during the drying process for a given material, prior to production. This paper introduces a method for predicting breakage in agitated drying, which is applicable to all processes where breakage occurs due to shear deformation.
The extent of breakage during the early stages of drying, when the moisture content is relatively high, is negligible. When the moisture content is low the shear resistance of the bed increases, thus resulting in a significant increase in the extent of breakage [7, 8]. For this reason a completely dry bed is utilized in this work, which represents the end of the drying process.
PREDICTION METHOD
bed. The bed is agitated at a constant impeller speed for a range of rotational times. After each individual experiment the powder is sieved to assess the extent of breakage, which is deemed to be the percentage of material that passes through a 355 m sieve, given the above feed size.
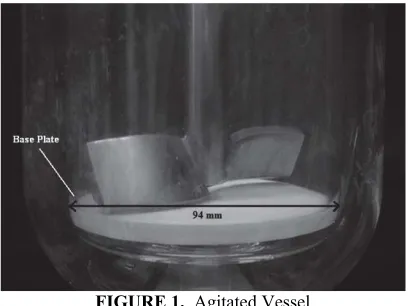
[image:3.612.93.297.246.399.2]In order to predict the extent of breakage from the shearing of Paracetamol in the agitated vessel, the stresses and strain rates in the bed are estimated by DEM. The extent of attrition of the material under varying conditions of stress and strain is established empirically in an annular shear cell, following the method of Neil and Bridgwater [3].
FIGURE 1. Agitated Vessel
DEM STRESS AND STRAIN ANALYSIS
The agitated bed of Paracetamol is simulated using PFC3D (developed by Itasca). The particles are
represented by poly-disperse spheres, with median diameters, dmed, of 2, 3 and 4 mm in separate
simulations, have sliding and rolling friction coefficients of 0.5 and 0.1, respectively. A linear spring contact model is used, with normal and shear stiffnesses of 10 and 8.3 kN, respectively. These particle properties have been shown to provide an adequate representation of the actual agitated bed [10].
The stresses and strain rates are assessed within a sector of the simulated bed for one complete rotation, once the bed has reached a steady-state. This measurement sector is divided radially and vertically into an array of measurement cells, as shown in Figure 2. The stresses and strain rates are assessed using sector sizes (sec) of 10, 25 and 40o, and 2, 3 and 4 cell
divisions (nd). At intervals of approximately 1o of
impeller rotation, the deviatoric stress, , and the strain rate, , are assessed using equations 1 and 2, respectively.
2 2 26
xx yy xx zz yy zz
(1)
2 2
1 2
w w
§ · § ·
¨ w ¸ ¨ w ¸
© ¹ © ¹
v v v
r r z (2)
where is the normal stress acting in direction i on face i, v is the particle velocity in the rotational
direction of the impeller, and r and z are radial and vertical positions, respectively.
[image:3.612.129.481.465.665.2]FIGURE 2. Measurement sectors and cells (a) sec = 10o (b) sec = 25o(c) sec = 40o, (i) nd = 2 (ii) nd = 3 (iii) nd = 4.
1 2
3 4
1 2 3
7 8 9
4 5 6
1 2 3 4 13 14 15 16
9 10 11 12
Stress Distribution
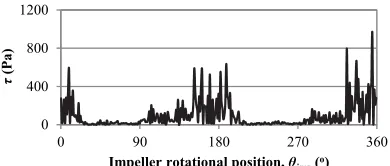
The deviatoric stress variations with impeller rotational position, imp, are shown for cell 3, the
outer-most bottom cell, when sec = 25
o
and nd = 3 in Figure
3. When imp equals 0, 180 or 360o the impeller is
centrally aligned within the measurement sector, as the impeller rotates anti-clockwise imp increases. Figure 3
[image:4.612.96.291.241.324.2]shows that the stress is at a maximum in the vicinity of the blade and decreases in the wake of the blade. The stress is negligible far from the blade and increases from approximately 60o in front of the impeller.
FIGURE 3. Deviatoric stress in cell 3 for sec = 25o
and nd = 3.
The average deviatoric stresses throughout one full impeller rotation in each measurement cell are compared in Figures 4, 5 and 6 for nd = 2, 3 and 4,
respectively. For all values of nd the stresses are
greatest at lower positions in the bed, and increase radially. The stresses obtained in this analysis generally increase when nd is increased, therefore it is
important to specify the appropriate cell size and number..
[image:4.612.96.289.471.558.2]FIGURE 4. Deviatoric stress distribution for nd = 2.
FIGURE 5. Deviatoric stress distribution for nd = 3.
FIGURE 6. Deviatoric stress distribution for nd = 4.
ATTRITION PREDICTION
The attrition of 500 – 600 μm Paracetamol particles was measured under controlled conditions of stress and strain in an annular shear cell. The extent of attrition, W, defined as the mass fraction forming the debris, was determined by classifying product material with a sieve size < 355 μm to be debris. The relationship of W to applied stress and strain was established following the approach of Neil & Bridgwater [5], for stresses of 0.1 – 3.0 kPa and strains of 30 – 240.
ª§ · º
«¨¨ ¸¸ »
«© ¹ »
¬ ¼ N ref W K (3)
where KN, and are empirically determined
constants, ref is a reference failure stress and is
applied strain. For 500 – 600 μm Paracetamol KN,
and are 0.71, 1.28and 0.49, respectively, ref is taken
as the failure stress, which is 0.183 MPa for the Paracetamol [10].
The attrition within the agitated bed is predicted by applying equation 3 to the stresses and strains obtained from each measurement cell at each time interval, consequently the predicted value of attrition in cell c, Wc,n, and throughout the entire bed, WI, after I
rotations, are given by equations 4 and 5, respectively.
1 1 1 n n c ,nc ,n N c ,n c ,n
ref
W K I I
ª º ª º
« » « »
¬ ¼
« »
¬ ¼
¦
¦
(4)1 1
¦¦
c nI c ,n c ,n
W W (5)
where c,n is the mass fraction in cell c at time interval
n. The predicted extents of attrition after one impeller rotation, WI=1, are given for the cases of dmed = 3 mm
and sec = 25
o
in Tables 1 and 2, respectively.
0 400 800 1200
0 90 180 270 360
(P
a
)
Impeller rotational position, imp(o)
0 10 20 30 40 50 60 70
0 1 2 3 4 5
(Pa)
Cell number, c
10° 25° 40° 0 20 40 60 80 100 120
0 1 2 3 4 5 6 7 8 9 10
(P
a
)
Cell number, c
10° 25° 40° 0 20 40 60 80 100 120 140
0 1 2 3 4 5 6 7 8 9 10 11 12 13 14 15 16 17
(P
a
)
Cell number, c
[image:4.612.97.286.588.670.2]TABLE 1. Predicted attrition after one impeller rotation, WI=1×10
2
(%) for dmed = 3mm
sec(o) nd
2 3 4
10 0.99 1.21 1.28
25 0.97 1.14 1.24
[image:5.612.92.289.111.249.2]40 0.96 1.11 1.13
TABLE 2. Predicted attrition after one impeller rotation, WI=1×10
2
(%) for sec = 25
o
dmed(mm) nd
2 3 4
2 0.80 0.95 0.97
3 0.97 1.14 1.24
4 1.08 1.35 1.43
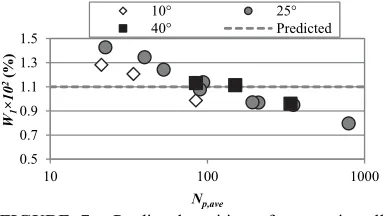
The predicted attrition increases when particle size or the number of cell devisions is increased or when the sector size is decreased. All of these changes result in a decrease in the average number of particles within a measurement cell, Np,ave, therefore the
[image:5.612.96.289.351.459.2]deviatoric stress approaches that of a single sphere. Figure 7 shows the predicted attrition after one impeller rotation as a function of Np,ave.
FIGURE 7. Predicted attrition after one impeller rotation for various sec, nd and dmed.
Figure 7 shows that the predicted attrition is dependent on the average number of particles per measurement cell; decreasing as Np,ave increases. The
initial cell arrangement adopted by Hare et al. [5] of dmed = 3mm, sec = 25o and nd = 3 provides a good
prediction (WI=1 = 0.0114). Under this arrangement
the dimensions of the measurement cell are around 4 to 8 particle diameters in each direction. This is comparable to the width of a naturally occurring shear band, and the bed adopted in the shear cell experiments utilized in this prediction. Therefore this prediction approach provides a good agreement with the experiments, providing the measurement cells approximate the length-scale of the naturally forming shear band phenomena. If the measurement cells are too small or too large then the attrition will be over or underestimated, respectively.
CONCLUSIONS
The attrition caused by shear deformation within an agitated bed has been predicted by analyzing the stress distribution using DEM and coupling this with an attrition function derived from shear cell experiments. The method provides a suitable prediction if the dimensions of the measurement cells in the DEM analysis are representative of the natural shearing phenomenon. If the measurement cells are too small then the attrition is overestimated, whereas it is underestimated if the measurement cells are too large. DEM is frequently used to estimate internal bed stresses, however the dimensions of the measurement regions are often selected arbitrarily. The findings of the attrition prediction method developed here have far reaching implications for the assessment of internal bed stresses, as the length-scale of the averaging procedure is of paramount importance.
ACKNOWLEDGMENTS
This work was funded by an Industrial Case Award by EPSRC and GlaxoSmithKline. This funding is gratefully acknowledged. The project was co-ordinated by Dr Robert Dennehy. The authors are thankful for his support.
REFERENCES
1. D. Stephens, J. Bridgwater, Powder Technology 21(1), 17-28 (1978).
2. C.E. Ouwerkerk, Powder Technology 65, 125-138 (1991).
3. A.U. Neil and J. Bridgwater, Powder Technology106, 37-44 (1994).
4. M. Ghadiri, Z. Ning, S.J. Kenter, E. Puik, Chemical Engineering Science 55, 5445-5456 (2000).
5. B.K. Paramanathan, J. Bridgwater, Chemical Engineering Science 38(2), 197-206 (1983).
6. J. Kukura, B. Izzo, C. Orella, Pharmaceutical Technology (2005).
7. A. Lekhal, K.P. Girard, M.A. Brown, S. Kiang, B.J. Glasser and J.G. Khinast, Powder Technology132, 119-130 (2003).
8. A. Lekhal, K.P. Girard, M.A. Brown, S. Kiang, J.G. Khinast and, B.J. Glasser, International Journal of Pharmaceutics270, 263-277 (2004).
9. C.C. Crutchley and J. Bridgwater, KONA Powder and Particle15, 21-31 (1997).
10. C. Hare, M. Ghadiri and R. Dennehy, Chemical Engineering Science66, 4757-4770 (2011).
0.5 0.7 0.9 1.1 1.3 1.5
10 100 1000
W1
×10
2(%
)
Np,ave
10° 25°