City, University of London Institutional Repository
Citation:
Adland, R. and Alizadeh-Masoodian, A. ORCID: 0000-0003-1588-6214 (2018). Explaining price differences between physical and derivative freight contracts. Transportation Research Part E: Logistics and Transportation Review, 118, pp. 20-33. doi:10.1016/j.tre.2018.07.002
This is the accepted version of the paper.
This version of the publication may differ from the final published
version.
Permanent repository link:
http://openaccess.city.ac.uk/20101/Link to published version:
http://dx.doi.org/10.1016/j.tre.2018.07.002Copyright and reuse: City Research Online aims to make research
outputs of City, University of London available to a wider audience.
Copyright and Moral Rights remain with the author(s) and/or copyright
holders. URLs from City Research Online may be freely distributed and
linked to.
City Research Online: http://openaccess.city.ac.uk/ [email protected]
Explaining price differences between physical and
derivative freight contracts
Roar Adland
Norwegian School of Economics (NHH) Bergen, Norway
Amir H. Alizadeh
Cass Business School London, UK
Abstract
Physical time-charters (TC) and Forward Freight Agreements (FFAs) represent two hedging approaches that differ in terms of risks and physical access to transportation. We investigate the determinants of the time-varying TC-FFA freight rate differential in the dry bulk market. We find that TC and FFA prices are co-integrated but TC rates are generally priced higher than FFAs. The differential is explained by the level and slope of the term structure, a measure of economic ‘stress’ as well as vessel specifications and contractual terms. Finally, the TC-FFA differential is related to default risk premium and the potential convenience yield.
Keywords: FFAs, time-charter, basis risk, convenience yield, default risk.
2
1. Introduction
Agents and participants in the international shipping market have developed and utilised different
types of contracts and tools to control freight market risk. These include long-term period
timecharter contracts, contracts of affreightments and, more recently, freight derivative contracts
such as forward freight agreements (FFA) and freight options.1 The main difference between
physical and financial contracts relates to flexibility and access to transportation. Physical
contracts such as time charters ensure access to a transportation service and a vessel, but they are
not flexible because the underlying vessel cannot be changed, their termination could be costly,
and they are bilateral contracts that are subject to default or counterparty risk. FFA contracts are
flexible in terms of trading and have virtually no default risk when they are cleared, but they do
not provide access to a vessel or transportation service. Nevertheless, both period and FFA
contracts are used for managing spot freight rate exposure by shipowners and charterers.
A large body of the literature has been devoted to investigating different aspects of the FFA and
physical market including Kavussanos and Visvikis (2004a and 2004b), Kavussanos, Visvikis
and Menachof (2004), Kavussanos, Visvikis and Batchelor (2004), Batchelor et al. (2007),
Alizadeh (2013), among others (see Section 2). For instance, Kavussanos, Visvikis and
Menachof (2004) investigate the unbiasedness of FFA prices in relation to determination of
future spot rates and conclude that forward freight rates are unbiased predictors of spot freight
rates. Other studies such as Kavussanos and Visvikis (2004a and 2010) and Alizadeh et al.
(2015) focus on evaluating hedging performance and the interaction between FFA and spot rates.
They use different hedging techniques including constant and time-varying hedge ratios when
hedging spot freight market exposure with FFAs. The general finding here is that the hedging
performance of FFAs is substantially worse than for other commodity and financial markets, a
3
fact which is typically attributed to the non-storable nature of spot freight rates and the
corresponding lack of a cost-of-carry relationship between spot and forward prices.
These early studies (Kavussanos and Visvikis, 2004a and b, and Kavussanos, Visvikis and
Menachof, 2004) were undertaken at a point in the dry bulk FFA market development where the
most active contracts were related to individual routes such that the hedging of spot exposure
was indeed the modus operandi. Within the past decade, such contracts have effectively ceased
trading, with liquidity now focused on longer FFA contracts (quarters or calendar years) settled
on a global weighted average spot rate per vessel size, the Baltic TC averages (Adland and Jia,
2017). The hedging of freight market exposure using such FFA contracts is, by definition, more
akin to using physical TCs, where owners and operators lock in time-charter-equivalent earnings
per vessel for a prolonged period of time.
In this study, we therefore examine, for the first time, the statistical relationship between physical
TC and FFAs. While both alternatives lock in a fixed freight rate for a defined period, the two
approaches carry very different types of risks. Firstly, a time-charter (TC) is a physical contract
that gives the charterer commercial control over a vessel and access to a transportation service,
while a FFA contract is a purely financial cash-settled contract for the difference between a Baltic
Index and the agreed contract rates. If secure access to transportation has value (a “convenience
yield”) then we would expect that TCs are, on average, priced higher than FFA contracts for the
same ship size and period. We would also expect that this differential is positively related to the
state of the freight market, because secure access to transportation will have a lower value
(convenience) during periods of oversupply of ships and low freight rates. This is a general
concept for the forward pricing function in commodity markets, where the underlying asset is
storable and the marginal convenience yield is a decreasing function of stocks held (Brennan,
1958).
Secondly, there are multiple potential sources of cash flow differences (basis risks) due, for
instance, to a) different vessel specifications between the physical vessel and the standard Baltic
type vessel underlying FFA contracts, b) different trading patterns of the physical ship, c) higher
default risk for a single charterer in a TC than the clearing houses standing behind FFA contracts
and d) timing differences in the start and end-dates of the contracts, particularly when TC
contracts have embedded extension options. These sources of risk are likely to be time-varying
4
Our paper has three primary objectives. Firstly, we want to assess whether there is a (potentially
time varying) differential between TC rates and corresponding FFA prices. We assess this
relationship by comparing the standardized fixed-duration TC rates as supplied by shipbrokers
and the FFA prices for an equivalent duration. Secondly, we want to assess whether such
differential is caused by known differences in risks and cash flows (e.g. different vessel
specifications). Thirdly, we want to evaluate whether the differential is dependent on freight
market conditions such that it can be interpreted as a convenience yield in the physical forward
market. For the latter two research questions, we evaluate the differential between realized
individual TC fixtures in the dry bulk market and the FFA price for the corresponding period.
Addressing the above questions are important for several reasons. First, from a theoretical point
of view, a better understanding of the FFA and time-charter markets and their interaction can be
used to specify better models and produce more accurate forecasts for these variables. Second,
from a practical point of view, improved knowledge of the relationship and differences between
time-charter rates and FFAs can help ship-owners, operators and charterers to assess freight
trading tactics, formulate better hedging strategies and enhance the efficiency of their risk
management process. For instance, market participants can use the information on the difference
between FFA and TC contracts to determine the value of period contracts (e.g. time-charter or
contract of affreightment) using FFA curves. Third, shipowners, operators and charterers can use
the results to assess whether apparent arbitrage opportunities between the physical and “paper”
forward freight markets are real or simply a result of time-varying risk premia or physical basis
risks. Fourth, our research is closely related to the important question of default risk in physical
time-charters. Adland and Jia (2008) show conceptually that default risk is strongly related to
freight market conditions and contract duration, with longer contracts fixed during strong
markets at greater risk. By comparing TC rates with “risk free” FFA prices we are able to uncover
a similar risk profile, supporting earlier results in the literature. Finally, the results reveal
important information regarding the adjustment of hedge ratios according to vessel and contract
specific factors when FFAs are used to hedging a vessel’s earnings.
The remainder of this paper is structured as follows: Section 2 reviews the relevant literature,
Section 3 describes our data and methodology, Section 4 contains our empirical results and
Section 5 discusses the implications of our findings. Section 6 summarises the findings and
5
2. Literature review
The maritime economic literature typically treats pricing in the freight derivatives and physical
forward markets separately, even though the dynamics of spot freight rates is the main driver of
both markets. Studies on freight derivatives focus on three main issues: the hedging efficiency
of the contracts (Thuong and Visscher, 1990; Haralambides, 1992; Kavussanos and Nomikos,
2000a, 2000b; 2000c; Kavussanos and Visvikis, 2010; Goulas and Skiadopoulos, 2012), price
discovery and the unbiasedness of forward prices in relation to realized spot rates (e.g.
Kavussanos and Nomikos, 1999; Kavussanos and Nomikos, 2003, Kavussanos and Visvikis,
2004a) and causality viz-a-viz spot freight rates (see, Kavussanos et al, 2004a; 2004b;
Kavussanos and Visvikis, 2004b; Alizadeh et al., 2014). Performed on both the defunct BIFFEX
freight futures and the FFA market, these empirical studies broadly conclude that freight
derivatives have overall poor hedging efficiency, even when allowing for time-varying hedge
ratios, and represent unbiased forecasts only in the short run (1 – 2 months out).
A related branch of the literature focuses on the modelling of spot freight markets using
stochastic models. Examples are the logarithmic mean reverting process proposed by Tvedt
(1997), the stochastic partial equilibrium models of Tvedt (2003) and Adland and Strandenes
(2007) and the non-parametric mean reverting model of Adland and Cullinane (2006).
Prokopczuck (2010) compares the appropriateness of the one and two factor models proposed
by Gibson and Schwartz (1990) and Schwartz (1997) for modelling freight rates. Nomikos et al
(2013) suggest jump diffusion models that can capture the fat tails of freight rate logarithmic
returns. Benth and Koekebakker (2016) further extend these models to account for short-term
autocorrelation, stochastic volatility and non-Gaussian increments in spot rate log-returns, and
investigate whether the theoretical forward curves from this model can recreate observed FFA
curves. Yin et al (2016) apply Vector Error Correction models (VECM) to investigate the
interaction between spot and forward rates in the dry bulk market and includes exogenous
fundamental variables in the model.
Separately, researchers have investigated the determinants of TC rates at the micro level (i.e. for
individual fixtures). Köhn and Thanopoulou (2011) use Generalised Additive models to assess
the impact of variables such as place of delivery, lead time, charter duration, vessel size and fuel
consumption in a non-linear framework. Their empirical results support the notion of price
6
freight rate premium for fuel efficiency in the Panamax dry bulk TC market during the period
2008 – 2012 and find that owners recoup approximately 40% of the fuel savings through higher
rates. Adland et al (2017) perform a similar study on the determinants of dry bulk TC rates for
a much larger sample and find that fuel efficiency is only rewarded in poor market conditions.
An important issue in this context that is not yet well understood, is the influence of time-varying
risk premia in forward freight pricing, both for the physical and derivatives markets. As
discussed in Kavussanos and Alizadeh (2002) this risk premium is thought to arise because
operation in the spot and forward markets involves different levels of risk. Adland and Cullinane
(2005) present a theoretical argument for rejecting the expectations theory for forward freight
pricing and argue that the risk premium must be time varying and depend on the state of the
freight market in a systematic manner. Adland and Jia (2008) present a conceptual model for
how TC default risk how charter market default risk will vary with freight market conditions,
charter duration, and the financial situation of the charterer. Alizadeh et al (2007) show that
while the unbiasedness hypothesis holds for implied forward rates in the physical market (that
is, implied forward rates are unbiased predictors of realized future TC rates), there exists
chartering strategies that profit from capturing cyclical predictable components in the residual.
Koekebakker and Adland (2004) investigate the dynamics of the term structure of freight rates
and its volatility structure.
Overall, the literature review presented here suggests that that the relationship between spot rates,
FFA prices and physical charter fixtures represents a complex interplay between
time-varying risk premia, volatility structures and basis risk such as differing vessel and contractual
specifications. Until now, there has been no attempt at investigating the dynamic relationship
between forward rates in the physical and freight derivative markets or its determinants. From
a theoretical point of view, the two must be co-integrated based on an arbitrage argument. If
FFA rates are substantially higher than the TC rate for an equivalent period and ship, a
ship-operator can sell the FFA contract, charter in the vessel on the TC contract and sublet it in the
spot market or on an index-linked time-charter2. Conversely, if TC rates are substantially higher
than FFA prices, a ship-operator can charter in a vessel on an index-linked contract, charter it
out on a TC and buy the FFA contract. We note that due to the various sources of basis risk, as
detailed in Adland and Jia (2017) and Alizadeh and Nomikos (2009), these strategies would not
7
represent arbitrage opportunities in the true sense, but “statistical arbitrage” opportunities where
the expected profit is positive. Specifically, Adland and Jia (2017) show that the cash flow from
physical operation will never mimic that of the spot indices underlying the FFA market, even for
a large fleet with a geographically diversified trading pattern, due to the lag-effect imposed by
fixed-rate charters.
Our paper fills this gap in the literature based on the following three contributions. Firstly, we
test whether TC rates and FFA prices are co-integrated as a result of their interchangeable use
for freight market hedging. Secondly, we evaluate empirically the dynamics of the differential
between time series of FFA prices and TC rates, addressing the characteristics of the
time-varying risk premium or convenience yield that this differential represents from a theoretical
point of view. Thirdly, we investigate the determinants of the differential for individual fixtures
by controlling for vessel specifications and contractual terms, shedding light on the importance
of physical basis risks in this context.
3. Methodology
According to the Efficient Market Hypothesis (EMH) and the notion of no arbitrage, the
discounted cash flows from a time-charter contract and the equivalent FFA contract - which
covers the duration of the time-charter - should be equal (ignoring, for now, the differences in
risks). Mathematically, we can write the argument as
(1)
where P
t
TC is a P period time-charter rate, P t
FFA is a portfolio of FFA contracts covering P
period, and ert is the discount factor.
In reality, FFAs and physical TCs are close substitutes for freight market hedging, but they are
not identical in terms of risks and “convenience”. There are at least four key reasons for this.
First, a physical contract provides secure access to transportation (i.e. effectively commercial
control over a vessel) while a FFA contract does not. Such a “convenience” should give rise to )
( )
(
0 0
P t P
t rt P
t P
t rt
FFA e
TC
e
8
a premium in TC rates which is higher in strong freight markets when there is potentially scarcity
of tonnage (Adland and Cullinane, 2005). Second, a time-charter is a bilateral contract with
inherent counterparty risk, compared to FFAs which are cleared. Adland and Jia (2008) show
from a theoretical point of view that the TC default risk is higher in strong freight markets and
for longer duration contracts. However, shipowners tend to do their credit check and due
diligence work on the counterparty before entering the agreement, select the best and most
reputable charterers, and avoid charterers with poor credit record. In addition, under a
time-charter contract the payment is made on a fortnightly basis and the shipowner can exercise a lien
on the cargo in case charterers default, or even terminate the contract in case of default.
Nevertheless, there is always a counterparty risk and potential financial loss due to default in the
physical time-charter contract. Third, current and expected market conditions as well as expected
volatility affect the demand for hedging and speculation (Alizadeh, 2013; Alizadeh et al, 2014)
and, consequently, the liquidity in each market. Fourth, time-charter and FFA differentials could
also be related to differences in the specification of the physical asset compared to the standard
ship used to assess the underlying freight for the FFA contract such as size, age, speed and
consumption, delivery and redelivery locations, and extension options embedded in physical
time-charter contracts.
Consequently, we expect that the TC-FFA price differential reverts towards some (potentially
time-varying) mean in the long run, resulting in an overall stationary process. This co-integration
behavior follows from the fact that the two hedging instruments are substitutes. Accordingly,
large price differentials would affect their relative supply and demand and bring prices back into
line.
To statistically test the for the co-integration of the time-charter and FFA rates we employ the
Johansen (1988) cointegration test and perform Likelihood Ratio tests on the restriction implied
by the EMH. Let tct represent the log of TC rate at time t and ffat represent the log of the
equivalent FFA price for the corresponding period. Then the Johansen cointegration test between
9 1 0 1 2 1 1 1 1 , 2 1 , 1 1 ,
0 ( )
t i t tP i i i t P i i
t a a tc a ffa tc ffa
tc (2)
2 0 1 2 1 1 2 1 , 2 1 , 1 1 , 0
1 ( )
t i t tP i i i t P i i
t b tc b ffa tc ffa
ffa
where tct and ffat represent the log of physical time-charter and FFA rates (for the same maturity)
at time t, respectively, (1tct12ffat10)is the long run cointegrating relation, and 1and
2
are the coefficients representing the speed of adjustment to long run equilibrium. While the
cointegration relation between the physical TC and FFA is a necessary condition for the EMH,
it is not a sufficient condition (Hakkio and Rush, 1989). To test for equality of TC and FFA, one
has to further test restrictions on the cointegrating relation which imply one-to-one movement
between the two series in the long run with no significant spread between the two. In other words,
the validity of the restriction (1 1 2 1 0 0) on cointegrating vector should also be
assessed.
The next step after establishing whether the physical TC and FFA prices are co-integrated, is to
assess the differential between the two series and its time-varying dynamics. In the setting where
both FFA prices and TC rates refer to a standard vessel (i.e. where there are no time-varying
basis risks due to vessel specifications), we expect the differential to be mean reverting, though
not necessarily with a zero mean due to the differing sources of risk (and risk premia). A good
starting point in our discrete-time framework is an autoregressive-moving-average model with
added linear terms describing the average – an ARMA-X process.
Based on the preceding discussion of market practice and maritime economic theory, it seems
reasonable to postulate that the TC-FFA differential could be related to the following three
factors which are expected to capture the main sources of risk. The first is the level of the freight
market, which is expected to incorporate changes in ‘convenience yield’, or transportation
security, as well as default risk. The second is expectations about the future, as reflected in the
slope of the term structure of freight rates. The third is the level of uncertainty or risk in the
10
We therefore specify the following ARMA(p,q)-X process for the logarithmic difference
between physical time-charter and FFA rates with duration K at time t,
𝑙𝑑𝑖𝑓𝑓𝑡𝐾 = ln(𝑇𝐶
𝑡𝐾) − ln(𝐹𝐹𝐴𝑡𝐾)
𝑙𝑑𝑖𝑓𝑓𝑡𝐾 = 𝛽0+ 𝛽1𝑙𝑇𝐶𝑡𝐾+ 𝛽2𝑆𝐿𝑡+ 𝛽3𝐷𝐸𝐹𝑡+ ∑𝑝𝑖=1𝛾𝑖𝑙𝑑𝑖𝑓𝑓𝑡+ ∑𝑞𝑗=1𝛿𝑗𝜀𝑡−𝑗+ 𝜀𝑡 (3)
where, 𝑙𝑇𝐶𝑡𝐾is the log of TC rate with duration K at time t, SL
t is the slope of the forward curve
(log difference between Current Quarter and 2 Quarter ahead FFA), and DEFt represents the
market default premium calculated as the difference between the yield on BBB corporate bonds
and the yield on the 10-year Treasury bond. We assume DEFt is a proxy for world economic
conditions and credit risk, henceforth we call this variable default probability3. The optimal
number of lags (p, q) is determined according to the Schwarz Bayesian Information Criterion
(SBIC).
For the investigation of the differential between realized individual TC fixtures and FFA prices
we base our variable selection on the recent literature on the determinants of TC rates at the
micro level. In particular, we follow Adland et al (2017) and include the following variables in
a multiple log-linear regression with three sets of variables reflecting vessel-specific,
contract-specific and market variables, respectively:
𝑙𝑑𝑖𝑓𝑓𝑡,𝑖 = 𝛽0+ 𝛽1𝐴𝐺𝐸𝑖+ 𝛽2𝐴𝐺𝐸𝑖2+ 𝛽3𝐷𝑊𝑇𝑖+ 𝛽4𝑆𝑃𝑖+ 𝛽5𝐶𝑂𝑁𝑖+ 𝛾1𝑇𝐶𝐷𝑖+ 𝛾2𝐿𝐶𝑖
(4)
+𝛾3𝑂𝑃𝑖+ 𝛾4𝑃𝐷𝑖+ 𝛾5𝐼𝐷𝑖+ 𝜆1𝑆𝐿𝑡+ 𝜆2𝐷𝐸𝐹𝑡+ 𝜆3𝐵𝑃𝑡+ 𝜀𝑡,𝑖
11
where AGEi represents the age of the vessel at the time fixture i is reported, DWTi is the
deadweight carrying capacity, SPi and CONi are the design speed and consumption of the vessel
in question, TCDi is the duration of the period charter, LCi is the laycan for the fixture, OPi is a
dummy for the presence of an extension option, PDi is a dummy for Pacific Ocean delivery of
the vessel at the start of the charter and IDi is a dummy for Indian Ocean delivery. Finally,
regarding market variables, SLt is the slope of forward curve at time t, DEFt is the market default
premium at time t when contract i is concludedand BPt is the bunker price at time t.
Based on our definition of the differential (TCt – FFAt) we know that any vessel- or
contract-specific variable that is expected to affect the TC rate positively also will affect the differential
with the FFA price positively. Following the results in Alizadeh and Talley (2011a) and Adland
et al. (2017), we expect vessel age (specifically, 1AGE2AGE2) to have a non-linear impact
– positive for modern vessels and negative for older tonnage. Vessel size (DWT) and speed (SP)
are expected to affect the TC rate and the differential positively, as a larger or faster vessel has
greater earnings potential, all else equal. The dummies for Pacific (PD) and Indian Ocean (ID)
delivery should have negative coefficients versus the Atlantic Ocean benchmark as delivery in
the Atlantic positions the vessel for a higher-paying front-haul voyage. The extension option
(OP) is a charterer’s option and so should affect the TC rate and our differential positively.
Finally, the duration of the charter (TCD) should affect the TC rate negatively, as our sample is
dominated by a backwardated (downward sloping) term structure of freight rates.
4. Data
Our study is based on time series of TC rates and individual TC fixtures from Clarkson Research
(2017). The weekly time-charter rates are based on brokers’ assessment for a standard vessel
and reported every Friday. Our sample covers 6-month and 12-month TC rates for Capesize and
Panamax vessels over the period 22 July 2005 to 23 December 2016 for a total of 597
observations. For Supramax vessels the data cover the period 1 January 2006 to 23 December
2016. The sample of individual TC fixtures consists of 779 Capesize transactions, 3,224
Panamax transactions and 1,377 Supramax transactions covering the same period. The fixture
12
consumption) and contractual terms for the time-charter (duration, place of delivery, extension
option etc.).
The Baltic Exchange provides daily closing prices for the nearest monthly, quarterly and calendar
year FFA contracts for the corresponding sample period. As the physical TC rates relate to
fixed-duration contracts commencing on the reporting date we need to create prices for the equivalent
FFA contract which has the same duration. The FFA equivalent portfolio is constructed using
the weighted average of FFA prices, where the weights are simply the remaining days of the
current quarter and counting the days of the next quarters to cover the same time period as the
TC contract. For instance, on 15 April 2010, a 6-month FFA equivalent of a 6-month time-charter
is constructed as [(Q2x76 + Q3x92+ Q4*15)/182], where Q2 is the FFA price for the 2nd quarter
of 2010, Q3 is the FFA price for the 3rd quarter of 2010, and Q4 is the FFA price for the 4th
quarter of 2010.4
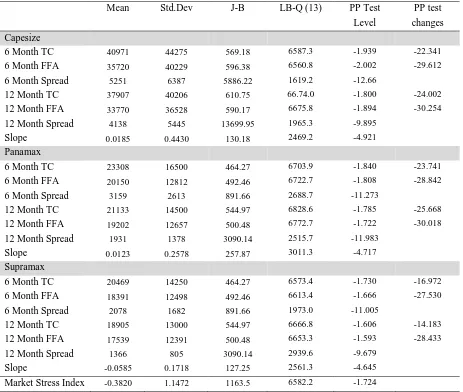
Table 1 shows the descriptive statistics for the FFA and TC time series data along with the
differential (spread) between them. We note that the average TC rate is higher than the average
FFA price across contract durations and vessel sizes, which could be taken as an early indication
of a physical convenience yield, particularly as our sample includes the 2003 – 2008 period of
unusually strong freight markets and high fleet utilization. Conversely, we cannot rule out that
such a differential represents a risk premium, compensating, for instance, for the higher default
risk inherent in a bilateral TC contract.
Insert Table 1 about here
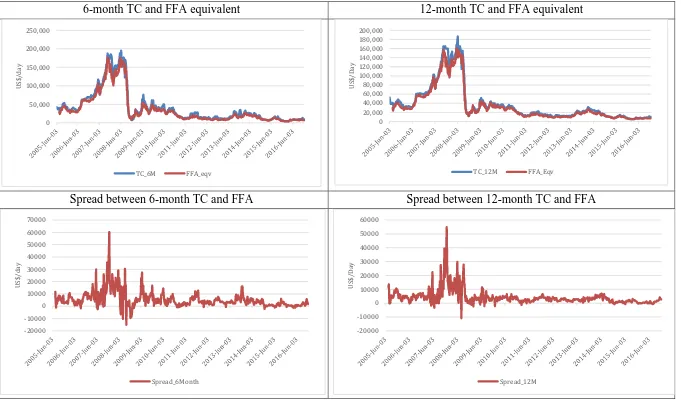
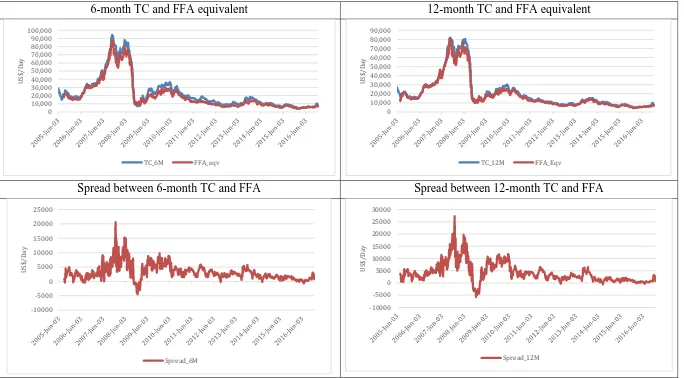
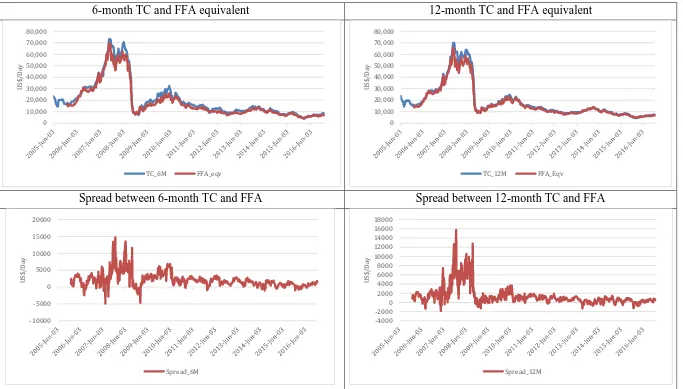
Historical time-charter rates and FFA equivalent prices for 6- and 12-month periods along with
the differential between the two rates are presented in Figures 1 to 3 for Capesize, Panamax and
Supramax dry bulk carriers, respectively. We can see that the physical TC rates and FFA prices
for the 6- and 12-month periods are closely aligned and move together over the long run across
13
all three vessel sizes, albeit with short-run deviations. In addition, the plot of the differential
between the two prices seems to be highly mean reverting, relatively volatile and on average
positive, for both 6- and 12-month period and across all vessel categories. The highest levels of
the TC-FFA differentials and their volatilities can be observed over the period 2007 to 2008,
when dry bulk freight rates were at their historical highs
Insert Figure 1
Insert Figure 2
Insert Figure 3
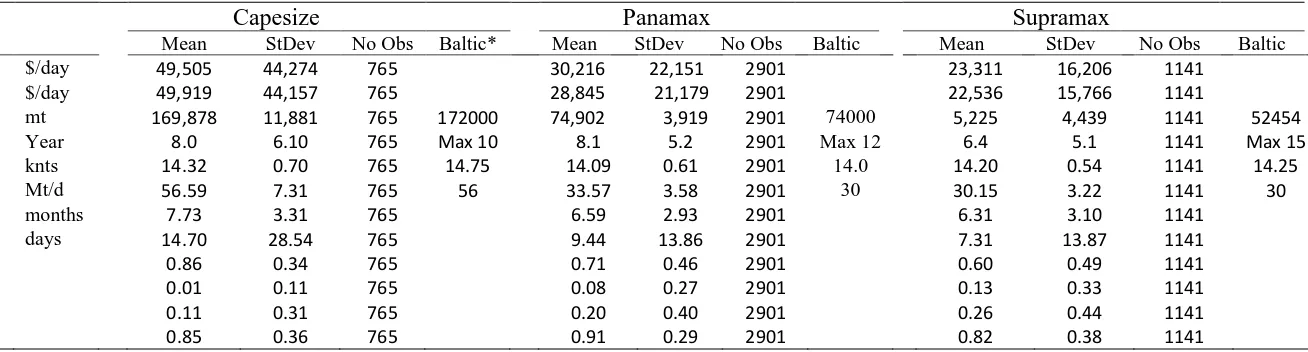
Table 2 shows the descriptive statistics for our TC fixture data and the FFA price for the
corresponding charter duration. We also include the standard vessel specifications for the “Baltic
type” vessel underlying the spot indices on which the FFAs are settled for comparison. Again,
the average TC rate in the physical market is higher than the corresponding FFA price across
vessel sizes. At the same time, we can observe that the technical specifications of the vessels
fixed in the TC market are, on average, very similar to the standard “Baltic type” vessel.
Consequently, physical basis risk due to vessel specifications appears an unlikely candidate to
explain the differential.
Insert Table 2
5. Empirical results
We begin the empirical analysis by first investigating the short and long run relation between
physical TC and FFA-equivalent rates, using the Johansen (1988) cointegration approach.
Establishing the cointegration relation between the TC and FFA is important because it would
confirm that both variables are driven by the same underlying factor in the long run and deviate
from the long run equilibrium, in short periods of time, due to factors that affect each variable
differently – e.g. vessel shortages in the physical market, default risk etc. The results of the
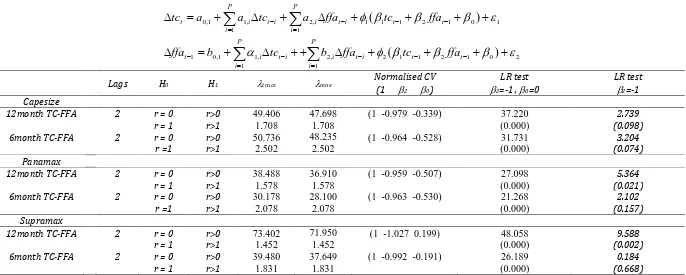
Johansen test for the cointegration relation between TC rates and FFA equivalents for 6- and
12-month periods across the three dry bulk vessel classes are presented in Table 3. The appropriate
lag length (=2) for the VECM model is selected by the Schwarz Bayesian Information Criterion.
14
tests on the full restriction set on cointegrating vector (1 1 2 1 0 0)seem to be
rejected across all vessel sizes and maturities. However, the second restriction which only
implies a one-to-one movement between the TC and FFA (1 1 2 1 0) with a non-zero
spread between the two series seems to be valid at the 5% significance level for all maturities
and vessel sizes, except the 12-month TC and FFA for Panamax vessels, where the restriction is
valid at the 1% significant level. Therefore, the results of the cointegration and restriction tests
reveal that while the TC and FFAs are cointegrated and move close to each other in the long run,
there nonetheless seems to be a significant differential (premium) between the two rates. The
negative sign of the estimated coefficients of the constant in the cointegrating vector suggest that
physical TC rates carry a statistically significant premium over the equivalent FFA rates across
all vessel types and both the 6 and 12-month maturities5.
Insert Table 3
The estimation results of the VECM models for physical TC and FFA rates for different size dry
bulk carriers are reported in Table 4. Overall, it seems that FFA rates have greater explanatory
power over physical TC rates than the other way around, as indicated by the significance of
lagged FFA rates in most of the TC equations. This is also evident from the higher R-bar-squared
of the TC equations compared to the FFA equations. The results of the Granger-Causality tests
between TC and FFA equivalents, also reported in Table 4, reveal that while there is a
unidirectional causality from FFA rates to physical TC in the Capesize and Panamax markets,
there is a bi-directional causality between TC and FFA rates in the Supramax market.
Insert Table 4
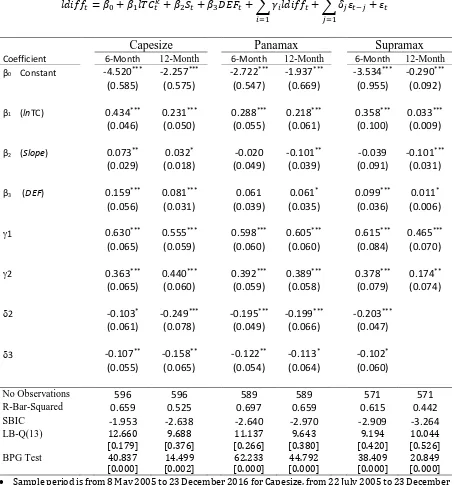
Having established that the physical TC and FFA rates are cointegrated, we proceed to examine
the determinants of the TC premium at the macro level, where we consider only the dynamics of
the differential on a time series basis (Equation 3). From Table 5 we see that the TC-FFA
differentials in the Capesize, Panamax and Supramax tend to follow an ARMA-X(2,2-3) process,
15
while the 12 month TC-FFA differential for Supramax seem to follow ARMA-X(2,0) process.
The AR coefficients suggest that the differential is mean reverting towards a level which is
governed by the level and slope of the physical term structure. Importantly, the coefficients of
the log TC rates are positive and highly significant, which indicate that the TC-FFA differential
is directly related to the level of freight rates in the market. For instance, in the Capesize segment,
the estimated coefficient of lTCt (0.231) indicates that – everything else being equal - for every
$1000/day increase in physical freight rate, the TC-FFA differential widens by $231/day.
Moreover, the estimated coefficient of market default probability (DEF) is positive and
significant in all equations, except for 6-month contract for Panamax vessels, which suggests
that the differential is positively related to the market condition and default risk. Therefore, the
empirical results support the notion that there must exist a positive and time-varying differential
across all vessel sizes and TC durations. The observation that the premium is increasing with
the level of the TC rate is also aligned with both the convenience yield and risk premium
hypotheses. On the one hand, the physical contract provides secure access to transportation
through the commercial control of a vessel, and this has greater value during times of high fleet
utilization and high rates. On the other hand, Adland and Jia (2008) show that the risk premium
due to default risk in bilateral TC contracts is increasing with the level of TC rates, a risk which
does not exist for FFA contracts which are traded through a clearing house. It follows that the
observed increase in the TC-FFA premium during strong markets may also be compensation for
higher risk in the contractual structure of a time-charter. We note that it is generally not possible
to disentangle the competing ‘risk premium’ and ‘convenience yield’ hypotheses in empirical
work. Indeed, an alternative view of convenience yield is that it is simply a premium for the
guaranteed physical access to a good, in this case sea transportation. The alternative - reliance
on the spot market but hedging market risk with FFAs – comes with a risk of transportation
shortage for a charterer.
Table 6 shows the estimated relationship between the observed differential for individual fixtures
and the vessel-specific, contract-specific terms and market conditions. The models are estimated
using the Ordinary Least Squares method and standard errors are corrected for the presence of
heteroscedasticity. The reported adjusted R2 of 52.7%, 28.8% and 33.1% for the Capesize,
Panamax and Supramax markets, respectively, indicate that up to 50% of the variation of the
TC-FFA differential for individual contracts can be explained by the factors considered. The
16
generally significant and have the expected signs. For instance, the relationship between vessel
age and the TC-FFA differential is nonlinear such that modern vessels (younger than
approximately 13 years of age) command a TC premium while older vessels must accept a
discount. This is in line with earlier empirical results in the literature on fixture data analysis
(see, for instance, Alizadeh and Talley, 2011a and b; Adland et al, 2016; and Adland et al, 2017).
Greater capacity (DWT) has the expected positive and significant impact on the TC-FFA
differential and reflects the impact of differing vessel specifications between the time-chartered
vessel and the “Baltic type” vessel underlying FFA pricing. Similarly, higher fuel consumption
has a negative impact on the TC rate and therefore the differential, whereas higher speed tends
to increase the TC-FFA differential.
The reported estimated coefficients of contract terms (duration, days to laycan, delivery location
and extension option) are also significant and carry the expected signs. For instance, Pacific and
Indian Ocean delivery obtains lower TC rates (and therefore a lower differential) than the
benchmark Atlantic delivery, as expected. The estimated coefficient for the extension option
dummy is positive and significant only in the Panamax market, where the coefficient of the TC
contract duration is also significant but negative.
In relation to the estimated coefficient of variables representing market condition, the slope of
forward curve is negative and significant for Supramax, but positive and significant in the
Panamax model and negative and insignificant in the Capeszie model. The negative relation
between the slope of FFA curve and the TC-FFA differential indicate that when the FFA market
is in backwardation (i.e. high spot rates), there is a greater risk of a shortage of vessels and so
having physical access to ships carries a premium (the convenience yield explanation). Similarly,
a backwardated forward curve can be an indication of expected market decline and, hence, an
increase in default risks and higher default premia in the TC market. The estimated coefficient
of the default probability (DEF) is positive and significant only in the Capesize model, and it is
insignificant in both Panamax and Supramax models. While the results for the Capesize model
is in line with what was found in the aggregate market analysis (Table 5), the results of the
Panamax and Supramax equations suggest that default probability may not be an important factor
in determination of TC-FFA differential in the market for smaller vessels. The estimated
coefficient for the fuel price is positive and significant across all models, which indicates that
increase in fuel prices tend to widen the TC-FFA differential. This can be attributed to the fact
17
commodities during the market recovery which in turn increase demand for transportation,
freight rates and TC-FFA differentials.
6. Implications for freight trading and hedging
One practical and important implication of the results in this paper relates to the pricing of TC
contracts. Theoretically, the price of TC contracts is a function of current and expected spot
market rates, expected fuel prices and future market conditions (see Kavussanos and Alizadeh,
2002). In practice, however, market participants may use the FFA curve to assess and price a TC
contract with some adjustment due to the contract and vessel specifications. Our model and
estimated coefficients can be used to evaluate period contracts for a given forward curve (FFA
equivalent), as well as contract specifics and vessel particulars. For instance, based on the
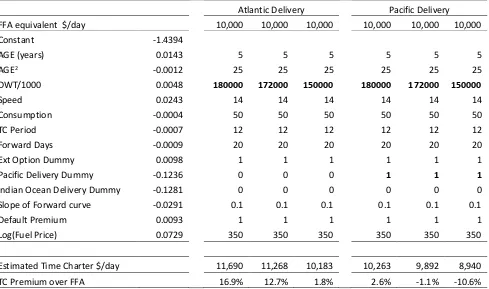
estimated coefficients of the model in equation (4), Table 7 reports the calculated values of a
12-month TC contract for three 5-year old Capesize vessels of 180,000dwt, 172,000dwt and
150,000dwt, with delivery options in the Atlantic or Pacific Oceans, and the FFA equivalent
level of $10,000/day6. The table shows that the 12-month TC premia over the FFA equivalent
can be as much as 16.9% for a 5-year old 180,000dwt Capesize delivered in the Atlantic Ocean,
whereas the same vessel should earn 2.6% more than FFA equivalent if delivered in the Pacific.
Similarly, a 5-year old 150,000dwt Capesize should earn 1.8% more than the FFA equivalent on
a 12-month TC when delivered in the Atlantic, while the same vessel will earn 10.6% less than
the FFA equivalent ($10,000/day) if delivered in the Pacific. In addition, changes in market
conditions, as proxied by the default probability (DEF), can affect the differential between TC
and FFA contracts. For instance, in the case of the 180,000dwt Capesize vessel delivered in the
Atlantic, a change of DEF from 1% to 2% results in an increase of $240/day ($11,690/day to
$11,930/day) or 2.03% in the TC rate premium due to higher default probability.
Based on the observation that the TC-FFA differential is generally positive and can widen to
high levels in the short run (ref. Figures 1 to 3), it is tempting to conclude that there must exist
some trading strategy that can take advantage of its dynamics by ‘arbitraging’ the physical and ‘paper’ markets. If the market is efficient, this would of course not be the case, as any apparent
18
gains would simply be compensation for risk – both physical basis risk (i.e. differences in vessel
specifications, contractual terms and cash flow timing) and default or liquidity risk. Nevertheless,
as an illustration of the potential gains from following such an approach in the three vessel
segments, we consider the following simple trading strategy. If the TC-FFA differential is
positive on any given day, the ship-operator charters in a vessel on an index-linked TC (duration
6 or 12 months), charters it out on a fixed-rate TC and buys the FFA portfolio of equal duration.
We note here that the cash flow from buying a FFA contract is equivalent to the Baltic spot index
less the agreed FFA price. As a result, the two index-linked cash flows cancel out, and we are
left with the TC-FFA price differential. Conversely, if the TC-FFA differential is negative on a
given day, the operator enters the reverse contractual setup (selling FFA, chartering in on a
fixed-rate TC and subletting on a spot index-linked TC, all with the same duration). The cumulative
profit from such a freight trading strategy is simply the sum of the absolute value of all daily
TC-FFA differentials7, as shown in Figure 4 below since 1st January 2006 for 6-month and 12-month
contracts in the Capesize, Panamax and Supramax segments, respectively.
Figure 4
There are a few takeaways from Figure 4. Firstly, most of the profit would have occurred in the
12 months prior to the onset of the financial crisis at the end of 2008, when the dry bulk market
reached records both in terms of freight rate levels and volatility. This is consistent with the
theoretical explanation that the observed differential is a compensation for risk as well as a
premium reflecting the value of securing physical transportation. Secondly, the differential is
generally higher for 6-month contracts than for 12-month contracts, suggesting that there are risk
factors other than default risk at play here. Thirdly, the risk premium is greater for the larger
vessel size (Capesize), which is consistent with the well-known greater operational leverage and
volatility of larger vessel (Kavussanos, 1996). In the period with lower volatility and lower
freight rates since 2009 the gains from harvesting such risk premia have largely disappeared,
reflecting the general oversupply in the market. We note that “index linked” physical
time-charter contracts are a relatively recent invention, such that the above trading strategy could not
have been implemented throughout our sample8.
7 For the purpose of illustration, we can either assume that one new vessel or a fractional vessel (1/365th or 1/183rd) enters into this contractual structure every week. Here we have assumed the latter.
19
Finally, turning to hedging applications, the results of this study could be important for freight
risk management using FFA contracts. In this respect, ship-owners and charterers can use the
estimated coefficients of the models to adjust the hedge ratio according to factors such as vessel
size, age, delivery location, etc. to achieve a more effective hedge. For instance, the estimated
coefficient of vessel size can be used to adjust the hedge ratio of the FFA position according to
the vessel’s DWT compared to the standard vessel underlying FFA contracts. The estimated
coefficients of dwt in model (4) indicates that, all else equal, every 1000 DWT in vessel size
above the Baltic standard vessel will increase the physical earnings of the ship by 0.46%, 0.63%
and 1.40% above the FFA rate in the Capesize, Panamax and Supramax markets, respectively.
Therefore, the hedgers must increase their FFA position accordingly to establish a full cover for
risk for the given vessel size. Similarly, the estimated coefficients of the Pacific Ocean delivery
dummy suggest that, everything else being equal, vessels delivered in the Pacific tend to earn
13.02% (Capesize), 11.40% (Panamax) and 15.36% (Supramax) less than vessels delivered in
the Atlantic relative to the FFA rate for the standard vessel. Hence, the ship-owners and
charterers should consider adjusting the FFA positions accordingly to avoid over- or
under-hedging.
7. Concluding remarks
In this paper we have argued, from a theoretical point of view, that there should be a positive and
time-varying differential between forward rates in the physical freight and freight derivative
markets that is positively related to the state of the freight market. We show that TC rates and
FFA prices are co-integrated and that the resulting price differential can be well described by an
ARMA-X model where the linear terms (X) includes the state of the freight market and the slope
of the term structure of freight rates. We repeat the investigation for individual fixtures in the
TC market and show that vessel-specific and contract-specific variables (as a proxy for basis risk
due to technical specifications) also act as determinants at the micro level, with the expected
results. We point to two explanations for the presence of such a premium: 1) it is a compensation
for known risks inherent in bilateral physical TC contracts such as default risk and 2) it is a
20
Our work is an important first step in the evaluation of the determinants of the observed price
differentials between the physical forward market and financial freight derivative market.
However, the findings also have practical implications for risk management and operations in
bulk shipping. Most importantly, we point to the possibility out that apparent ‘arbitrage’
opportunities between the two markets – which ship-operators will often claim to be able to take
advantage of – may not actually exist once the differences in risks, vessel specifications and
contractual terms are properly accounted for. Secondly, our proposed methodology enables risk
managers to adjust physical TC rates and FFA prices for differences in periods, vessel
characteristics and contract terms so as to better compare the true cost of hedging with the two
alternatives.
Future research should dig deeper into the important issue of whether the magnitude of the
observed time-varying differentials is consistent with likely compensation for risk, for instance
along the lines of the model for default risk presented in Adland and Jia (2008). It would also
be interesting to develop more complicated trading strategies for ship-operators based on the
21
References
Adland, R., Alger, H., Banyte, J. and Jia, H. (2017), Does fuel efficiency pay? Empirical evidence from the drybulk time-charter market revisited, Transportation Research Part A, 95, 1-12.
Adland, R., Cariou, P. and Wolff F.-C. (2016), The influence of charterers and owners on bulk shipping freight rates. Transportation Research Part E: Logistics and Transportation Review, 86, 69-82.
Adland, R., and Cullinane, K. (2005) A time-varying risk premium in the term structure of bulk shipping freight rates. Journal of Transport Economics and Policy, 191-208.
Adland, R. and Jia, H. (2008): Default risk in bulk shipping: A conceptual approach, Transportation Research Part E, 44(1), 152-163.
Adland, R., and Jia, H. (2017): Physical basis risk in freight market hedging, Maritime Economics and Logistics, in press.
Adland, R. and Strandenes, S. P. (2007): A discrete-time stochastic partial equilibrium model of the spot freight market, Journal of Transport Economics and Policy, 41(2), 1 - 30.
Alizadeh, A. H., 2013. Trading volume and volatility in the shipping forward freight market. Transportation Research Part E: Logistics and Transportation Review, 29, 250-265.
Alizadeh, A., Adland, R. and Koekebakker, S. (2007): Unbiasedness and predictive power of implied forward charter rates, Journal of Forecasting, 26(6), 385 - 403.
Alizadeh, A. H., Huang, CY. and van Dellen, S., 2015, A regime switching approach for hedging tanker shipping freight rates, Energy Economics, 49, 44–59.
Alizadeh, A., and Nomikos, N. (2009) Shipping derivatives and risk management. Palgrave MacMillan.
Alizadeh, A. H., Kappou, N., Tsouknidis, D., and Visvikis, I., (2014), Liquidity Risk Premia in the International Shipping Derivatives Market. Transportation Research Part E, 76, 58 - 75. Alizadeh, A. H., and Talley, W. K. (2011a) Microeconomic determinants of dry bulk shipping
freight rates and contract times. Transportation, 38(3), 561-579.
Alizadeh, A. H., and Talley, W. K. (2011b) Vessel and voyage determinants of tanker freight rates and contract times. Transport Policy, 18(5), 665-675.
Andreou, P. C. (2015). Effects of market default risk on index option risk-neutral moments. Quantitative Finance 15, 2021-2040.
Batchelor, R. A., Alizadeh, A. H., Visvikis, I. D., (2007), Forecasting spot and forward prices in the international freight market. International Journal of Forecasting, 23,101-114.
Benth, F. E., and Koekebakker, S., (2016), Stochastic modeling of Supramax spot and forward freight rates. Maritime Policy and Management, 18(4), 391–413.
Benth, F.E., Koekebakker, S. and Che Taib, C.M.I.C. (2014) Stochastic dynamical modelling of spot freight rates. IMA Journal of Management Mathematics. Advanced access, first published online March 4.
Brennan, M.J., 1958. The supply of storage, American Economic Review, 48(1), 50 – 72. Campbell, S. D. and Diebold, F. X., (2012) Stock Returns and Expected Business Conditions:
22
Goulas, L., and Skiadopoulos, G. (2012) Are freight futures markets efficient? Evidence from IMAREX. International Journal of Forecasting, 28(3), 644-659.
Haralambides, H. E. (1992) Freight futures trading and shipowners’ expectations. In Conference Proceedings, 6th World Conference on Transportation Research, Lyon, France, 1411-1422. Kavussanos, M. G. (1996), Comparisons of volatility in the dry-cargo ship sector: Spot versus time charters, and smaller versus larger vessels, Journal of Transport Economics and Policy, vol. XXX(1), pp. 67-82.
Kavussanos, M. G., Visvikis, I. D., 2004a. The hedging performance of over-the-counter forward shipping freight markets. Conference proceedings, 14th International Association of Maritime Economists (IAME) Conference, Izmir, Turkey, 30 June - 2 July.
Kavussanos, M. G., and Visvikis, I. D., 2004b. Market interactions in returns and volatilities between spot and forward shipping freight markets. Journal of Banking & Finance, 28(8), 2015-2049.
Kavussanos, M. G., Visvikis, I. D., and Menachof, D., 2004, The unbiasedness hypothesis in the freight forward market: Evidence from cointegration tests. Review of Derivatives Research, 7(3), 241-266.
Kavussanos, M. G., Visvikis, I. D., and Batchelor, R. A., 2004, Over-the-counter forward contracts and spot price volatility in shipping. Transportation Research Part E: Logistics and Transportation Review, 40(4), 273-296.
Kavussanos, M. G., Visvikis, I. D., 2006. Shipping freight derivatives: A survey of recent evidence. Maritime Policy and Management, 33, 233-255.
Kavussanos, M. G., Visvikis, I. D., 2010. The hedging performance of the Capesize forward freight market, in: Cullinane, K. (Ed.), International Handbook of Maritime Business, Edward Elgar, Cheltenham, 331-352.
Koekebakker, S., Adland, R., 2004. Modelling forward freight dynamics: Empirical evidence from time charter rates. Maritime Policy and Management, 31, 319-335.
Li, K.X., Guanqiu Qi, Wenming Shi, Zhongzhi Yang, Hee-Seok Bang, Su-Han Woo, and Tsz Leung Yip, 2014. Spillover effects and dynamic correlations between spot and forward tanker freight markets, Maritime Policy & Management, 41, 7,
Perez-Quiros, G. and Timmermann, A, (2002), Firm Size and Cyclical Variations in Stock Returns, The Journal of Finance, Vol. 55, No. 3 (Jun., 2000), pp. 1229-1262
Thuong, L. T., and Visscher, S. L. (1990) The hedging effectiveness of dry-bulk freight rate futures. Transportation Journal, 29(4), 58-65.
23
Table 1– Time series descriptive statistics
Mean Std.Dev J-B LB-Q (13) PP Test Level
PP test changes Capesize
6 Month TC 40971 44275 569.18 6587.3 -1.939 -22.341
6 Month FFA 35720 40229 596.38 6560.8 -2.002 -29.612 6 Month Spread 5251 6387 5886.22 1619.2 -12.66
12 Month TC 37907 40206 610.75 66.74.0 -1.800 -24.002 12 Month FFA 33770 36528 590.17 6675.8 -1.894 -30.254 12 Month Spread 4138 5445 13699.95 1965.3 -9.895
Slope 0.0185 0.4430 130.18 2469.2 -4.921
Panamax
6 Month TC 23308 16500 464.27 6703.9 -1.840 -23.741
6 Month FFA 20150 12812 492.46 6722.7 -1.808 -28.842 6 Month Spread 3159 2613 891.66 2688.7 -11.273
12 Month TC 21133 14500 544.97 6828.6 -1.785 -25.668 12 Month FFA 19202 12657 500.48 6772.7 -1.722 -30.018 12 Month Spread 1931 1378 3090.14 2515.7 -11.983
Slope 0.0123 0.2578 257.87 3011.3 -4.717
Supramax
6 Month TC 20469 14250 464.27 6573.4 -1.730 -16.972
6 Month FFA 18391 12498 492.46 6613.4 -1.666 -27.530 6 Month Spread 2078 1682 891.66 1973.0 -11.005
12 Month TC 18905 13000 544.97 6666.8 -1.606 -14.183 12 Month FFA 17539 12391 500.48 6653.3 -1.593 -28.433 12 Month Spread 1366 805 3090.14 2939.6 -9.679
Slope -0.0585 0.1718 127.25 2561.3 -4.645
Market Stress Index -0.3820 1.1472 1163.5 6582.2 -1.724
• Sample period is from 22 July 2005 to 23 December 2016, a total of 597 weekly observations for Capesize and Panamax and from 1 January 2006 to 23 December 2016, a total of 580 weekly observations for Supramax vessels.
• S.D. is the standard deviation. JB test is the Jarque-Bera (1980) test for Normality. The test follows a 2 distribution with 2 degrees of freedom.
• LB-Q(13) is Ljung-Box (1978) tests for 13th order autocorrelation in the level of series. 1%, 5% and 10% critical values for this test are –3.9739, -3.4175 and –3.1308, respectively.
• PP test is the Philips and Perron (1988) unit root tests. 1%, 5% and 10% critical values for this test are –
3.9739, -3.4175 and –3.1308, respectively.
• Slope is defined as the log of Current Quarter (CQ) over near Calendar (Cal+1) FFA contracts for each vessel size.
Table 2–Descriptive statistics of time-charter fixtures, vessel specifications and contract variables
Capesize Panamax Supramax
Mean StDev No Obs Baltic* Mean StDev No Obs Baltic Mean StDev No Obs Baltic
Contract Rate $/day 49,505 44,274 765 30,216 22,151 2901 23,311 16,206 1141
FFA equivalent $/day 49,919 44,157 765 28,845 21,179 2901 22,536 15,766 1141
Dwt mt 169,878 11,881 765 172000 74,902 3,919 2901 74000 5,225 4,439 1141 52454
Age Year 8.0 6.10 765 Max 10 8.1 5.2 2901 Max 12 6.4 5.1 1141 Max 15
Speed knts 14.32 0.70 765 14.75 14.09 0.61 2901 14.0 14.20 0.54 1141 14.25
Consumption Mt/d 56.59 7.31 765 56 33.57 3.58 2901 30 30.15 3.22 1141 30
Period months 7.73 3.31 765 6.59 2.93 2901 6.31 3.10 1141
Laycan days 14.70 28.54 765 9.44 13.86 2901 7.31 13.87 1141
Pacific Del Dummy 0.86 0.34 765 0.71 0.46 2901 0.60 0.49 1141
Ind Ocean Del Dummy 0.01 0.11 765 0.08 0.27 2901 0.13 0.33 1141
Atlantic Del Dummy 0.11 0.31 765 0.20 0.40 2901 0.26 0.44 1141
Option Dummy 0.85 0.36 765 0.91 0.29 2901 0.82 0.38 1141
• Sample period is from 22 July 2005 to 23 December 2016, for Capesize and Panamax and from 1 January 2006 to 23 December 2016, for Supramax vessels.
25
Table 3–Results of Cointegration tests between 6- and 12-month Time-charter rates and equivalent FFA rates for different size dry bulk ships
• Sample period is from 22 July 2005 to 23 December 2016, a total of 597 weekly observations for Capesize and Panamax and from 1 January 2006 to 23 December 2016, a total
of 570 weekly observations for Supramax vessels.
• Cointegration tests are based on the Johansen (1988) procedure; the LR test is based on 1% significance level.
2 0 1 2 1 1 2 1 , 2 1 , 1 1 , 0 1 1 0 1 2 1 1 1 1 , 2 1 , 1 1 , 0 ) ( ) (
t t i t P i i i t P i i t t t i t P i i i t P i i t ffa tc ffa b tc b ffa ffa tc ffa a tc a a tcLags H0 H1 trace max Normalised CV
(1 2 0)
LR test 2=-1 , 0=0
LR test 2=-1
Capesize
12month TC-FFA 2 r = 0 r>0 49.406 47.698 (1 -0.979 -0.339) 37.220 2.739
r = 1 r>1 1.708 1.708 (0.000) (0.098)
6month TC-FFA 2 r = 0 r>0 50.736 48.235 (1 -0.964 -0.528) 31.731 3.204
r =1 r>1 2.502 2.502 (0.000) (0.074)
Panamax
12month TC-FFA 2 r = 0 r>0 38.488 36.910 (1 -0.959 -0.507) 27.098 5.364
r = 1 r>1 1.578 1.578 (0.000) (0.021)
6month TC-FFA 2 r = 0 r>0 30.178 28.100 (1 -0.963 -0.530) 21.268 2.102
r =1 r>1 2.078 2.078 (0.000) (0.157)
Supramax
12month TC-FFA 2 r = 0 r>0 73.402 71.950 (1 -1.027 0.199) 48.058 9.588
r = 1 r>1 1.452 1.452 (0.000) (0.002)
6month TC-FFA 2 r = 0 r>0 39.480 37.649 (1 -0.992 -0.191) 26.189 0.184
26
Table 4: Results of VECM for Physical Time-charter and FFA equivalent for different size dry bulk carriers
2 0 1 2 1 1 2 1 , 2 1 , 1 1 , 0 1 1 0 1 2 1 1 1 1 , 2 1 , 1 1 , 0 ) ( ) (
t t i t P i i i t P i i t t t i t P i i i t P i i t ffa tc ffa b tc b ffa ffa tc ffa a tc a a tcCapesize Panamax Supramax
6-month 12-month 6-month 12-month 6-month 12-month
tct ffat tct ffat tct ffat tct ffat tct ffat tct ffat
ECTt-1 -0.182*** -0.001 -0.191*** 0.012 -0.089*** 0.016 -0.111*** 0.004 -0.112*** 0.048 -0.191*** 0.098*
(0.034) (0.035) (0.043) (0.048) (0.024) (0.032) (0.025) (0.035) (0.024) (0.035) (0.033) (0.052)
tct-1 -0.001 0.114** -0.108* 0.049 -0.066 -0.033 -0.068 -0.081 0.093** 0.179*** 0.187*** 0.281***
(0.052) (0.055) (0.059) (0.067) (0.053) (0.069) (0.051) (0.072) (0.046) (0.066) (0.049) (0.078)
tct-2 -0.012 0.004 0.022 0.059 0.004 0.029 0.139 0.164*** 0.064 0.062 0.095** 0.110*
(0.047) (0.049) (0.053) (0.060) (0.043) (0.056) (0.044) (0.062) (0.040) (0.057) (0.041) (0.066)
ffat-1 0.241*** -0.090 0.204*** -0.087 0.398*** -0.005 0.273*** -0.055 0.300*** -0.050 0.141*** -0.108*
(0.055) (0.057) (0.058) (0.067) (0.044) (0.058) (0.041) (0.058) (0.037) (0.054) (0.040) (0.063)
ffat-2 0.219*** 0.137** 0.219*** 0.143*** 0.187*** 0.130** 0.120*** 0.120** 0.187*** 0.060 0.063* 0.053
(0.052) (0.055) (0.054) (0.061) (0.044) (0.058) (0.040) (0.056) (0.037) (0.053) (0.035) (0.056)
R-bar-sq 0.177 0.033 0.144 0.037 0.271 0.018 0.232 0.049 0.351 0.047 0.327 0.077
Log-Likelihood 1081.666 1482.99 1598.18 1832.45 1784.69 2039.96
SBIC -3.581 -4.862 -5.595 -6.092 -6.117 -7.013
LB-Q(8) 30.818 [0.195] 49.180 [0.002] 50.30 [0.002] 44.346 [0.010] 34.503 [098] 56.691 [0.001]
Granger Causality
tct --> ffat 4.425 [0.109] 1.207 [0.548] 0.507 [0.776] 8.460 [0.015] 9.094 [0.011] 17.056 [0.000]
[image:27.842.57.808.148.511.2]Table 5–Determinants of physical TC premium (macro level)
𝑙𝑑𝑖𝑓𝑓𝑡 = 𝛽0+ 𝛽1𝑙𝑇𝐶𝑡𝑘+ 𝛽2𝑆𝑡+ 𝛽3𝐷𝐸𝐹𝑡+ ∑ 𝛾𝑖𝑙𝑑𝑖𝑓𝑓𝑡 𝑝
𝑖=1
+ ∑ 𝛿𝑗𝜀𝑡−𝑗 𝑞
𝑗=1
+ 𝜀𝑡
Capesize Panamax Supramax
Coefficient 6-Month 12-Month 6-Month 12-Month 6-Month 12-Month
β0 Constant -4.520*** -2.257*** -2.722*** -1.937*** -3.534*** -0.290***
(0.585) (0.575) (0.547) (0.669) (0.955) (0.092)
β1 (lnTC) 0.434*** 0.231*** 0.288*** 0.218*** 0.358*** 0.033***
(0.046) (0.050) (0.055) (0.061) (0.100) (0.009)
β2 (Slope) 0.073** 0.032* -0.020 -0.101** -0.039 -0.101***
(0.029) (0.018) (0.049) (0.039) (0.091) (0.031)
β3 (DEF) 0.159*** 0.081*** 0.061 0.061* 0.099*** 0.011*
(0.056) (0.031) (0.039) (0.035) (0.036) (0.006)
1 0.630*** 0.555*** 0.598*** 0.605*** 0.615*** 0.465***
(0.065) (0.059) (0.060) (0.060) (0.084) (0.070)
2 0.363*** 0.440*** 0.392*** 0.389*** 0.378*** 0.174**
(0.065) (0.060) (0.059) (0.058) (0.079) (0.074)
2 -0.103* -0.249*** -0.195*** -0.199*** -0.203***
(0.061) (0.078) (0.049) (0.066) (0.047)
3 -0.107** -0.158** -0.122** -0.113* -0.102*
(0.055) (0.065) (0.054) (0.064) (0.060)
No Observations 596 596 589 589 571 571
R-Bar-Squared 0.659 0.525 0.697 0.659 0.615 0.442
SBIC -1.953 -2.638 -2.640 -2.970 -2.909 -3.264
LB-Q(13) 12.660 9.688 11.137 9.643 9.194 10.044
[0.179] [0.376] [0.266] [0.380] [0.420] [0.526]
BPG Test 40.837 14.499 62.233 44.792 38.409 20.849
[0.000] [0.002] [0.000] [0.000] [0.000] [0.000]
• Sample period is from 8 May 2005 to 23 December 2016 for Capesize, from 22 July 2005 to 23 December 2016 for Panamax and from 16 September 2005 to 23 December 2016 for Supramax vessels.
• The order of AR and MA terms are selected to eliminate autocorrelation in residuals.
• Figures in () and [] are standard errors and p-values, respectively. *, **, and ***.indicate significance at the 10%, 5% and 1% levels, respectively.
• SBIC is the Schwarz Bayesian Information Criterion, LB-Q(13) is Ljung-Box (1978) test for 13th order residuals autocorrelation, and BPG Test is the Breusch-Pagan-Godfrey test for heteroskedasticity.
![Figures in () and [] are standard errors and p-values, respectively.](https://thumb-us.123doks.com/thumbv2/123dok_us/1359358.89422/27.842.57.808.148.511/figures-standard-errors-p-values-respectively.webp)
![Figures in () and [] are standard errors and p-values, respectively. *, **, and *** indicate significance at the 10%, 5% and 1% levels, respectively](https://thumb-us.123doks.com/thumbv2/123dok_us/1359358.89422/29.595.74.535.173.652/figures-standard-errors-values-respectively-indicate-significance-respectively.webp)