Rochester Institute of Technology
RIT Scholar Works
Theses
Thesis/Dissertation Collections
5-19-2013
A Comparison of wide area network performance
using virtualized and non-virtualized client
architectures
John Gustafson
Follow this and additional works at:
http://scholarworks.rit.edu/theses
This Thesis is brought to you for free and open access by the Thesis/Dissertation Collections at RIT Scholar Works. It has been accepted for inclusion in Theses by an authorized administrator of RIT Scholar Works. For more information, please [email protected].
Recommended Citation
R • I • T
A COMPARISON OF WIDE AREA NETWORK PERFORMANCE USING
VIRTUALIZED AND NON-VIRTUALIZED CLIENT ARCHITECTURES
by
John A. Gustafson
Thesis submitted in partial fulfillment of the requirements
for the degree of
Master of Science in
Networking and Systems Administration
Department of Networking, Security & Systems Administration
Rochester Institute of Technology
B. Thomas Golisano College
of
Computing and Information Sciences
II
Committee Approval:
Tae (Tom) Oh Ph.D. Date
Chief Advisor
Charles Border, Ph.D. Date
Associate Advisor
Gueyoung Jung, Ph.D. Date
III
Acknowledgements
I would like to thank each member of my thesis committee for providing the guidance and insights necessary to complete this work.
Professor Tom Oh provided the questions and insights needed to keep the study centered on the computer networking questions. He provided the resources I needed to complete the experiments, and the support that helped mold this project into what it is.
Professor Charles Border provided the motivation and discussion required, helping to keep the
work interesting to me and relevant to the current state of the field.
Professor Gueyoung of Xerox Research Center helped me realize that a study like this one is
relevant to current workplace research, and his professional example demonstrates that the dialog
between the academic and business worlds is beneficial to both.
I would like to thank Maneesh Augustine for assisting with the experiment setup. His hours in
the lab, patience, and expertise were necessary and I am greatly indebted.
I would like to thank everyone who provided guidance, motivation, or was simply willing to
listen to my ideas and help verify the logic and utility of this study. In particular, my father
shared his career experiences and monitoring current IT news to help refine my focus. I hope
IV
Abstract
The goal of this thesis is to determine if there is a significant performance difference between two network computer architecture models. The study will measure latency and throughput for both client-server and virtualized client architectures. In the client client-server environment, the client computer performs a significant portion of the work and frequently requires downloading uploading files to and from a remote location. Virtual client architecture turns the client machine into a terminal, sending only keystrokes and mouse clicks and receiving only display pixel or sound changes. I will accomplish the goal of comparing these architectures by comparing completion times for ping reply, file download, a small set of common work tasks, and a moderately large SQL database query. I compared these tasks using simulated wide area network, local area network, and virtual client network architectures. The study limits the architecture to one where the virtual client and server are in the same data center. Separating the client and server into two data centers re-introduces the latency and delay that is a by-product of Internet connections; so testing that architecture would be at least partially redundant.
The fundamental question this study hopes to answer is this: if the virtual client is in the same data center as the server, how does performance compare to the more standard client/server architecture?
Answering this question requires proving two assumptions:
1. Fewer bits travel end to end with virtual clients; most of the data transfer stays within the local area network. (LAN)
2. Any server performance cost associated with using virtual clients does not offset the advantage mentioned above.
The experiments I conduct should clearly demonstrate item #2, and provide strong insight into item #1.
This study required the following tools:
- Dell Desktop Workstations - Cisco Routers and Switches
- OpNet “System in a Box” Network Modeling Software - VMWare View PCoIP Middleware
- WinTask Application Performance Testing Software - Microsoft Windows Server and client Operating Systems - MySQL Manager
V
Contents
Acknowledgements ... II
Abstract ... IV
List of Tables and Diagrams ... VII
Introduction ... 8
Section I – Some Causes of WAN Application Performance Problems ... 10
Network, Protocol, and Internet Factors ... 10
Causes of Internet Latency... 10
Propagation Delay ... 11
Serialization Delay ... 11
Data Protocols and Latency... 11
TCP/IP Protocol Stack ... 12
Network Access Layer: ... 12
Internet Layer: ... 12
Transport: ... 12
Application: ... 12
Routing and Switching Latencies ... 13
MPLS Latency ... 13
Latency Summary ... 14
Bandwidth Limitations ... 14
Bandwidth Summary ... 16
Other Approaches for Improving WAN Application Performance ... 17
Architecture Solutions ... 17
Server Optimization ... 17
Virtualization ... 20
Grid Computing ... 21
Cloud Computing ... 22
Database and Coding Solutions ... 22
Database Design Solutions ... 22
Coding Alternatives... 22
VI
Cloud versus Cluster Computing ... 24
Application Performance in the Cloud... 26
Section II – Performance Comparison Experiments ... 27
Network Devices... 28
Network Model ... 30
Client/Server Wide Area Network Architecture ... 31
Local Area Network Architecture ... 32
Virtual Client Wide Area Network Architecture Diagram ... 33
Experiments and Results ... 34
Experiment Setup ... 34
Experiment I - Ping Reply ... 35
Experiment I Analysis ... 35
Experiment II – Opening Remote Files ... 36
Experiment II Analysis ... 36
Experiment III – Common Office Tasks ... 36
Experiment III Analysis ... 37
Experiment IV – Query Response Time ... 37
Discussion ... 38
Performance Test ... 39
Client/Server Time (seconds) ... 39
Virtual Client Time (seconds) ... 39
% Difference ... 39
Conclusion ... 41
VII
List of Tables and Diagrams
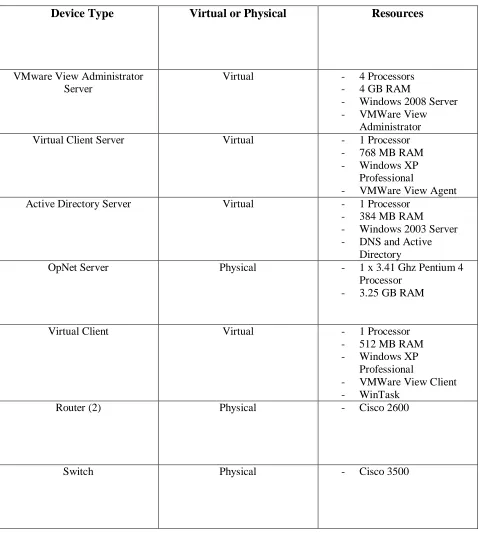
Table I: Physical and Virtual Resources – Page 26
Figure I – Geographic Representation of the Network - 28 Figure II – Wide Area Network - 30
Figure III – Local Area Network - 31
Figure IV – Wide Area Network with Virtual Clients - 32 Table II – Ping Reply Results - 33
8
Introduction
Since the mid-nineteen nineties, home and business computers have focused on individualized and limited-scale tasks. Web browsing, document and other media creation and editing, numerical tracking and analysis have been the main purposes for the personal computer. These tasks work well when using a computer architecture that relies on the client computer for a substantial portion of the processing, storage, and data transfer. Just as I wrote part of this thesis on a laptop computer connected only to the Internet, much of the use for business and creative computers centers on the workstation. If I chose, I could complete this document using the laptop as a stand-alone workstation connected only to a printer, and many modern computer tasks are still possible using that approach. Word processing and spreadsheet software, presentation and graphic design software, Computer Aided Drafting programs, all of these normally install on and run from workstations. It is only when the need for data storage or transfer exceeds the abilities of a stand-alone workstation that local or wide area networks are required.
This is not to say that there are no resources available for performing these types of work from a server computer. Office applications will run from a server, without any client installation. Shared environments such as the Citrix Xen suite allow a user to sign into a server profile that contains some or all of the applications that user requires; running those applications from the profile. Similar to Citrix environments are virtualized client environments such as VMWare View, used for experiments later in this thesis. Google Apps or Microsoft Office 365 work entirely from remote (i.e. Internet-based) servers and allow users the opportunity to collaborate on office files in a way that was not previously possible. While most office files run on local computers and only one person can edit them at a time, options such as Google Apps host the applications on a remote server and allow concurrent editing from compatible devices with Internet access.
Existing alongside workstations are computers designed to meet higher storage and processing performance requirements. Since the 1970’s, mainframe computers have been considered separate entities best assigned to people who work with command line interfaces, often in isolated data centers. Proponents of client/server computing claimed it would replace the mainframe, but the reliability, speed monitoring tools, and robustness of the mainframe environment is more difficult to replace than
9
indispensible for the organization to continue functioning. With the amount older of data that must be stored, transmitted, and processed, the more established and larger-scale data processing that mainframe hardware and software enable are difficult to replace. [2]
Today’s IT journal headlines emphasize the current trend toward larger-scale data storage, processing, and transfer. Terms like “Analytics” and “Big Data” reinforce the notion that this is a new approach requiring a shift in computing goals and methods. [3] While these goals are similar to those of the data center still ruled by mainframes, the combination of this increased large-scale data processing and desire for a graphical interface the personal computer user is comfortable with, dictates a different approach than the mainframe provides. A limiting factor for client/server computer users as it applies to this recent emphasis on large-scale data processing is the networking performance issues caused by something called the “Last Mile” problem. The Last Mile refers to the “telecommunication backbone along the relatively short distance to and from the home or business”. The Last Mile of an Internet connection limits
performance because bandwidth drops substantially unless an organization selects an expensive solution such as running fiber-optic cable to the curb of the office building. [4] Even an organization maximizes the local area network the entire distance up to the Internet connection, the Internet itself is a source of performance issues. In this thesis, I intend to demonstrate that because of the Last Mile problem, and associated Internet network performance issues, client/server architectures will not perform adequately for large-scale data processing applications. I also intend to demonstrate that different network architectures are required to get the data to the user while maintaining acceptable performance. The architecture I propose to optimize this type of application centralizes data storage, processing, and transfer as much as possible, similar to a mainframe environment.
10
with no Internet connection at all. I believe a shift toward the virtual client architecture model will improve users’ perceptions of this type of application and possibly workplace productivity as well.
Section I – Some Causes of WAN Application Performance Problems
Network, Protocol, and Internet Factors
Analysts often cite Network limitations as the cause of poor wide area network (WAN) application performance. Two 2012 technical articles discussed poor application performance, the first article focusing exclusively on network causes. The second article claimed to focus on non-network problems, but the final cause mentioned was slow network services. [5, 6] Network causes for application
performance problems can be broken into latency issues and bandwidth limitations. Latency is defined as comparatively slow data packet round-trip time. Latency is the result of a combination of the distance traveled and network-related factors. Bandwidth limitations, or throughput restrictions, are measured in Bits per Second (bps) transferred. For most WAN applications, the bit per second rate is lowest over an Internet connection. There are also other hardware, and even software limitations on application performance. Examples of hardware limitations would be processor speed or data storage read rate. Software limitations might include database table design or the data structures used at the application layer. I will review these factors, and some potential solutions, in the next sections of this paper.
Causes of Internet Latency
Latency is the time required for a single data packet to travel across a network to its end. A classic study of network data transmission defines latency as:
[T]he timing of data transfers on a communications channel or network. One important aspect of latency is how long it takes from the time a request for data is made until it starts to arrive. Another aspect is how much control a device has over the timing of the data that is sent, and whether the network can be arranged to allow for the consistent delivery of data over a period of time. Low latency is considered better than high latency. [7]
A term that is associated with latency is round trip time, a measure of the time a single packet needs to travel from point to point. The two constants for latency in a network are light speed and the distance between the points. No data packet can travel faster than light speed, and they usually travel much slower than that. It may seem obvious that distance is the primary consideration in latency, and therefore
11
protocol is TCP/IP, as it is for many WAN applications, there are five protocol related causes of latency. The following sections investigate both some overarching causes of latency issues, and those specific to the TCP/IP protocol.
Propagation Delay
The delay involved in one packet traveling the physical distance from point to point, or round trip time, is the definition of latency. A data packet can only travel as fast as the speed of light, and usually travels slower than that. The distance traveled and the transmission mediums affect propagation delay. As mentioned, distance is a constant, but the transmission medium can be Fiber Optic Cable, Satellite, Copper Cable or some other signal propagation medium. Propagation delays “arise because a signal requires a small amount of time to travel across a wire or optical fiber”. [8] Longer distances naturally result in higher propagation delay, as does anything that affects the transmission speed of a data packet. Satellite data transfer rate, for example, will be slower than fiber optic data transfer rate because satellite uses a radio wave while fiber optic uses a light pulse. Once established, propagation delay does not vary greatly, but propagation rate is a primary factor in determining latency.
Serialization Delay
Serialization is the process required to transform bytes of data in memory to a network transmittable bit stream. Serialization delay is a fixed value that measures the time required to translate a data frame onto a network interface. While the value is fixed, small data packet size will increase this delay because more serialization must occur. The problem is significant enough that voice communication requires
adjustments, but for TCP/IP data transfer serialization is not likely to be a major source of delay. [9] Data packet size and a network’s maximum transmission unit (MTU) value will determine this delay rate. Data Protocols and Latency
“Data communications protocols at various layers in the protocol stack use handshakes to synchronize the transmitter and receiver, for the transmitter and receiver to update each other on link status and to correct for errors in transmission”. [10] When the TCP/IP protocol is used, this means two things. First, each packet travels through the Network Access, Internet, Transport, and Application Layers regardless of the protocol in use. Second, the protocol may change through various segments of the Internet route,
12
TCP/IP Protocol Stack
The TCP/IP Protocol Stack demonstrates the layers each packet of most Internet applications must traverse to get from its point of origin to its destination. The stack consists of five layers, starting closest to the hardware layer and moving toward the application layer. The significance of these layers is twofold. First, the layers indicate how many translations a packet must negotiate to get to its destination. Second, the layers hint at a problems specific to the TCP/IP protocol – congestion avoidance and flow control. These TCP/IP techniques are designed to ensure reliable data transport, but they also result in additional latency when combined with routing delays common to the Internet.
Network Access Layer:This layer causes the serialization delay problem mentioned earlier. Converting a data packet into a transmittable data frame is the Network Access layer’s function. Delays may also result from configuration issues at this layer, such as small packet size. The fact that there are several possible technologies used for this transfer – Ethernet, Wireless, Fiber Distributed Data Interconnect, others – also means network access conversion may happen more than once which multiplies this delay. [11]
Internet Layer:The Internet layer serves three main purposes: transmitting data to the Network Access Layer, routing the data to the correct destination, and managing transmission errors and reassembling. TCP is a connection-oriented transmission technique, meaning each packet as treated as an individual unit. As a result, when there is a data transmission error, TCP resends the packet rather than correcting it. Higher levels of packet loss increase the need for packet retransmission and negatively affect network performance. The TCP/IP protocol manages the need for repeated retransmissions by increasing the time between those retransmissions. As a result, a fast but congested network may perform worse than a slower, low traffic network. [12]
Transport: The transport layer converts data packets into a format that allows sending them to and receiving them from multiple devices at various locations. Transport acts as a sort of conversion process between the more hardware focused lower layers and the application layer. The focus of the transport layer is multiplexing/demultiplexing, which is collecting and converting data packets for transmission. Because TCP/IP is a connection-oriented protocol, confirmation that one packet was received is required before the next packet is sent. There is inherent delay in the transport layer conversion process, which increases with a connection-oriented protocol like TCP. Smaller packet size or retransmission increases the number of conversions required and further hinders performance. [13]
13
Domain Name System (DNS), or File Transfer Protocol (FTP). The protocols communicate through a port, and multiple protocols may be used in conjunction. Internet Protocol Addresses resolve through DNS, such as 13.245.1.3 resolving to a host name like www.mynetwork.com. Because DNS resolves the numbers to names and back, it can be a substantial source of network latency. [14]
Routing and Switching Latencies
As briefly discussed earlier, a frequent cause of latency is network bandwidth contention and wait queues (buffering). At any given time, the amount of traffic on a segment of an Internet connection varies. The more competition there is for the segment’s resources, the longer it will take each packet to travel through that segment because a congested router Internet router will create a queue. As a router’s capacity fills, it creates a wait queue to process data packets as resources become available. A description of this process is below:
Queuing “…refers to the amount of time an IP packet spends sitting in a queue awaiting transmission due to over-utilization of the outgoing link after the routing/switching delay has been accounted for. This can add up to an additional 20 ms of latency.” [15]
A twenty millisecond response time may seem insignificant, but a test of transit time between New York and California indicated that this would result in a twenty percent slowdown per packet.* Queue buildup delays packet arrivals, and can result in buffering at the user end. Application performance worsens as packets arrive more and more slowly. Queuing delays at routers and packets can also cause redirection and result in related packets travelling multiple routes to get to the same destination. As mentioned in the Application Layer description, longer delays in packet delivery result in the TCP/IP protocol increasing the delay between packet retransmission, creating a cycle of increasing latency. This factor reinforces the need to minimize the number of packets that travel over the Internet to improve user performance.
MPLS Latency
Multiprotocol Label Switching (MPLS) is a common method for transmitting data packets across the Internet. According to one study of MPLS performance, “[a] growing number of OSPs and ISPs have
adopted MPLS networks which offer more TE [traffic engineering] flexibility than the traditional Interior *Sending multiple ping requests from a computer in Rochester, NY to the Stanford University website
(www.stanford.edu) resulted in an average ping response time of approximately 100 milliseconds, meaning 20 more milliseconds would be a 20 percent longer response time.
Gateway Protocols such as OSPF (Open Shortest Path First) and IS-IS (Interior System to Interior
14
local network’s boundaries, and removes the MPLS “wrapper” when the packet reaches its destination network. MPLS provides its own routing mechanism, which includes a number of configuration options. A 2011 study determined that MPLS networks “encounter severe latency inflation” for an intercontinental network with tens of data centers. [16] MPLS add an additional layer of potential and variable latency to what is inherent in the TCP/IP protocol.
Latency Summary
Before reaching the Internet, the amount of application delay caused by latency is mostly fixed. The distance packets must travel is a constant, as is the maximum speed any one packet can travel. The amount of processing and conversions required by a specific data transmission protocol is constant. The variance begins when packets reach the Internet. There are unknowns related to routing paths and queues, as well as protocols different Internet Service Providers (ISP) may use to transfer packets passing through that ISPs section of the Internet.* As described above, adding an Internet routing protocol like MPLS increases both latency and the variability of that latency. However, most of the factors affecting latency are outside the control of most wide area network administrators. The ultimate ceiling on WAN
application performance will always be the minimal possible latency for the protocol or protocols used on that network.
Bandwidth Limitations
Internet/network bandwidth, or throughput, is the most obvious cause of the WAN application
performance problems. [17] A local network set up with affordable newer hardware may transfer data at one Gigabit per second (1Gbps). [18] Compare this to a T1 Internet connection, which transfers data at 1.544 Megabits per second. There are multiple solutions for improving throughput, including:
Increasing the committed bandwidth of the existing channel or adding links so there are more channels for the data to travel
Reducing the number of data packets that have to travel across the using data compression, bandwidth-conscious code, or smaller file sizes
Keeping the number of packets that travel across the Internet to a minimum
15
While increasing bandwidth on a local network is relatively inexpensive and simple, increasing Internet bandwidth is more expensive and less reliable. Upgrading from a 1.5 Megabits per second (Mbps) T1 connection to a 44 Mbps connection increases the monthly charge approximately three times the cost of the lower bandwidth connection. [19] When compared to solving latency problems, solving bandwidth problems is easier, but it is an expensive proposal for wide area networks because of the Internet connection costs. The following paragraphs will define and explore the factors related to bandwidth limitations in detail.
The definition of throughput or bandwidth is:
[H]ow much actual data can be sent per unit of time across a network, channel, or interface. While throughput can be a theoretical term like bandwidth, it is more often used in a practical sense - for example, to measure the amount of data actually sent across a network in the real world. Throughput is limited by bandwidth, or by rated speed. [20]
Increasing throughput without adding or changing equipment is a relatively simple matter over a local network compared to accomplishing the same goal over an Internet connection. The first option is to change protocols from Transmission Control Protocol (TCP) to User Datagram Protocol (UDP). By default, TCP waits for acknowledgement that the destination device received a packet before sending the next packet. UDP does not do this, which is one of the reasons IP Telephony solutions generally use UDP. A list of tasks TCP completes that UDP does not will help to demonstrate why UDP is faster. The following is a list of steps required to complete transmission of a data packet using TCP, but not UDP:
1. Establish connections before sending data
2. Provide or wait for packet receipt acknowledgement 3. Provide a guarantee that the message will arrive 4. Detect and retransmit lost messages
5. Ensure data arrives in the same order it was sent 6. Provide congestion handling or data flow management
16
several packets at once, without waiting for an acknowledgement from the other end. Sending multiple packets at the same time serves the same purpose as using UDP rather than TCP.
Another popular approach to improve WAN performance is Quality of Service (QoS) or Traffic
Prioritization. QoS prioritizes the type of packet as defined by the network administrator using a flag bit in the data packet header. For example, a video conference packet receives highest priority because delays in video packet reception have a dramatic effect on the quality of the transmission. Conversely, an Email packet receives lowest priority because Email is an asynchronous communication technique and does not require a consistent flow of contiguous packets. QoS accomplishes the following tasks that standard TCP/IP does not:
Reserving a portion of network bandwidth so the communicating devices can count on that amount of bandwidth
Latency limitation
Prioritizing the QoS traffic over “normal” network packets
Network traffic shaping through buffers and limits
Network congestion avoidance
A network administrator will use QoS frequently for transmission types requiring both speed and reliability, such as streaming video. [22] Because requires prioritization and guaranteed resources, QoS cannot be used with all types of traffic. This limitation limits QoS utility for standard application data transfer.
Reducing the total number of packets sent is another approach that can improve application performance significantly. One technique for sending fewer packets is caching and reusing those packets already sent. A second approach, one this thesis clearly indicates works well for high data transfer activities like file downloads, is localizing as much of the packet transfer within the higher throughput and lower latency LAN as possible. As demonstrated in a later section of this study, the packets transferred using virtual clients over the much slower Internet connection is limited to keystrokes and mouse clicks sent to the server, and pixel data returned to the client. The entire file does not transfer across the WAN, as it does when using client/server architecture.
Bandwidth Summary
17
alternatives include using a different protocol, or prioritizing specific types of traffic. Those solutions are normally reserved for high bandwidth types of data such as voice or video. Data compression, larger data packet size, or sending fewer packets, is easier to achieve for standard WAN application use. The next sections of this paper explain other approaches not related to networking or protocols.
Other Approaches for Improving WAN Application Performance
Network factors play a significant role in Wide Area Network Application Performance. There are also multiple other approaches used to improve network application performance. Not all of these approaches exist specifically for WAN applications; the same server hardware and software limitations that apply to a local network also apply to a WAN. The approaches that improve LAN application performance should also improve wide-area network application performance, but to a lesser degree because of the Internet latency and bandwidth delays associated with WAN applications. The following paragraphs review studies of hardware and software techniques used to improve network application performance. The goal of this section is to demonstrate that application performance exists within a complex environment. Architecture Solutions
Several application performance solution studies focus on configuring servers optimally to improve database application performance. This can mean hardware changes such as a processer’s data cache size, or software modifications like using controller software to manage grid-computing performance. The first study I reviewed capitalizes on current data center trends that include large numbers of inexpensive servers and newer switches and routers that are both programmable and high speed. The large number of servers provides the opportunity to scale based on the load placed on an application. All of the available hardware allows resource usage to expand and shrink as required. Newer routers and switches serve two purposes in this environment. First, they provide both data transfer speed and programmability to enable load balancing so performance is consistent. Second, these switches and routers provide network
addresses for all of the servers so they appear as part of one network. Combining a high quantity of hardware with the ability to provide addresses for that hardware to balance and forward the workload quickly maximizes application performance in these data centers. Since some data centers have as many as multiple thousands of servers, the elasticity of this type of setup must be high to accommodate a fluctuating workload. [23]
Server Optimization
18
by creating additional virtual pre-fetchers, effectively keeping a larger portion of database data in the cache. Larger caches allow for faster retrieval than writing to and read from a physical disk drive every time a user accesses that data. PV structures itself similarly to the cache hierarchy built into the server, and supplements it by adding to that cache. This approach does require additional disk and memory space, but to balance these requirements out the authors demonstrate that using PV frees about the same amount of CPU resources that the Level 2 hardware cache occupies. This enables the L2 cache to do its
processing more efficiently and improves system performance as a whole. [24] Virtualized hardware is an approach showing promise in the data cache and other areas.
A related 2006 study approaches CPU scheduling in a very different manner. This study investigated using input and feedback through a joystick to allow users to select individualized preferences regarding application performance versus the costs associated with that performance. If used as a tool by network administrators, user data on a larger scale could identify a sensible cost/benefit point for database and other network applications. In other words, collecting user data from the key presses and mouse clicks of a network’s users would help administrators identify acceptable compromises for hardware purchases, CPU scheduling, network and Internet bandwidth requirements, even electricity usage. The software could also allow users to select their own performance level, and review the cost of guaranteeing that performance level after testing. Ultimately, this tool does little to improve the upper end of WAN
application performance: that was not its goal. The software does allow users and network administrators to understand and identify where a reasonable performance/resource point is. Particularly with WAN applications, this would allow fairer resource allocation and so more consistent and predictable performance for all users. [25]
The next approach for improving application performance is common even in client computers and other devices. Multithreading is worth remembering as a server hardware technique intended to obtain better application performance. In newer processors, multithreading is way of processing two or more instructions per central processing unit cycle to reduce or eliminate the processor and cache as a bottleneck. [26] A 2007 study focused on simultaneous multithreading, which takes single processor multithreading a step further. Simultaneous multithreading involves dividing the approach into
19
relational database join operation, and their tests demonstrated that multithreading resulted in substantial performance improvements. Application speedups measured between 4% and 34% when using thread level parallelism. Level 2 cache pre-fetch misses decreased between 39% and 96% when using the author’s speculative pre-computation algorithms. These results should be even more valuable when considering the additional CPU load introduced by virtualized servers and clients. I will discuss those additional CPU loads later in this section.
Another study benchmarked reliability attributes of application performance as a way of presenting s a mechanism to reduce data errors and guarantee a certain performance level. [28] This research approach differentiated between hard and silent disk data errors. Hard data errors are major problems like disk failure, while silent errors result in applications retaining undetected bad data. The study proposes that silent data errors in high-end servers average between 0.42% and 0.46% of disk reads, higher in lower-end products. To reduce the silent error rate, the authors proposed an approach named Continuously Available Replicated Programs (CARP). As the name suggests, the goal of this system is to replicate data in order to detect and recover from silent data errors. The study results showed efficient detection and recovery from silent data errors with less than one second recovery time and minimal overhead. In addition to improving application performance by reducing data errors, CARP would also provide a failover mechanism in the event of hard data error.
Researchers investigated disk data block placement in a collaborative experiment conducted by several universities and the Northrop Grumman Corporation. Using data-intensive scientific computing calculations on distributed computing resources, the authors developed approaches of data cleanup and resource scheduling to measure how effective these data block management techniques were for
optimizing workload levels. The methods used for the study were effective. Their approach reduced disk space requirements as much as 57%. The authors also successfully demonstrated that they could allocate tasks to areas with available resources. Despite accomplishing their technical goals, the results forced the authors to conclude: “it is not sufficient to consider only data relocation or data locality when running data-intensive workflows in space-constrained environments”. [29] Optimizing available resources may not be enough to provide acceptable application performance; additional changes could be required.
An increasingly affordable approach to improving application performance is using solid-state disk drives (SDDs) on database or application servers. SDDs improve both read and write times dramatically
20
variety of applications. [30] To maximize database application performance, including Online
Transaction Processing Systems and Decision Support Systems, the recommendation was to use SDD drives. As SDD’s continue to become less expensive, they are likely to see increasing usage. Moreover, while faster data read times would improve performance, there are multiple possible factors, approaches, and architecture modification possibilities to improve network application performance. Virtualization is another of these approaches.
Virtualization
Optimizing physical servers is not the only hardware management approach for improving network application performance. The following studies investigate hardware virtualization and its effect on hardware resources. Virtualization is an increasing trend because it allows for economies of scale in terms of both hardware purchase costs and electricity usage. One large physical server can house multiple virtual servers, reducing electricity usage and the amount of hardware drastically. One virtualization study completed by Spanish researchers examined the idea of using virtual machines for load balancing and scaling. [31] The authors performed an experiment using virtual machines as grid computers, and found that this approach was beneficial in several ways. The study was set up so that new machines started and provisioned resources as required. This self-scaling approach balanced the load between the compute nodes. As the load increased, virtualization ensured that additional resources were available to manage that workload. Naturally, this layer of virtualization software is not without cost; the authors found that the virtualized approach increased hardware usage 10% when used with Xen hypervisor virtualization software. They also found that this approach improved how reliable and secure the software was. Virtualization continued to improve performance further as existing resources reached their limit and dynamic allocation added more hardware resources.
Another virtualization study investigated the resource requirements of database systems on virtual machines. [32] The paper begins by pointing to several advantages of using database systems in virtual environments. Advantages include immediate and possibly automated scalability, consolidation of hardware resources, and easy deployment of new resources. The authors continue by pointing out that virtualization does result in performance costs, and state that the goal of the study is to find out how much of a performance hit using virtual resources causes. The authors conducted their experiment by
configuring identical hardware to run the same software and application tests. One server was physical only and the other used Linux Xen virtualization. The virtualized system suffered performance
21
some minor adjustments, the virtual database queries averaged ten percent performance degradation, while some of the queries actually ran faster in the virtual environment. As processor speeds increase and hardware prices drop, the conveniences of virtualized databases may prove worth the additional hardware expenditure they require.
Hardware virtualization introduces problems in addition to hardware resource overhead. A study conducted by University of Berkeley researchers addresses one of these problems. [33] The authors investigate how to configure virtual database servers to optimize database performance. Hardware virtualization facilitates this approach by allowing the allocation of simulated CPU, memory, and disk resources. In addition, many database packages have their own query optimizing resources. The goal of this study was to identify a cost-modeling algorithm. This algorithm would assist with the process of identifying the amount of hardware resources required to allocate to a specific database in order to allow it to perform well, while still maximizing hardware usage. The authors ran several queries, identifying a point where increasing resource allocation ceased to improve query performance for any of the queries to a significant degree. The authors conclude that identifying this point of diminishing returns is both possible and worthwhile. They also point out that since the hardware is virtual and so software-based, it should eventually be possible for the virtual machine to monitor frequently run queries and dynamically allocate an appropriate amount of virtual memory and CPU resources.
Grid Computing
22
demonstrated performance gains and fault tolerance with minimal overhead. The authors note that both Twitter and Facebook were testing their invention beginning in the summer of 2011.
Cloud Computing
Transitioning client resources to a distant server is an approach that becomes ever more practical as hardware becomes cheaper and servers become larger. [35] It is also similar to a much earlier technology – mainframe – because both centralize most of the resources in the data center. The cloud computing model makes all applications the client. Clients access web applications through a browser, sometimes the only application on the client device. These configurations use tiered web applications almost exclusively, and the applications have grown more feature-rich and more diverse in recent years with developments such as Microsoft Office 365 and Google Apps. The client device is entirely dependent on its Internet connection for this approach to work, but it does enable centralization of most of the hardware and software resources in the data center. A recent popular example of a web-only client approach was Google’s Chromebook, which has not sold well as recently as 2011. [36] Despite poor sales, the approach offers promise of more secure, centralized data and centralized management. However, the combination of still limited Internet capabilities and people’s reluctance to change means that adopting a web-only client approach requires improvements to Internet bandwidth.
Database and Coding Solutions
Database Design Solutions
Designing performance improvement into WAN database applications can be a goal on its own, or done in conjunction with the hardware and software techniques mentioned so far. Database administration should include designing solutions to maximize the performance of applications that rely on the database. Tuning a database through table design, indexing, or query tuning is good standard practice for any relational database application. Using partial or full table partitioning for large tables, or distributing the database across multiple servers or sites will improve performance significantly. Another approach is resizing the cache or data block size on the hard drive blocks. Any of these should improve some aspect of application performance, and tuning the database to perform efficiently is valuable for any database large enough to distribute over multiple locations. [37, 38]
Coding Alternatives
23
The problem definition for All Pairs is:
(set A, set B, function F ) returns matrix M:
Compare all elements of set A to all elements of set B via function F, yielding matrix M, such that M[i,j] = F(A[i],B[j]).
M[i,j] is the key pair that this algorithm generates in one iterations. It repeats through all of the elements producing key pairs that can be located faster than the individual elements.
Another technique for using application programming data structures to improve database application performance is called “Map-Reduce”. Map-Reduce builds on the keyed pairs data structure approach by using key values to reduce the data values during a search. In other words, breaking data items into categories first and then only searching within the appropriate category. [40] The value of keyed pairs and map reduce for a large-scale database application seems evident, and it is worth ensuring that
programmers would consider using them in distributed database applications. The prior sections
demonstrate that both database design and coding techniques can improve WAN application performance. While each of these approaches seems to hold great promise for improving database application
performance, the database administrator should research in advance and used with caution. This caution is warranted because research indicates that some approaches will improve performance for one function, such as querying, while reducing the performance of another, such as database write times.
Research on Distributed Application Performance
The intent of the prior research review was to accomplish two goals. The first goal was demonstrating the number of factors that negatively affect WAN application performance. Many of these are network factors, but there are also server hardware, architectural, database and application tuning, and other factors. The review also demonstrated the large number of approaches used to improve performance and decrease latency in distributed applications. The section was an analysis of the base factors and solutions related to that performance impact. There are also studies investigating approaches similar to the
24
approaches. While these studies are similar in goal to the one conducted for this thesis, they are not similar in approach.
Cloud versus Cluster Computing
Cluster computing has been popular in scientific circles for some time. As described in an earlier section of this paper, cluster computing relies on multiple volunteer nodes to donate their available processing resources and contribute to a resource-intensive application such as atmospheric modeling. One academic study on cloud versus cluster computing examined:
A performance and financial comparison of cluster and cloud computing for similar tasks
A tradeoff comparison of the two approaches based upon their performance attributes and financial requirements
An investigation of the possible benefits gained by combining the two techniques
The authors accomplished this goal by comparing Amazon EC2 performance to multiple Grid Computing approaches, including the popular SETI@home. The study data demonstrated that the cost of grid
computing started to exceed that of cloud computing for tasks that exceeded 1,000 volunteer nodes. The more nodes needed above 1,000, the greater the cost advantage of cluster computing became. The authors also detailed finding from a hybrid approach, using a cloud resource to manage tasks smaller than 1,000 cluster nodes and expanding to cluster resources when necessary. This hybrid approach proved the most cost-effective. This study is from 2009, and as hardware and Internet bandwidth costs continue to decrease, other architectural models will fare better in a cost comparison. [41]
25
Another study gathered data while running an Atmosphere-Ocean Modeling application on Amazon’s Elastic Compute Cloud (or EC2). [45] This study analyzed the technical aspects of running such an application in depth before reaching some general conclusions. The technical analysis determined the resource requirements to run the application efficiently and map those requirements to appropriate EC2 resources. The authors concluded that the results present a convincing case for cloud computing while identifying shortcomings. The first caution is that performance is below that of a dedicated
supercomputing center; which should be no surprise in a shared environment like EC2. Amazon recently began offering high storage EC2 instances to provide sufficient resources for this type of high
performance computing resource. [46] The second caution is that bandwidth constraints result in a significant performance degradation compared to much higher bandwidth supercomputing centers. Once again, this should not be a surprise, and a goal of the current study is to identify an approach that will reduce the effect of bandwidth-related delays.
A similar study analyzed using cloud computing for a widely used astronomy application. This study compared application performance over local resources versus cloud resources. The authors point out that local resources “are not a scalable solution” while the cloud provides that flexibility. [47] The authors performed their experiments using both local and cloud resources. They found that both approaches were limited. A local data center is limited to the resources available to it, requiring that either a large upfront expenditure for underutilized hardware, or acceptance that the software will be limited by the hardware available to it. Using the cloud enabled the scalability the authors sought, but there were network and queuing delays when using associated with this architecture. The author’s next approach was using load balancing to limit these delays. This experiment provides evidence of a problem this thesis hopes to solve - how to make scalable cloud resources perform at a level where bandwidth does not create an
unacceptable delay.
The preceding studies constitute early efforts at using cloud resources to run high performance computing applications such as atmospheric and astronomy modeling programs. While the conclusion of those studies was that public cloud resources were not feasible because of the variable workload and financial aspects, the authors did concede that with enough dedicated compute resources the cloud architecture could run these high demand applications. In the short term, this has meant developing very robust machines like IBM’s Watson. Longer term, as companies like Amazon and Google develop their
26
Another study intended to demonstrate the cloud architecture as a platform for office applications measured energy consumption of a cloud network compared to a more traditional connection to a data center. The authors hypothesized that the combination of running fewer servers at close to maximum utilization, and the reduced network traffic generated by a centralized virtual network, would significantly reduce energy consumption. The authors analyzed energy consumption using three types of applications. The first type of application required only one connection: for example, a drop box for storing files. For this type of application, the cloud was slightly more efficient for loads data transfer of 2.1 Gigabytes or less. The second type required multiple but asynchronous connections such as a web Email application. For this type of application, the cloud was more efficient initially and varied greatly in terms of when it caught and exceeded the client-server model. The third type was an application platform such as Microsoft Office 2010 versus the online Office 365. In this application, the cloud was always more energy efficient. The authors also pointed out the impact of increasing client nodes and found that the cloud was more efficient than a client-server approach for up to 2 million total nodes. [48]
Application Performance in the Cloud
There are many cloud application performance studies; and considering the current increase in cloud model usage this research is likely to continue. A 2009 study investigated the option of dynamically migrating virtual application servers to sites closest to the largest number of users. [49] The theory behind this is to make up for latency and bandwidth-related delays by moving the servers to the spot most convenient for the users, and doing so “on the fly.” This approach, which the researchers named
VICTOR, uses physical and virtual routers to turn multiple data center sites into one logical network. As the user nucleus moves from one data center location to another, or resource usage at a data center approaches maximum levels, another data center takes over some portion of the workload. This is
network load balancing on a grand scale. Application users can be across the state or across the globe and the virtual network will simulate a single data center by utilizing the virtual network to shift the focus of an application’s server resources. The underlying goal is to use the immediate geographic mobility enabled by hardware virtualization to optimize application performance.
27
millisecond, so a user would be unlikely to notice the difference. This study compared different types of virtual desktops, and an ongoing question throughout this thesis is how virtualized desktop performance compares to physical desktops.
The authors of a study published by Hewlett-Packard state that response time alone is not an adequate measure of application performance. This study explored the combination of “resource utilization, mean response time, percentile response time, and throughput.” [51] The authors also suggest that behavior of applications must be factored into multiple in, multiple out controller application designs. They conducted an experiment that measured mean response time using a variety of bandwidth and processing settings in both open and closed loop systems. They found that bandwidth was not the only significant constraint, when bandwidth was adequate the processing load increased to capacity. Their proposed solution was a dynamic resource allocation tool still in the making as of 2010.
A 2011 study examined response time in tiered web applications. [52] This IBM and Penn State University study added load balancing using multiple proxy servers and a timer to control access to the database servers. The application management system, named SCOPS (Sub-Controller on Proxies and Servers) uses a combination of load balancing, overload protection, and Quality of Service differentiation to address application performance and consistency issues in a tiered database application. The practical experiments performed as part of this study demonstrated that the SCOPS system improved runtime overhead, resource overload protection, and service level classification. The authors hoped to extend their study to include network bandwidth and memory management in the future. The studies reviewed in this section proposed various approaches to improve distributed application performance. Load balancing was a common theme, as was geographically distributing a user’s current data center resources. The next section of this study examines a different approach to improving performance; this is my own research on the subject.
Section II – Performance Comparison Experiments
28
dependent upon bandwidth rather than latency. Users would definitely notice the differences measured here, but since it is a large file, this test does not accurately represent the totality of common office work tasks. The third experiment measures the time it takes to perform a small subset of common office functions. Creating or editing a document or spreadsheet, and sending and reading Email are the tasks. The final experiment measure the time required to return 5,000 database records using each architecture model. Cumulative latency measures out to the same value, but the other test results strongly suggest that virtual client architecture would provide superior performance to the client/server architecture that predominates today.
Network Devices
29
Table I – Physical and Virtual Resources
Device Type
Virtual or Physical
Resources
VMware View Administrator Server
Virtual - 4 Processors - 4 GB RAM
- Windows 2008 Server - VMWare View
Administrator Virtual Client Server Virtual - 1 Processor
- 768 MB RAM - Windows XP
Professional
- VMWare View Agent Active Directory Server Virtual - 1 Processor
- 384 MB RAM
- Windows 2003 Server - DNS and Active
Directory
OpNet Server Physical - 1 x 3.41 Ghz Pentium 4 Processor
- 3.25 GB RAM
Virtual Client Virtual - 1 Processor - 512 MB RAM - Windows XP
Professional
- VMWare View Client - WinTask
Router (2) Physical - Cisco 2600
30
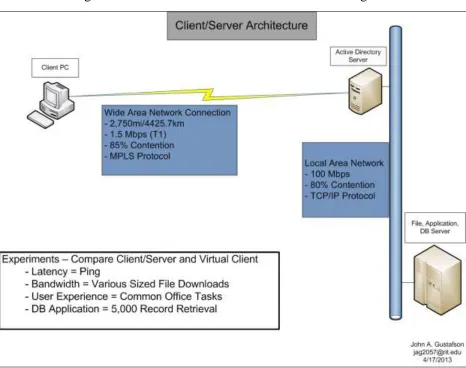
Network Diagram
The diagrams below represent the networks that the hardware and software described in the previous section were used to model. Figure I is a traditional Internet client/server model. In theory, this architecture should always perform the slowest because it sends the most data across the lowest
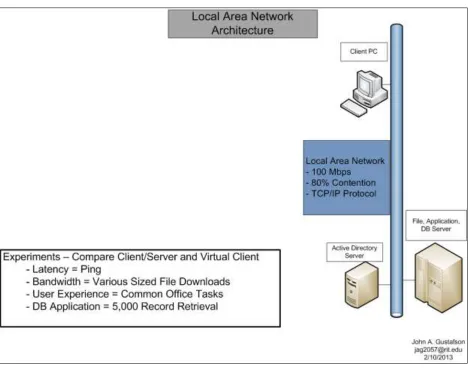
bandwidth connection. Figure II models the local area network; this architecture should provide the best performance because 100% of the data travels at speeds Internet connections rarely approach. The local area network architecture should also perform the best because the distance in a local area network is much less than most wide area networks. Figure III represents the virtual client network: my objective for this thesis is to prove that for a substantial portion, if not all, of the tasks I timed the performance of this architecture is substantially better than that of the client/server architecture and approaches local area network architecture performance. The latency and performance test results from all three architectures is the focus of the study.
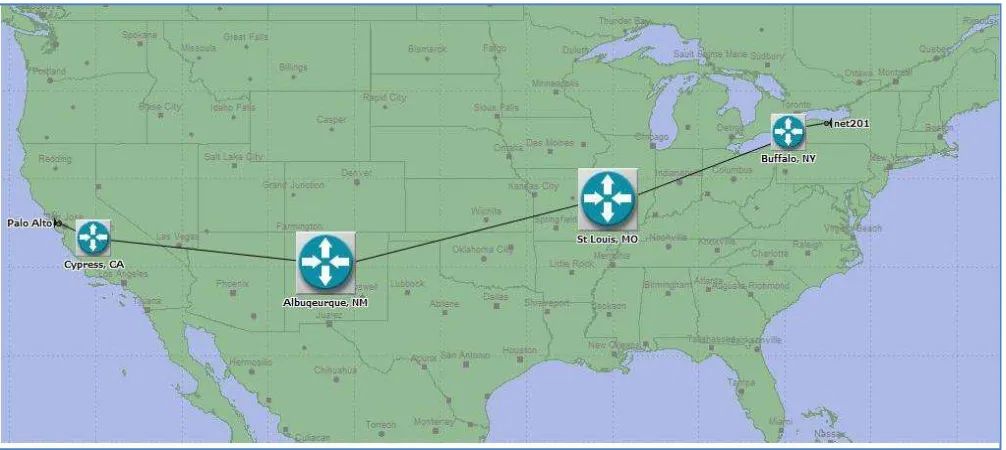
Network Model
[image:31.612.74.577.478.703.2]The network for this preliminary experiment was a point-to-point Internet connection from a Rochester, New York network to a network near to San Francisco, California. A network trace route confirmed that there are five Internet router stops for these packets – Rochester NY, Buffalo NY, Saint Louis MO, Albuquerque NM, Cypress CA, and Palo Alto CA. This experiment simulated a T1 line with some network traffic. A screen shot of the simulated network created using OpNet modeling software is below:
31
The geographic network spans approximately 2,750 miles. This is sufficient distance to generate enough latency and bandwidth degradation to determine if there are performance differences between the three architecture models. The following sections describe and display these architecture models.
Client/Server Wide Area Network Architecture
32
Figure II – Client/Server Network Architecture Diagram
Local Area Network Architecture
33
Figure III – Local Area Network Architecture Diagram
Virtual Client Wide Area Network Architecture Diagram
34
Figure IV – Wide Area Network with Virtual Clients
Experiments and Results
Experiment Setup
This section describes the experiments I conducted and the results those experiments generated in order to identify how virtual client architecture performance compares to client/server performance. The
experiments increase in complexity, beginning with a simple ping test to measure network round-trip time and latency. The second experiment compares the time it took to download a moderately large file using the three architecture models. The third experiment compared times required to complete a set of common office software functions. Checking and sending Email, creating a document file, and editing a
35
Experiment I - Ping Reply
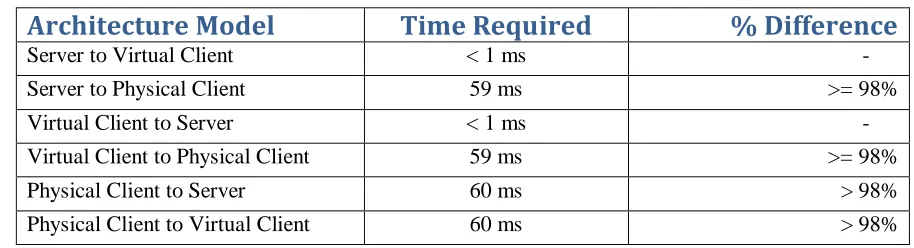
Using physical boxes for the hardware and virtual clients, domain controller server, and virtual client server, I ran the OpNet model shown in Figure I to measure Ping reply times. Table I below displays the results, which are consistent when pinging to and from each machine. The virtual client takes very little time to get a reply from the server because they are on the same local network and connected with a one Gigabit per second connection. The server and virtual client both took much longer to get a reply from the remote machine located in California. As shown in Table II below, the remote physical client needed 60 milliseconds to get a response from either the virtual client or the server. This result is not surprising, as the effect of the physical distance alone would mandate a longer time for the remote machine to receive a response, and because the connection between the remote machine and both the virtual client and server is much slower than the connection between the server and virtual client. The results do suggest that
[image:36.612.91.548.355.479.2]bandwidth-heavy applications should provide the user with faster response time when using the virtual client architecture.
Table II – Ping Reply Results
Architecture Model
Time Required
% Difference
Server to Virtual Client < 1 ms
-Server to Physical Client 59 ms >= 98%
Virtual Client to Server < 1 ms
-Virtual Client to Physical Client 59 ms >= 98% Physical Client to Server 60 ms > 98% Physical Client to Virtual Client 60 ms > 98% Experiment I Analysis
As shown above, the combination of physical distance and much different throughput rates meant the remote physical client required at least 59 to 60 times as long to receive a ping reply compared to the virtual client on the same local area network. Sixty milliseconds is not a long time and so this may not seem like it would matter to the remote user. However, the exponentially longer ping reply times, multiplied by hundreds of thousands or even millions of packets a month, would result in a noticeable difference for all users of the wide area network over time. In addition, packet loss and retransmission add up to additional latency not accounted for in this study. One of the benefits of the virtual client
36
Response time for the wide area network was exponentially slower than the local area network. The local area network response time averaged less than one millisecond while the wide area network averaged approximately sixty milliseconds. This clearly shows that round-trip latency, which has the limit of light speed minus any existing network delays, will be about sixty times over the wide area network connection compared to the local area network connection.
Experiment II – Opening Remote Files
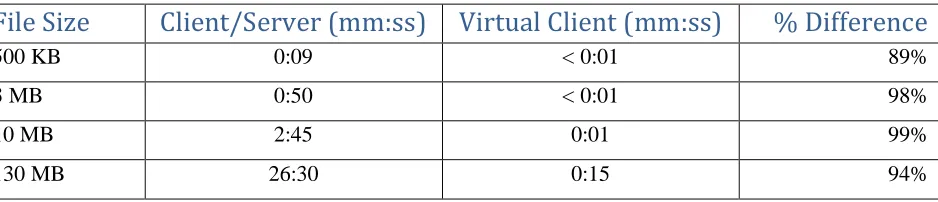
[image:37.612.76.545.329.430.2]The second experiment more closely resembles a set of common user functions. These tests compared the time required to open four files of varying sizes on both client/server and virtual client architectures. The file sizes ranged from 500 kilobytes to 130 megabytes. The results are averages of each test repeated three times, with the exception of the 130 MB download. The times to download the files are below using all three configurations was measure, and the results of this experiment are below.
Table III – File Download Results
File Size
Client/Server (mm:ss) Virtual Client (mm:ss)
% Difference
500 KB 0:09 < 0:01 89%
3 MB 0:50 < 0:01 98%
10 MB 2:45 0:01 99%
130 MB 26:30 0:15 94%
Experiment II Analysis
What do the results above demonstrate in terms of the perceptible performance differences a user would experience? The average difference in file download times between the client/server and virtual client architectures is 95%. For larger files, this means several minute’s difference, which indicates a substantial improvement in productive work time for someone who works with remote files frequently. The
popularity of software such as Microsoft Office and Adobe Acrobat indicate that file downloading and uploading plays a major role in office work. A 95% reduction in the time required to download and upload files from a file server strongly suggests the possibility of improved network user satisfaction and productivity.
Experiment III – Common Office Tasks
The third experiment timed a set of common office tasks in order to compare performance in a practical, end user-oriented context. The tasks included:
37
Opening and editing a (10 kilobyte) spreadsheet on the same file server
Sending and reading Email
Like the file download tests, there is a substantial amount of data transfer to and from the server occurring during this experiment. This is because employees are likely to save files to, and retrieve them from, network folders on file servers. The goal of these tasks was to model a representative subset of common office user functions. As the table below indicates, once again performance of the virtual client
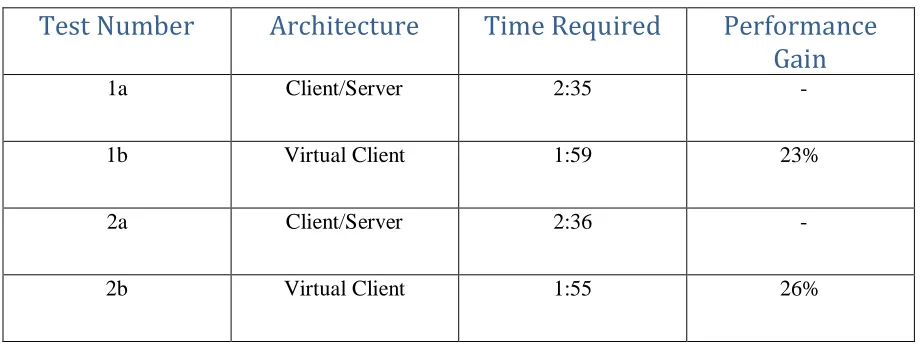
[image:38.612.65.525.240.412.2]architecture was significantly better than the client/server architecture.
Table IV – Office Task Timing Results
Test Number
Architecture
Time Required
Performance
Gain
1a Client/Server 2:35
-1b Virtual Client 1:59 23%
2a Client/Server 2:36
-2b Virtual Client 1:55 26%
Experiment III Analysis
The performance gain between client/server and virtual client averages out to approximately 24.5%. As mentioned, this is a subset of common user tasks, and the file sizes involved are small – nine kilobytes and ten kilobytes. Research from the file download experiment suggests that the percent performance gain would increase as the file sizes grew larger. These results are significant for a large user population because of the widespread use of office suite software. For office workers, and even more significantly for remote employees, the decreased wait time opening and saving files would mean a substantial increase in productive work time when using the virtual client architecture.
Experiment IV – Query Response Time
The final experiment I performed compared the time required to load 5,000 database records on the client/server and virtual client architectures. Each record was small, with only seven columns per record and only one of those columns larger than a date field. The query was limited to one table because the point of the test was to compare how long the data took to load rather than how much processor or
38
would be a common occurrence for a financial department completing month, quarter, or year-end activities. Once again, the goal was to see how the two architectures would perform while completing routine office-related tasks. Evidence from the file download and common office task comparison tests suggested that the differences between the two architectures would be significant. The results are described below:
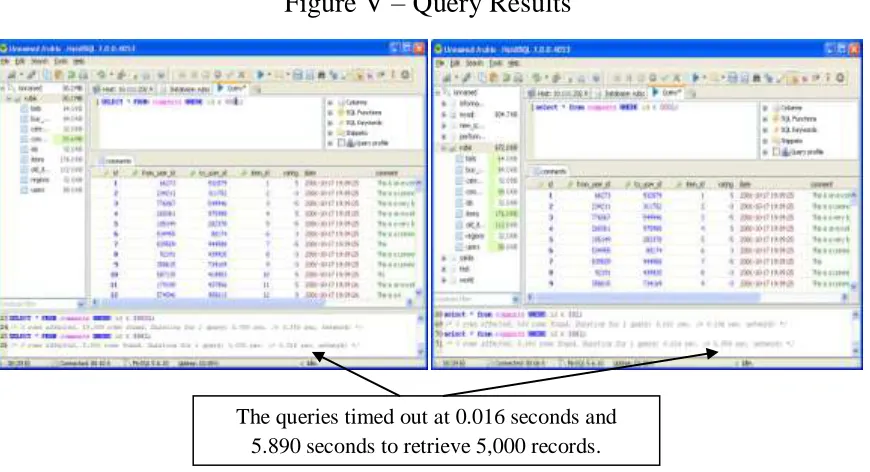
The 5,000 record query took 5.89 seconds to complete on the client/server architecture
[image:39.612.92.527.233.469.2] The same query took 0.016 seconds on the virtual client architecture
Figure V – Query Results
The query time from the client/server to the virtual client architecture is a 99% decrease. For a query that runs for less than six seconds at the slowest, the increase may not seem terribly important. For queries that pull 50,000 records rather than 5,000, the 99% decrease would be another substantial improvement in productive time for employees requiring such a report.
Discussion
Earlier sections of this study discuss both the causes of performance problems with wide area network applications, and various approaches for improving that performance. The experiment section shows that a bandwidth intensive task such as opening a 10MB file took exponentially longer using the client/server approach compared to virtual client. The following section discusses reasons for the performance
difference and the practical implications of this performance difference from a workstation user’s The queries timed out at 0.016 seconds and
39
perspective. It is also a discussion of the causes of WAN performance problems and why the client/server approach is slower than the virtual client architecture. The second part of this section details why this speed difference matters from a practical perspective. The sum of these sections should help demonstrate that virtual clients may enable substantially better office productivity and better overall value that client/server architecture. The table below summarizes the average difference in performance between client/server and virtual client architectures:
Performance Test
Client/Server Time
(seconds)
Virtual Client Time
(seconds)
% Difference
Ping Reply 60 ms > 1 + 59 ms 0 %
File Download Multiple Multiple 95 % (average) Office Tasks 117 (average) 155 (average) 24.5 %
Query Results 5.890 0.016 99 %
Performance bottlenecks for wide area network applications begin with the network itself. There are other causes, especially for database applications - including data locks, disk read times, CPUs exceeding their capacity, but latency and bandwidth restrictions frequently are primary causes. A network administrator can do little about baseline wide area network latency and throughput. The distance between the client and server will not change, and Internet performance is rarely within the control of an organization’s network administrator. The organization can purchase more bandwidth, but that does very little to change latency values. Latency is not the only factor that an organization’s network administrator has little control over. Internet bandwidth upgrades will be dependent upon the total volume of Internet traffic. Using a protocol other than TCP/IP is an option, but that is unlikely for standard application data
transmissions: higher performing protocols such as UDP are usually limited to voice and streaming video usage. The essential problem with WAN application performance is that a substantial portion of data must be transferred across a significant distance with limited throughput.
40
bandwidth will mean the same tasks may take five seconds at one point during the day and ten seconds later on. The inconsistent performance will frustrate users and possibly cause them to stop their work and check with the IT department to see what the problem is.* All three of these causes ultimately affect employee productivity and reduce employee satisfaction.
As a solution to the performance issues described above, I propose using virtual client architecture for two reasons. First, centralizing the data transmission as much as possible is more efficient than the client/server model from both electricity usage and bandwidth availability standpoints. [55] Second, more of the data transfer localized to the organization’s own network should reduce the number of packets sent over the Internet. Fewer data packets mean fewer Syn-Ack requests, which means fewer back-off
calculations and so fewer transfer back-offs. Application performance should be both faster and more consistent as a result. These improvements will have a positive impact on workstation user’s productivity and their perception of existing IT resources.
41
Conclusion
This thesis presents virtual client network architecture as a way to offer higher tier service level
agreements from remote network locations when compared to client/server architecture. As some current Information Technology and workplace trends continue, this research could prove increasingly
significant. The move toward centralized and remote “Cloud” IT resources means there will be fewer local area networks, which increases reliance on the Internet. The trend toward remote sites and remote workers compounds this trend, because without the Internet these employees will be unable to work. Utilizing virtual client architecture reduces reliance on Internet bandwidth and simultaneously reduces the load on required Internet resources, which will help preserve that bandwidth. Two other network
management techniques justify the use