IET Research Journals
Submission Template for IET Research Journal Papers
Centralised Busbar Differential and
Wavelet-based Line Protection System for
MTDC grids, with practical
IEC-61869-compliant Measurements
ISSN 1751-8644 doi: 0000000000 www.ietdl.org
Dimitrios Tzelepis
1∗, Adam Dy´sko
1, Steven M. Blair
1, Anastasios Oulis Rousis
2, Sohrab Mirsaeidi
3Campbell Booth
1, Xinzhou Dong
31Department of Electronic & Electrical Engineering, University of Strathclyde, Glasgow, United Kingdom 2Department of Electronic & Electrical Engineering, Imperial College London, London, United Kingdom 3Department of Electrical Engineering, Tsinghua University, Beijing, China
* E-mail: [email protected]
Abstract:This paper presents a method for discriminative detection of DC faults on VSC-powered multi-terminal HVDC trans-mission systems using two fundamental guiding principles, namely instantaneous current-differential and travelling waves. The proposed algorithm utilises local voltage and current measurements from all transmission lines connected to a DC busbar, and current measurement from the DC side of the converter. The scheme operates at a sampling frequency of 96 kHz which conforms with IEC 61869-9. No long distance communication is involved while measurements and signal exchange within DC substations are enabled by the utilisation of IEC 61850. Performance is assessed firstly through detailed transient simulation, using verified models of modular multi-level converters, hybrid DC circuit breakers and inductive DC-line terminations. Furthermore, practical performance and feasibility of the scheme is evaluated through laboratory testing, using the real time Opal-RT hardware prototyp-ing platform. Simulation and experimental results demonstrate that the proposed protection algorithm can effectively, and within a very short period of time (i.e. less than 1 ms), discriminate between busbar and line faults (internal faults), while remaining stable during external faults. Additionally, it has been demonstrated that IEC 61869-9 is suitable for enabling fast DC protection schemes incorporating travelling waves.
1 Introduction
High Voltage Direct Current (HVDC) networks, utilising Voltage Source Converters (VSCs) are expected to become the preferred technology for connecting renewable generation over long distances [1] and also for upgrading and interconnecting existing AC sys-tems. This is due to the fact that such systems offer improvements in terms of system stability, lower cost and operational losses. A natural extension of the existing point-to-point HVDC transmission technology is a Multi Terminal Direct Current (MTDC) system, which utilises more than two VSC stations, effectively forming a DC grid. Such configuration can provide further technological and eco-nomic advantages. Consequently, it is essential to study, analyse and address potential challenges imposed by MTDC systems to enable widespread adoption. One of the main challenges associated with HVDC systems is to detect and isolate DC-side faults which leads to the development of protection systems.
For the implementation of non-communication-based schemes (i.e. non-unit), there is a noteworthy trend towards the placement of DC reactors at both ends of transmission lines. The intentional place-ment of such inductive components reduces the rate of rise of DC current, while it changes the resulting DC voltage signatures. The fact that voltage is different, depending on the faulted line, can assist towards the implementation of a discriminative protection system. This is achieved by utilising under-voltage and voltage derivative criteria [2–4] or ratio of transient voltages [5].
A few other methods are proposed by utilising current measure-ments [6] or handshaking methods [7] to achieve discriminative and fast detection of DC-side faults.
The analysis of travelling waves has also been found to be use-ful for developing protection schemes. The scheme reported in [8] utilises Wavelet Transform of DC voltage to detect and discriminate between different faults. The voltage and current derivative has also
been used to further enhance the performance of the scheme dur-ing close-up terminal faults. The method proposed in [9] is based on voltage and current measurements and uses a two-stage approach to detect faults in MTDC networks. The first stage is fault incident detection which is performed based on travelling waves detected by Wavelet Transform. The second stage is to locate the fault by a fault locator element which functions based on current harmonic contents. A number of differential-based schemes can also be found in the technical literature. These are mainly based on current mea-surements from both line ends, which are used to perform Discrete Wavelet Transform (DWT) [10] or for the calculation of differential current and comparison with a constant predefined threshold [11]. In [12], a high-speed differential scheme is proposed based on a net-work of distributed current sensors along eith the transmission line. The proposed approach has been found to be fast, sensitive and reli-able for solid and highly resistive internal faults, while maintaining stability during external faults.
1.1 Contribution of the Proposed Scheme
to detect both busbar and line faults within an MTDC grid, as a cen-tralised protection solution [14], complying with IEC 61869-9 [15] and IEC 61850 [16]. The design, practical feasibility of the scheme and case studies, have also been validated using hardware prototyp-ing and comprehensive laboratory testprototyp-ing. Moreover, it should be also highlighted that even though IEC 61869-9 has promoted the sampling frequency of 96 kHz for DC applications, its performance and suitability for DC protection has not been studied and reported in open literature (neither practically nor simulation-based). Con-sequently, another significant contribution of the present work is the utilisation and examination of IEC 61869-9 with regard to DC protection applications.
2 Proposed Protection Scheme
2.1 Algorithm and Scheme Outline
The centralised protection scheme presented in this paper requires voltage and current measurements from all transmission lines and the converter attached to a DC busbar, as depicted in Fig. 1.
c)
Fig. 1: Overview of protection scheme. aMerging unit with GPS.
bDirect wiring.
cProtection algorithm.
There are two major options for the practical implementation of the proposed scheme. The first option (see Fig. 1.(a)) utilises Merging Units (MUs) to digitise local DC voltage and current measurements and transmit them, including a timestamp, to the cen-tralised protection system using the IEC 61850-9-2 Sampled Value (SV) protocol. Time synchronisation is shown as being achieved using Global Positioning System (GPS) receivers, but other methods, such as using IEEE 1588, to synchronise devices over the Ethernet network could be used instead. IEC 61850-8-1 GOOSE messaging would be used to transfer tripping signals to CBs. In the second option (see Fig. 1.(b)), direct wiring of DC measurements to the centralised protection system is adopted. In this case, GOOSE mes-saging and the corresponding communication infrastructure is used only for tripping signals. The first option is particularly appropriate for larger substations, where the distance between the measurement locations and the central controller prohibits the use of analogue sig-nalling. In this paper, the first option has been assumed. It should be noted that measurements are not required to be transferred between substations.
The algorithm consists of three stages as illustrated in Fig. 1(c) which are explained in detail in the following subsections.
2.2 Stage I: Fault Detection
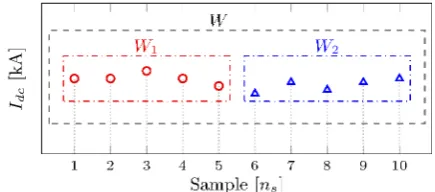
The initial stage of operation is where the fault incident is detected using all the currents from the converter and the lines attached to the same busbar. Using a moving ten-sample windowW, for each currentIdc, a fault detection signalf ds(Idc)is calculated as defined
by equation (1).
f ds(Idc) =
1
ns/2−1
ns/2
X
k=1
(Wk−µWk)·(Wk+ns/2−µWk+ns/2)
(1) wherens= 10is the measuring window length in samples,Wk
are the individual samples contained inW, and the mean valuesµWk andµWk+ns/2 are calculated for the two adjacent five-sample
half-windowsW1andW2included inW(as illustrated in Fig. 2).
Fig. 2: Ten-sample measuring window with two five-sample sub-windows W1 and W2 used the calculation of the fault detection signal.
2.3 Stage II: Busbar Fault Detection
In this stage, the protection algorithm determines whether the fault is on the busbar or on one of the lines. This is achieved by calculation of the differential currentIdif f utilising converter and line current
measurements, as expressed in (2).
Idif f = nL
X
k=1
Idc−Line,k+Idc−Conv (2)
wherenLis the number of lines connected to the busbar (as
illus-trated in Fig. 1),Idc−Line,kis the current in linek; andIdc−Conv
[image:2.595.44.284.284.727.2] [image:2.595.322.540.468.564.2]During line faults the locally-calculated busbar differential cur-rent is expected to be theoretically close to zero while for busbar faults it should obviously reach high values. The presence of a bus-bar fault is perceived by comparing the differential current with a thresholdT HIdif f. If such threshold is exceeded, then a busbar fault is deemed to exist and all CBs connected to the busbar will be tripped and the algorithm will terminate at this point; otherwise, algorithm proceeds to Stage III, considering that the fault is present on one of the connected lines.
2.4 Stage III: Faulted Line Selection
This is the final stage of the protection algorithm where the faulted line(s) are detected by observing travelling waves on the voltage measurements. This is achieved by applying DWT to voltage wave-forms captured on the line side of the current-limiting inductor (for each line separately).
The wavelet transform of a functionv(t)can be expressed as the integral of the product ofv(t)and the daughter waveletΨ∗a,b(t)as per following equation:
Wψv(t) =
Z∞
−∞
v(t) √1
αΨ
t−b
a
| {z }
daughter waveletΨ∗
a,b(t)
dt (3)
The daughter waveletΨ∗a,b(t)is a scaled and shifted version of the mother waveletΨa,b(t). Scaling is implemented byαwhich is
the binary dilation (also known as scaling factor) and shifted byb
which is the binary position (also known as shifting or translation). Two categories of wavelet transform can be distinguished: Con-tinuous Wavelet Transform (CWT) and Discrete Wavelet Transform (DWT). The difference lies upon the resolution of binary dilation
αand binary positionb. In DWT, they move discretely in dyadic blocks. Specifically,αandb, can only take values of the power of two as expressed in set of equations (4).
(
αL= 2L,(α0= 20= 1, α1= 21= 2, ...)
bL= 2LN,(b0= 2L0 = 0, b1= 2L1 = 2L, ...) (4)
whereLis the level of decomposition, andNis the sample index. The selection between CWT and DWT is a trade-off between time accuracy of the wave detection, and processing resources and their associated time delays [17]. In the case of CWT, the daughter wavelet can be positioned smoothly over the signal, hence the accu-racy of the wave time detection is higher than for DWT techniques. This is the reason that CWT is preferred for fault location applica-tions [18], where the computational time is not crucial. However, DWT is computationally more efficient [17], which enables faster wave detection. As a result, DWT is considered more suitable for power system protection applications [19]. Therefore, for the studies carried out in this paper, DWT is the chosen technique.
The key to discrimination of the faulted line lies in the inductive termination of each line. When a fault occurs on one of the busbar-connected lines, the voltage measured at the line side of the inductor will be subjected to a severe depression; and, hence the DWT is expected to reveal sharp edges and possess high magnitude. The voltage change measured on the healthy lines is expected to be more gradual due to the inductances included in the fault current path from one healthy line, through the busbar, to the faulted line. As a result, travelling waves calculated using DWT will be attenuated both in sharpness and magnitude compared to those on the faulted line. Such differences allow for a reliable discrimination of the faulted lines. In particular, faulted line is identified by comparing the calculated DWT magnitude with a predefined thresholdT HDW T. Once such
threshold is exceeded, a tripping signal is sent to the corresponding CB.
It is anticipated that in case of fault, power converters will turn-off the IGBTs for self protection at some stage. However, any control action from the converter should not affect the proposed protection scheme due to the fact that Stage I and II are primarily dependent
on the inrush current introduced by the discharge of system capaci-tance. This is a fast transient which takes place before the converter IGBTs are turned off. Moreover, Stage III is based on travelling waves phenomenon which is mainly determined by the parameters of the line, and therefore, is very much independent of the power source (especially during the first ms of the fault).
2.5 Selecting Thresholds and Wavelet
As described in the previous subsections, the sensitivity and stabil-ity of the proposed scheme is determined by the three thresholds
T HF DS,T HIdif fandT HDW T, which are compared against the fault detection signal, differential current and DWT respectively. This section elaborates on the procedure of selecting appropriate values for these thresholds.
Firstly, regarding the fault detection signal thresholdT HF DS,
the following equation (5) has been used:
T HF DS≤
Cmin·dVcapmin
ts·n2s
(5)
whereCminis the minimum capacitance expected to discharge during the fault, dVcapmin is the expected minimum voltage drop
across the capacitanceCmin,tsis the sampling frequency, andns
is the number of samples used in calculating fault detection signal. Equation (5) has been derived based on the fact that a capaci-tive current (generated by the discharge of the minimum capacitance
Cmin) should be captured within the fault detection signal
mea-suring window (i.e. ns= 10 samples). The average value of such discharging current over the time window sets the maximum value ofT HF DSand ensures that in case of a fault, the resultingf ds(Idc)
will exceedT HF DS.
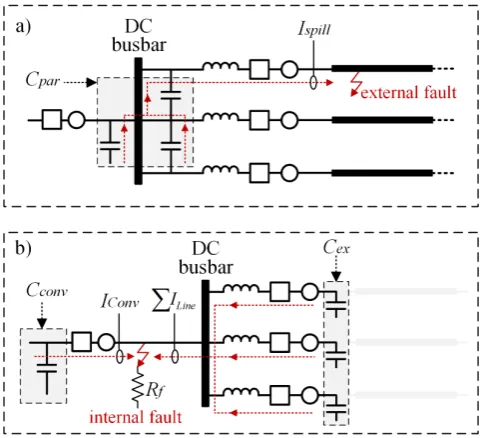
Fig. 3: Illustration of faults currents for threshold selection. aIllustration of spill current during external line fault.
bIllustration of fault currents during internal busbar fault.
For explaining the procedure of selecting the thresholdT HIdif f, the circuits depicted in Fig. 3 are utilised. For the differential pro-tection to operate correctly, two main criteria should be fulfilled. Firstly, for protection security purposes the thresholdT HIdif fneeds to be higher than the spill currentIspillgenerated during external
faults. As illustrated in Fig. 3(a), a spill currentIspillis produced by
[image:3.595.311.555.400.619.2]the substation components and earth. The spill currentIspillcan be
approximated by the following equation (6):
Ispill=Cpar
dVCpar
dt (6)
wheredVCpar/dtis the expected (or estimated) maximum value of the rate-of-change of voltage across the shunt capacitanceCpar.
Secondly, to ensure differential protection dependability, the directed sum of all busbar currents (i.e. the differential current) should be higher than T HIdif f, even for the worst case highly-resistive faults. For the first ms of the fault, a high burst differential current is formed by the discharge of capacitanceCconvandCext
as illustrated in Fig. 3(b). The termCconvrepresents the equivalent capacitance of the converter andCextis the total external capaci-tance of the neighbouring feeders. The algebraic sum of all busbar currents can be estimated as follows:
X
ILine+IConv=Cpar
dVCconv
dt +Cext
dVCext
dt (7)
where dVCconv/dt and dVCext/dt are the expected (or esti-mated) minimum rate-of-change of voltage across the converter and external capacitanceCconvandCextrespectively.
Taking into account the above analysis for internal and exter-nal faults together with the associated equations (6) and (7), the following equation (8) sets the range of acceptable values for
T HIdif f.
ksf ·Ispill< T HIdif f <
X
ILine+IConv
!
(8)
It can seen that spill current is multiplied by a safety factorksf to
reduce the possibility of spurious tripping. The selection of thresh-olds for fault detection signal and differential current depends on the approximation of capacitive currents during the first ms of the fault. This is due to the fact that the proposed scheme is designed as a primary protection system and hence high speed of operation is required. The analysis requires the expected or estimated rate-of-change of voltage on capacitive elements which should take into consideration highly resistive pole-to-ground faults as explained in [20].
Regarding the selection of thresholds related to DWT, the follow-ing impedances need to be estimated: i) impedance seen from the point of measurement to the remote end of the protected line, and ii) impedance seen from the point of measurement to the nearest point outside the protected line. The analysis should include the highest considered fault resistanceRf, as it will affect the resulting
ampli-tude of travelling waves. The estimated impedance can be used to calculate the corresponding transfer function with regards to voltage. The frequency response of each transfer function should provide suf-ficient margin for successful internal/external fault discrimination. As the lines are terminated by lumped inductors (with inductance being much higher than that of the lines) there is a significant atten-uation boundary for high frequency travelling waves resulting from external faults. For further insight on the selection of DWT related thresholds the literature in [19, 21] provides a useful guidance.
To satisfy the requirements of both sensitivity and stability, in the case studies included in section 3, the thresholds have been estab-lished following the above guidelines, with the assumed sensitivity to highly resistive faults up to500 Ω, and taking into account known system capacitances (i.e. lines and converter). The resulting thresh-olds were:T HF DS=43.5 A,T HIdif f=75 A andT HDW T=1000. Those thresholds have also been verified by systematic search rou-tines, using multiple simulations and post-processing, and have been found to be appropriate for the proposed protection scheme. With regards to DWT tuning, the second, third and fourth scales have been tested (the first scale has been omitted since it corresponds to the highest frequency band, and due to undesirable noise-related effects it was considered unsuitable [21]). For the needs of proposed scheme the second scale has been ultimately selected. Based on orthogonal
wavelets the high and low order frequency coefficients have been set toKhf ={0,−0.1768,0.3536,1.0607,0.3536,−0.1768}and Klf ={0,0.3536,−0.7071,0.3536,0,0}respectively.
2.6 Measurement and communications delays within DC
substation
It is important to ensure that the proposed method will operate cor-rectly, despite delays from a realistic implementation. Assuming the use of MUs as illustrated in Fig. 1, the maximum delay, td,
to be expected from the measurement and communications can be calculated as follows:
td=ts+tM U+tn+tcc (9)
wheretsis the maximum delay due to analogue sampling (i.e.
ts= 1/96kHz−1= 10.42µs),tM Uis the processing time in the
MU (i.e. the time to encode the SV frame), tn is the total maxi-mum Ethernet network latency, andtccis the processing time for the central controller (i.e. the time to decode the SV frame). The size of the SV Ethernet frame would be 64 bytes (the minimum frame size) because a maximum of two DC values are digitised within the dataset which would require only 58 bytes, including overhead and quality values [22]. As suggested by IEC 61869-9, a dedicated 1 Gbps Ethernet network is assumed, and thereforetnis composed of: the data transmission time for two Ethernet links (i.e.2×0.7µs), the switch processing delay (assumed to be1µs), and jitter asso-ciated with queuing due to other traffic. These could include IEEE 1588 frames and data from other measurement locations; assuming a maximum of four simultaneous competing frames and a transmis-sion delay of0.58µsper frame [23], the maximum queuing delay is 4×0.58µs.tM UandtCCcan be estimated as12µsand9.5µs,
respectively, based on the measurements in [24] for approximately double the frame size, but this depends on the performance of the platform. Combining all of these factors, the worst case delay can be estimated as:
td= 10.42 + 12 + (1.4 + 1 + 4×0.58) + 9.5 = 36.64µs (10)
Further delays are introduced by the protection system and they arise from the window-based processing required by the fault detec-tion signal calculadetec-tion and DWT. Time delaytdfassociated with the
window-based processing is given by
tdf= (NW −NW O)·tsi (11)
whereNW is the length of the processing window in samples, NW Ois the amount of window overlap between two consecutive calculations frames, andtsithe sampling period of the input signal.
Since a ten-sample time window has been used with a nine-sample overlap, and considering 96 kHz as the sampling frequency, the total time delaytdf is10.42µs. It should be highlighted that since the
DWT and fault detection signal use different processing windows which run in parallel, there is no additional queuing of the volt-age and currents measurements. As such, the value10.42µs is not subjected to any additional delays.
2.7 Discussion on fault detection techniques
further work is needed to develop specific guidelines for the optimi-sation of various elements of HVDC protection schemes, including fault detection stage.
3 Simulation Results
3.1 MTDC Study Network
For the purposes of validating the proposed protection scheme, a five-terminal HVDC grid model illustrated in Fig. 4 has been devel-oped in Matlab/SimulinkR
. The network architecture is an enhanced version of a network from the Twenties Project case study on DC grids. There are five modular multi-level converters (MMCs) in the network operating at±400kV (in symmetric monopole con-figuration), current-limiting inductors and hybrid circuit breakers (HbCBs).
Fig. 4: MTDC case study grid.
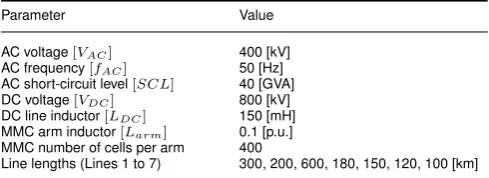
[image:5.595.309.552.103.162.2]The MMC models utilised in this paper are identical to those used in [1, 12, 25, 26] and the AC-DC network parameters are presented in Table 1. The lines have been modelled using a distributed param-eter model. The HbCB is modelled by adopting a hybrid concept by ABB as reported in [27] (2 ms operation time with a maximum breaking current of 9 kA).
Table 1 Parameters for AC and DC network
Parameter Value
AC voltage[VAC] 400 [kV]
AC frequency[fAC] 50 [Hz]
AC short-circuit level[SCL] 40 [GVA]
DC voltage[VDC] 800 [kV]
DC line inductor[LDC] 150 [mH]
MMC arm inductor[Larm] 0.1 [p.u.]
MMC number of cells per arm 400
Line lengths (Lines 1 to 7) 300, 200, 600, 180, 150, 120, 100 [km]
3.2 Fault Scenarios
This section presents simulation results which quantify the overall performance of the proposed protection scheme under different fault scenarios, including pole-to-pole faults (PPFs), pole-to-ground faults (PGFs) (incorporating highly resistive faults) and busbar faults. In all scenarios the faults are permanent and are triggered att= 0.5ms, and the measurements have been contaminated with white noise to
[image:5.595.44.289.242.438.2]account for possible effects due to measurement-related noise on the protection response.
Table 2 Fault scenarios
Scenario Description
I PPF at busbarT2(Rf≈0 Ω)
II PPF at busbarT5(Rf≈0 Ω)
III PGF at Line 3 (590 km fromT2,Rf= 500 Ω)
IV PPF at Line 4 (5 km fromT2,Rf≈0 Ω)
It is assumed that the assessed protection scheme is placed at ter-minalT2. A selection of representative test cases have been included here (summarised in Table 2 and also depicted on Fig. 4) which demonstrate the worst case scenarios in terms of stability and sen-sitivity of the scheme. In recognition of page length limits, for fault scenarios II, III and IV, differential currentIdif f and tripping
sig-nals are not depicted. However, the response of the protection system is fully summarised in Table 3. It should be noted that the counter for the calculation tripping time included in Table 3, is set after the arrival of voltage and current travelling waves (i.e. after the fault is ‘seen’ at DC terminals).
3.3 Fault scenario I
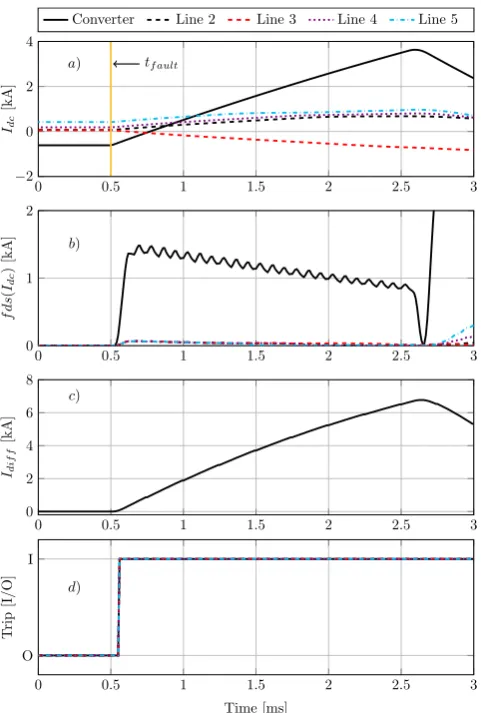
This fault scenario illustrates the protection performance under a busbar fault. Fig. 5(a) shows there is a rapid increase in the current from the converter immediately after the fault.
This is due to the discharge of the capacitance in the converter’s sub-modules (prior to IGBT blocking). There is also a current infeed from the connected lines (Lines 2, 3, 4 and 5) but their rate of rise is limited because of the inductive terminations. As a result, there is a rapid increase inf ds(Idc)(Fig. 5(b)), which satisfies Stage I (fault
detection) of the protection algorithm.
The rapid increase in current infeed from both the converter and the lines, results in the rapid rise of differential current Idif f as
shown in Fig. 5(c). This satisfies Stage II (busbar fault detection) of the protection algorithm and is followed by the tripping of all the HbCBs (Fig. 5(d)), after which the algorithm terminates.
3.4 Fault scenario II
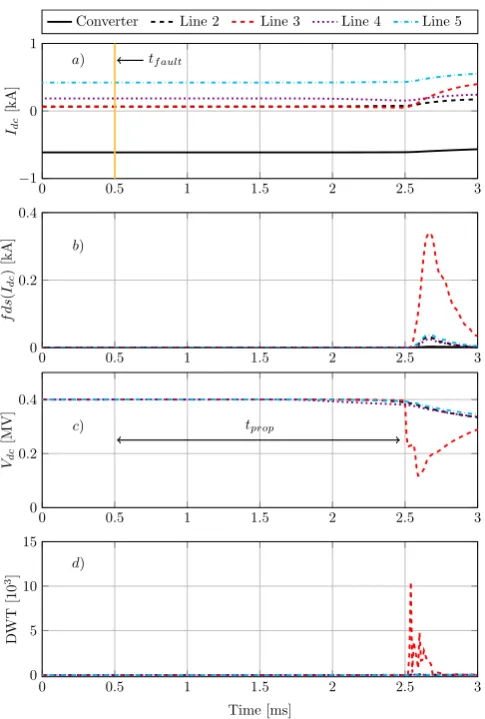
This fault scenario is designed to demonstrate the stability of the protection system during external faults (i.e. faults on remote lines or busbars). A solid external fault at the remote end of the shortest line (i.e. Line 5: 150 km) is applied on terminalT5. The performance of the protection system located at terminalT2is depicted in Fig. 6. Approximately 0.7 ms after the fault occurrence (which corre-sponds to the propagation delay along Line 5) a change in the DC currents can be observed both in the converter output and the lines (Fig. 6(a)). This results in an increase inf ds(Idc)(Fig. 6(b)),
espe-cially for Line 5. This satisfies the Stage I criterion (fault inception) and the algorithm will proceed to Stage II (busbar fault detection). The differential current Idif f would remain at an extremely low
level, and consequently the algorithm will proceed to Stage III (line fault detection). As illustrated in Fig. 6(d), there is no visible tran-sient observed in DWT magnitude. Since the voltage change is measured on the healthy lines, the DWT is extremely attenuated both in sharpness and magnitude. Therefore, there is no tripping signal initiated for any of the CBs at terminal T2 (see Table 3), i.e. the scheme is stable during this worst case external fault.
3.5 Fault scenario III
[image:5.595.42.287.561.650.2]0 0.5 1 1.5 2 2.5 3
−2
0 2 4
tf ault a)
Idc
[k
A]
Converter Line 2 Line 3 Line 4 Line 5
0 0.5 1 1.5 2 2.5 3
0 1 2
b)
f
d
s
(
Idc
)
[k
A]
0 0.5 1 1.5 2 2.5 3
0 2 4 6 8
c)
Idif
f
[k
A]
0 0.5 1 1.5 2 2.5 3
O I
d)
Time [ms]
T
ri
p
[I
/O
]
Fig. 5: Response ofT2protection system for fault scenario I.
aConverter and line DC currents.
bConverter and line DC current fault detection signal.
cDifferential current at busbarT2.
dTripping signals for each CB connected toT2.
Moreover, it can be noted that there is a time delaytprop corre-sponding to the electromagnetic propagation speed and distance to the fault on Line 3. After approximately 2 ms, the value off ds(Idc)
of the currents (especially from Line 3) increase to high values and the criterion of Stage I is satisfied.
The algorithm proceeds to Stage II, where the differential current
Idif f is calculated. Since the values of differential currentIdif f
would remain close to zero, the algorithm proceeds to Stage III con-sidering the presence of a line fault. As can be seen in Fig. 7(c), the voltage of the faulted line (i.e. Line 3) shows a relatively steeper transient phenomena (i.e. travelling waves). Such transients cannot be seen in the healthy lines, since they are attenuated by the inductive terminations. Another reason is that the voltages are captured on the line-side of the current-limiting inductors. The difference becomes more pronounced when the DWT is executed as shown in Fig. 7(d). It is evident that the faulted line can be discriminated using the mag-nitude of DWT, as its value is three orders of magmag-nitude greater than those obtained from the healthy lines. This will results in selective tripping of CBs connected to Line 3 (see Table 3).
3.6 Fault scenario IV
In this scenario, the discrimination of the protection scheme for close up faults is demonstrated. It can be seen that approximately 0.1 ms after the fault there is an increase inf ds(Idc)(Fig. 8(b)) and
signif-icant voltage depression on faulted Line 4 (Fig. 8(c)). The resulting DWT reaches extremely high values (Fig. 8(d)), which ultimately results in selective tripping CBs connected to Line 4.
0 0.5 1 1.5 2 2.5 3
−1
0 1
tf ault a)
Idc
[k
A]
Converter Line 2 Line 3 Line 4 Line 5
0 0.5 1 1.5 2 2.5 3
0 0.1 0.2 0.3
b)
f
d
s
(
Idc
)
[k
A]
0 0.5 1 1.5 2 2.5 3
0 0.2 0.4
c)
Vdc
[M
V]
0 0.5 1 1.5 2 2.5 3
-1 0 1
d)
Time [ms]
D
W
T
[10
3]
Fig. 6: Response ofT2protection system for fault scenario II.
aConverter and line DC currents.
bConverter and line DC current fault detection signal.
cLine DC voltages.
dDWT magnitude of line voltages.
[image:6.595.49.290.52.409.2]The results in selective tripping of the HbCB corresponding to the faulted line can be seen for all fault scenarios in Table 3.
Table 3 Summary ofT2protection responses to fault scenarios I, II, III an IV
Fault scenario Tripped components Tripping timettrip
I MMC2, Line 2, Line 3, Line 4, Line 5 0.1025 ms
II MMC5, Line 5, Line 7 0.1003 ms
III Line 3 0.1219 ms
IV Line 4 0.1131 ms
The tripping timettripincluded in Table 3 is established as:
ttrip=tresp+td−tot (12)
wheretresp is the response of the protection system andtd−tot
the total time delay. As such, based on equation 12 one can deduce the actual response time of the protection algorithm.
3.7 Impact of Sampling Frequency
[image:6.595.313.557.52.409.2] [image:6.595.308.553.534.593.2]0 0.5 1 1.5 2 2.5 3
−1
0 1
tf ault a)
Idc
[k
A]
Converter Line 2 Line 3 Line 4 Line 5
0 0.5 1 1.5 2 2.5 3
0 0.2 0.4
b)
f
d
s
(
Idc
)
[k
A]
0 0.5 1 1.5 2 2.5 3
0 0.2 0.4
tprop c)
Vdc
[M
V]
0 0.5 1 1.5 2 2.5 3
0 5 10 15
d)
Time [ms]
D
W
T
[10
3]
Fig. 7: Response ofT2protection system for fault scenario III.
aLine and converter DC currents.
bLine and converter DC current fault detection signal.
cLine DC voltages.
dDWT of line voltages.
[image:7.595.49.292.51.411.2]III (faulted line discrimination). The correct discriminative opera-tion of the proposed scheme relies on the correct, accurate and fast detection of travelling waves which evidently requires an adequate sampling frequency. Consequently, the recommendation of 96 kHz in IEC-61869 provides enough confidence for the correct and fast detection of transient phenomena in DC systems.
Table 4 Impact of sampling frequency on protection Performance
f [kHz] 1 10 20 50 60 70 80 96 100
Stage I Pass Pass Pass Pass Pass Pass Pass Pass Pass
Stage II Pass Pass Pass Pass Pass Pass Pass Pass Pass Stage III Fail Fail Fail Fail Pass Pass Pass Pass Pass
4 Hardware Validation
4.1 Experimental Arrangement
A real-time hardware prototype has been developed in order to validate the practical implementation of the proposed scheme. For such development, the Opal-RT OP5600 HILBOX has been utilised, integrating digital-analogue I/O and GPS cards.
As illustrated in Fig. 9(a), the entire system is divided into two subsystems, one for the MTDC test network and one for the
0 0.5 1 1.5 2 2.5 3
−2
−1
0 1
tf ault
a)
Idc
[k
A]
Converter Line 2 Line 3 Line 4 Line 5
0 0.5 1 1.5 2 2.5 3
0 1 2 3
b)
f
d
s
(
Idc
)
[k
A]
0 0.5 1 1.5 2 2.5 3
−0.4
0 0.4
c)
Vdc
[M
V]
0 0.5 1 1.5 2 2.5 3
0 20 40
d)
Time [ms]
D
W
T
[10
3]
Fig. 8: Response ofT2protection system for fault scenario IV.
aLine and converter DC currents.
bLine and converter DC current fault detection signal.
cLine DC voltages.
dDWT of line voltages.
protection scheme algorithm. The input signals to the protection scheme are current and voltage signals (both converted to pro-portional voltages) recorded from the MTDC network simulation. Time-synchronised measurements are implemented through a GPS TSync-PCIe card. As all the input signals have been scaled-down to remain within the safe operating range of the I/O cards (i.e.±16 V), the protection thresholds have been scaled-down accordingly. The analogue inputs are sampled at 96 kHz as per IEC 61869-9.
Communication and measurement delays within DC substation communication have been emulated taking into account Equation 9, and hence, physical Ethernet switch has not been used. There is also a user interface panel, from which the user can monitor and control the simulation; specifically the user can trigger or reset the fault scenarios or monitor the tripping status of the protection system and CBs. The MMC models utilised in the experimental validation are the same as those used in the simulation based analysis (i.e. Type 3).
4.2 Experimental Results
For the experimental validation of the proposed scheme, a PPF in the middle of Line 1 is utilised. Due to the limited number of channels of the available oscilloscope, only the results for the protection system placed at terminalT3is reported.
In Fig. 10, the results are presented as captured during real-time simulation of the aforementioned fault, triggered at tf ault= 1.5
[image:7.595.313.559.52.408.2] [image:7.595.43.288.576.628.2]a)
b)
c)
Fig. 9: Experimental arrangement. aDiagram of experimental setup.
bPhoto of experimental setup.
cLCD output.
increasedf ds(Idc)values (Fig. 10(b)) enabling protection Stage I. Since there is no change in the differential current, the algorithm proceeds to Stage III. As shown in Fig. 10(c), the DC voltage of the faulted line (i.e Line 1) reveals steep changes, while there is a much smoother transition for the healthy lines. As a result, the DWT magnitude (Fig. 10(d)) for Line 1 increases significantly. It should be noted here that even in such small scale, the discrimination of the faulted line is very distinct as the DWT magnitude of the healthy lines is practically zero. After approximately 1.1 ms, the algorithm proceeds to the selective tripping of Line 1, which is also depicted in the alphanumeric LCD screen of the user interface panel in Fig. 9(c). It should be noted that the noise seen in the experimental results, originates both from the artificial noise added to the signals at the simulation stage and actual noise arising from the signal conversion and exchange within analogue and digital I/O cards.
5 Conclusions
[image:8.595.309.549.52.273.2]In this paper a new centralised protection scheme for MTDC grids has been proposed which utilises the principles of busbar differen-tial protection and travelling waves and conforms with IEC 61869-9 and IEC 61850. It has been found that the proposed scheme can provide fast and discriminative protection for busbar and line faults (both solid and highly resistive). This has been validated in detailed transient simulation, and further demonstrated using a real-time hardware-based laboratory prototype. This prototype provides a high
Fig. 10: Hardware prototype response to fault at Line 1. aDC currents.
bDC current fault detection signal.
cLine DC voltages.
dDWT of line DC voltages.
level of confidence that the proposed method is practical, consider-ing realistic measurements, communications and computation. The use of line terminating inductors leads to the limitation of the current rise in case of a fault, assists in the discrimination of the faulted line and also prevents the currents from exceeding the breaking capa-bility of the HbCB (9 kA). Additionally, it has been found that the recommended frequency of 96 kHz reported in IEC 61869-9 is suit-able for the detection of fast transient phenomena in HVDC grids, and hence can be utilised for the implementation of fast and reliable DC busbar and line protection incorporating travelling waves. Fur-ther sensitivity analysis revealed that a minimum sampling rate of 60 kHz would be adequate for this application.
6 Acknowledgements
This work was funded in part by Royal Society of Edinburgh (J M Lessells Travel Scholarship), in part by the National Natural Science Foundation of China (Grant No. 51120175001), and in part by the National Key Research and Development Plan of China (Grant No. 2016YFB0900600).
7 References
1 D. Tzelepis, A. O. Rousis, A. Dysko, C. Booth, and G. Strbac, “A new fault-ride-through strategy for MTDC networks incorporating wind farms and modular multi-level converters,”International Journal of Electrical Power & Energy Systems, vol. 92, pp. 104–113, November 2017.
2 W. Leterme, J. Beerten, and D. Van Hertem, “Non-unit protection of HVDC grids with inductive DC cable termination,”IEEE Transactions on Power Delivery, vol. 31, no. 2, pp. 820–828, April 2016.
3 J. Sneath and A. Rajapakse, “Fault detection and interruption in an earthed HVDC grid using ROCOV and hybrid DC breakers,”IEEE Transactions on Power Delivery, vol. 31, no. 3, pp. 973–981, June 2016.
4 R. Li, L. Xu, and L. Yao, “DC fault detection and location in meshed multiterminal HVDC systems based on DC reactor voltage change rate,”IEEE Transactions on Power Delivery, vol. 32, no. 3, pp. 1516–1526, June 2017.
5 J. Liu, N. Tai, and C. Fan, “Transient-voltage-based protection scheme for DC line faults in the multiterminal VSC-HVDC system,”IEEE Transactions on Power Delivery, vol. 32, no. 3, pp. 1483–1494, June 2017.
6 S. P. Azad and D. V. Hertem, “A fast local bus current-based primary relaying algorithm for HVDC grids,”IEEE Transactions on Power Delivery, vol. 32, no. 1, pp. 193–202, Feb 2017.
[image:8.595.42.290.56.426.2]8 K. De Kerf, K. Srivastava, M. Reza, D. Bekaert, S. Cole, D. Van Hertem, and R. Belmans, “Wavelet-based protection strategy for DC faults in multi-terminal VSC HVDC systems,”IET Generation, Transmission, Distribution, vol. 5, no. 4, pp. 496–503, April 2011.
9 J. Cheng, M. Guan, L. Tang, and H. Huang, “A fault location criterion for MTDC transmission lines using transient current characteristics,”International Journal of Electrical Power & Energy Systems, 2014.
10 A. E. Abu-Elanien, A. A. Elserougi, A. S. Abdel-Khalik, A. M. Massoud, and S. Ahmed, “A differential protection technique for multi-terminal HVDC,”Electric Power Systems Research, vol. 130, pp. 78 – 88, 2016.
11 M. Hajian, L. Zhang, and D. Jovcic, “DC transmission grid with low-speed protec-tion using mechanicalDC circuit breakers,”IEEE Transactions on Power Delivery, vol. 30, no. 3, pp. 1383–1391, June 2015.
12 D. Tzelepis, A. Dysko, G. Fusiek, J. Nelson, P. Niewczas, D. Vozikis, P. Orr, N. Gordon, and C. D. Booth, “Single-ended differential protection in mtdc net-works using optical sensors,”IEEE Transactions on Power Delivery, vol. 32, no. 3, pp. 1605–1615, June 2017.
13 P. P. Parikh, T. S. Sidhu, and A. Shami, “A comprehensive investigation of wire-less LAN for IEC 61850 based smart distribution substation applications,”IEEE Transactions on Industrial Informatics, vol. 9, no. 3, pp. 1466–1476, Aug 2013. 14 S. Brahma, “Advancements in centralized protection and control within a
substa-tion,”IEEE Transactions on Power Delivery, vol. 31, no. 4, pp. 1945–1952, Aug 2016.
15 “IEC 61869-9: ED 1.0 instrument transformers - part 9: Digital interface for instrument transformers,”BSI, 2013.
16 “IEEE recommended practice for implementing an IEC 61850-based substation communications, protection, monitoring, and control system,”IEEE Std 2030.100-2017, pp. 1–67, June 2017.
17 F. Liang and B. Jeyasurya, “Transmission line distance protection using wavelet transform algorithm,”IEEE Transactions on Power Delivery, vol. 19, no. 2, pp. 545–553, April 2004.
18 O. Nanayakkara, A. Rajapakse, and R. Wachal, “Location of DC line faults in conventional HVDC systems with segments of cables and overhead lines using terminal measurements,”IEEE Transactions on Power Delivery, vol. 27, no. 1, pp. 279–288, Jan 2012.
19 X. Dong, J. Wang, S. Shi, B. Wang, B. Dominik, and M. Redefern, “Traveling wave based single-phase-to-ground protection method for power distribution system,”
CSEE Journal of Power and Energy Systems, vol. 1, no. 2, pp. 75–82, June 2015. 20 M. K. Bucher and C. M. Franck, “Analytic approximation of fault current
contribu-tions from capacitive components in HVDC cable networks,”IEEE Transactions on Power Delivery, vol. 30, no. 1, pp. 74–81, Feb 2015.
21 X. Dong, W. Kong, and T. Cui, “Fault classification and faulted-phase selection based on the initial current traveling wave,”IEEE Transactions on Power Delivery, vol. 24, no. 2, pp. 552–559, April 2009.
22 S. M. Blair, A. J. Roscoe, and J. Irvine, “Real-time compression of IEC 61869-9 sampled value data,” inIEEE International Workshop on Applied Measurements for Power Systems, Sept 2016, pp. 1–6.
23 P. A. Crossley, H. Guo, and Z. Ma, “Time synchronization for transmission sub-stations using GPS and IEEE 1588,”CSEE Journal of Power and Energy Systems, vol. 2, no. 3, pp. 91–99, Sept 2016.
24 S. M. Blair, F. Coffele, C. D. Booth, and G. M. Burt, “An open platform for rapid-prototyping protection and control schemes with IEC 61850,”IEEE Trans. on Power Delivery, vol. 28, no. 2, pp. 1103–1110, April 2013.
25 D. Tzelepis, G. Fusiek, A. Dysko, P. Niewczas, C. Booth, and X. Dong, “Novel fault location in MTDC grids with non-homogeneous transmission lines utiliz-ing distributed current sensutiliz-ing technology,”IEEE Transactions on Smart Grid, 2017,‘Early Access Articles’.
26 D. Tzelepis, A. Dysko, G. Fusiek, P. Niewczas, S. Mirsaeidi, C. Booth, and X. Dong, “Advanced fault location in MTDC networks utilising optically-multiplexed current measurements and machine learning approach,”International Journal of Electrical Power & Energy Systems, vol. 97, no. Supplement C, pp. 319 – 333, 2018.