City, University of London Institutional Repository
Citation
: Mathmann, F., Chylinski, M., Higgins, T. and de Ruyter, K. (2017). Every Step
Counts: When Physical Movement Affects Perceived Value. Journal of Retailing and Consumer Services, 39, pp. 279-285. doi: 10.1016/j.jretconser.2017.08.007This is the accepted version of the paper.
This version of the publication may differ from the final published
version.
Permanent repository link:
http://openaccess.city.ac.uk/17934/Link to published version
: http://dx.doi.org/10.1016/j.jretconser.2017.08.007
Copyright and reuse:
City Research Online aims to make research
outputs of City, University of London available to a wider audience.
Copyright and Moral Rights remain with the author(s) and/or copyright
holders. URLs from City Research Online may be freely distributed and
linked to.
1
Every Step Counts: When Physical Movement Affects Perceived Value
Frank Mathmann
Mathew Chylinski
Tory E. Higgins
Ko de Ruyter
Abstract
Physical movement is an important contextual factor during customer’s
decision-making. Yet, little is known about how movement can affect customer’s
response to mobile promotions, or how it can influence the search and evaluation of
products in a retail setting. Across three studies, this research shows that physical
movement improves the perceived value of products and promotions for customers
with a predominant locomotion motivation. Such effects are mediated by engagement.
One implication is that retailers may increase engagement for individuals with a
predominant locomotion motivation by playing mobile adverts when cellular sensors
indicate movement.
Keywords: Movement, Mobile Marketing, Regulatory fit, Value-from-fit, Locomotion,
2
1. Introduction
In a retail setting customers move around the physical store to find, and to try
products. Physical movement is the context by which customers interact with the
marketing mix. A customer may walk around a chocolate shop to find the best
product; or she may physically test a pair of sneakers to see if they are worth the price.
Digitization offers retailers the ability to trace the movements of their customers on an
industrial scale using accelerometers, WiFi signals, and GPS built into mobile devices.
Movement can be monitored within the retail space, or outside it. For instance, as the
customer approaches a specific store, location-based audio promotions on Spotify can
prompt the customer to step in and have a closer look. Yet, the core of the marketing
and customer research literature largely neglects physical movement. Despite
emerging interest in customers’ movement in the store and its influence on the
decision making process as well as spending behavior (Clifford & Hardy, 2013), little
is known about how value perceptions are affected by customers’ physical movement.
For instance, which customers value marketing communications on the go? When
does movement engage customers with a brand? For which customers is physical
movement related to spending? Such questions remain to be answered.
This article extends previous research by addressing two critical issues in the
literature. Firstly, physical movement has not been studied explicitly in the marketing
literature despite recent calls for this kind of research (Hui et al., 2013; Shankar &
Balasubramanian, 2009; Varnali & Toker, 2010). The present article contributes to
the marketing literature by investigating how the interaction between physical
movement and individual differences can influence customer’s perception of value in
aspects of the marketing mix. In particular, the article demonstrates how perception of
3
by this interaction of physical movements and customers’ individual differences. This
is interesting for retailers such as Nordstrom and Nike who trace consumers’
movement using sensors that connect to customers’ mobile devices (Clifford & Hardy,
2013). We show how they can identify customers for whom movement increases
value perceptions. Perceived value is of high relevance to marketers as it has been
found to positively affect customer loyalty (Yang & Peterson, 2004), purchase
intentions (Wu et al., 2015) and trust (Chen & Chang, 2012).
Secondly, and more generally, the article contributes to recent theorizing in
the marketing literature about the influence of regulatory fit (Aaker & Lee, 2006;
Avnet & Higgins, 2003, 2006; Daryanto et al., 2010; Florack & Scarabis, 2006;
Mathmann et al., 2017; Motyka et al., 2013; Pham & Chang, 2010). Regulatory fit
theory proposes that when customers choose products by using decision strategies that
align with their general motivations, they value products more compared with
customers who do not experience this type of fit (Aaker & Lee, 2006; Avnet &
Higgins, 2003, 2006; Higgins, 2000, 2006; Motyka et al., 2013; Pham & Chang,
2010). It has not been tested, however, whether physical behaviors such as customer
movement per se (rather than decision making strategies) have a similar effect on
regulatory fit and thereby on perceived value.
2. Theoretical background
The limited marketing literature, which considers physical movement (i.e.:
displacement of a customer’s physical body through space), does so only indirectly by
accounting for in-store travel distance. In this stream of research, movement is
typically considered a transaction cost (Hui et al., 2013; Danaher et al., 2015). The
4
minimize these costs (Hui et al., 2013, Danaher et al., 2015). Accordingly, the way for
managers to increase value in a physical retail space is to limit unnecessary movement
(Danaher et al., 2015). Researchers speculated for example that increased walking in
retail environments leads to customer irritation (Hui et al., 2013) and lower mobile
coupon redemptions (Danaher et al., 2015).
In contrast, regulatory mode1 theory in psychology offers a fresh perspective. It suggests movement may actually be engaging for some customers, but not for others
(Kruglanski et al., 2000). For example, to purchase a chocolate bar, a customer must
evaluate its attributes and make a choice from the available set of alternatives. From
the perspective of regulatory mode, some individuals are predominantly motivated to
evaluate (so called assessors). According to regulatory mode theory (Higgins, 2012;
Higgins et al., 2003; Kruglanski et al., 2000), assessors are concerned with making
the right decision, for instance choosing the right chocolate (Kruglanski et al., 2000).
This means that they should prioritize dedicating cognitive resources to evaluation
rather than movement. Others just want to get on with it and make it happen (eat the
chocolate). Those are the locomotors (Kruglanski et al., 2000). Locomotors are
concerned with managing change and progressing towards the goal. This involves
movement from state to state (Kruglanski et al., 2000). When locomotion orientations
are stronger than assessment orientations, we can thus speak of predominant
locomotors. Physical movement fits the motivational concerns of predominant
locomotors because they are concerned with effecting change by moving from state to
state rather than pausing for evaluation. Even when movement is predominantly a cost,
as commonly argued by the marketing literature, locomotors may be less affected by
its detrimental effects because the movement is a fit for them.
5
examined movement in the psychological sense rather than actual physical movement.
Actual physical movement should also result in fit for high locomotors. When the
environment matches an individual’s regulatory motivation it produces a “fit”.
Individuals experiencing fit react more favorably, or less adversely, in a given
environment. Studies have shown that locomotors assign greater perceived value to
objects as a result of regulatory fit. Perceived value involves an attraction toward the
outcome of the goal pursuit (Higgins 2006; Higgins & Scholer, 2009), and studies
have measured it through willingness to pay, as well as established scales of
perceived value (Mathmann et al., 2017). For instance, locomotors were willing to
pay more for a reading light chosen using a sequential decision rule (e.g.: elimination
by aspects) because it offered them a sense of progress towards a goal (Avnet &
Higgins, 2003).
The conjecture in this article is that regulatory fit occurs not only as a result of
psychological processes and decision-making strategies but also due to actual
physical movement. What is interesting about physical movement, and different from
decision strategies, is that physical movement requires cognitive resources that
otherwise would be available for critical evaluation Lindenberger et al., 2000). For
instance, in a chocolate store, consumers must watch where they step, avoid obstacles,
and navigate in addition to evaluating attributes of the chocolates. Such multitasking
likely interferes with critical evaluation over and above a mere psychological process
or a decision strategy. This means that high locomotors’ regulatory fit with movement
could not only intensify positive reactions to the decision activity from the movement
but also attenuate what are often experienced as detrimental effects of the movement.
Notably, in both cases the high locomotors would have a more favorable reaction to
6
When it comes to the marketing mix, customers are often exposed to advertising
and product choices on the go. Walking to the shop they may hear an advertisement,
and when they get there, they must traverse the store to find the product. Ikea is
potentially the best (or worst - depending on your regulatory inclination) example of a
retail environment where physical movement affects a sense of progress. The
one-way traffic through an Ikea store favors locomotors for whom the retail environment
provides regulatory fit; which in turn intensifies value of products and
communications encountered in such an environment. It is expected that high
locomotors will react more favorably to the physical movement required in this
situation than low locomotors. Hence, the first hypothesis is that:
H1: Individuals with a high predominant locomotion motivation value products
and promotions encountered during physical movement more positively —including
less negatively —than those with a low predominant locomotion orientation.
That is, whether customers perceive value in an advertisement they hear or a
product they see depends in part on the interaction effect (the regulatory fit) between
the physical movement and their motivation for locomotion. Previous research
explained the effect of fit on value by suggesting that when consumers pursue a goal
in a way that fits their established motivations they are more engaged in the goal
pursuit activity (Higgins & Scholer, 2009; Mathmann et al., 2017). Engagement is
conceptualized as a state of sustained attention (Higgins, 2006; Higgins & Scholer,
2009) and has been distinguished from similar constructs such as involvement
(Hollebeek & Chen, 2014). Sustained attention is instrumental to attraction toward an
outcome of goal pursuit (i.e.: perceived value) because where attention goes action
follows (Higgins, 2006; Higgins & Scholer, 2009). Sustained attention amplifies the
7
of engagement in a retail context should intensify consumers’ value responses
(Higgins, 2006). As such, engagement is part of the process that transitions regulatory
fit effects to judgments of perceived value. Hence, the second hypothesis is that:
H2: Engagement mediates the interaction effect of physical movement and
predominant locomotion (i.e. regulatory fit) on perceptions of value.
Figure 1 illustrates the relationships expected under H1 and H2 where
engagement mediates the interaction effect of physical movement and predominant
locomotion on perceived value. The following studies investigate the hypothesized
effects in the context of: (i) products, with actual monetary offers (Study 1) and
willingness to pay (Study 2) as the measures of perceived value; and (ii) marketing
communications, focusing on perceived value in mobile advertisements (Study 3).
_____________________
Insert figure 1 about here
_____________________
3. Study 1: Movement Integral to Search Process
Study 1 was designed to test hypothesis 1 in the context of movement that is
integral to product search. Regulatory fit literature distinguishes between actions
integral and incidental to intent (Motyka et al., 2013). When the intent is to purchase a
product, physical movement becomes integral to that goal. A customer will
deliberately search for, and approach products that promise value. Such movement
can be traced in-store through customers’ cellphone signals (Hui et al., 2013; Danaher
et al., 2015), or manipulated through mobile coupons (Danaher et al., 2015). In line
with H1, it was hypothesized that when searching for a product, physical movement
will lead to greater monetary offers for selected products by customers high (vs low)
8
3.1 Method
Participants (N=130) from the subject pool of an Australian University (57
males, Mage=22.5, SD=5.3) took part in a between subject experiment that
manipulated movement (low vs high). Participants were allowed to participate under
the condition that they were not currently dieting and were willing to purchase
chocolates for part of their $12 participation payment. One participant was excluded
as he did not follow instructions. Participants were randomly assigned to either the
high movement (N=56) or the low movement condition (N=74). Respondents chose
chocolates either while walking around a table or while sitting at a table. Appendix 1
illustrates this environment.
The perceived value was measured as actual payment using an established
method (Avnet & Higgins, 2003) in which participants made an offer for the
chocolates (M=3.07, SD=1.64) using their participation money. They placed a bid for
a chocolate bar they selected having been told the researcher pre-commited to a
hidden reserve price on that product. Participants who bid a price greater or equal to
the reserve bought the chocolates at their bid price. In the same survey, participants
also answered questions about locomotion (e.g. “I feel excited just before I am about
to reach a goal”; α = .75) and assessment (e.g. “I am a critical person” α = .76)
motivations measured using the established 12 items for each construct on 6-point
scales from “Strongly Disagree” to “Strongly Agree” (Kruglanski et al., 2000)
(correlation between the motivations was: r = .30, p <.01).
3.2 Results
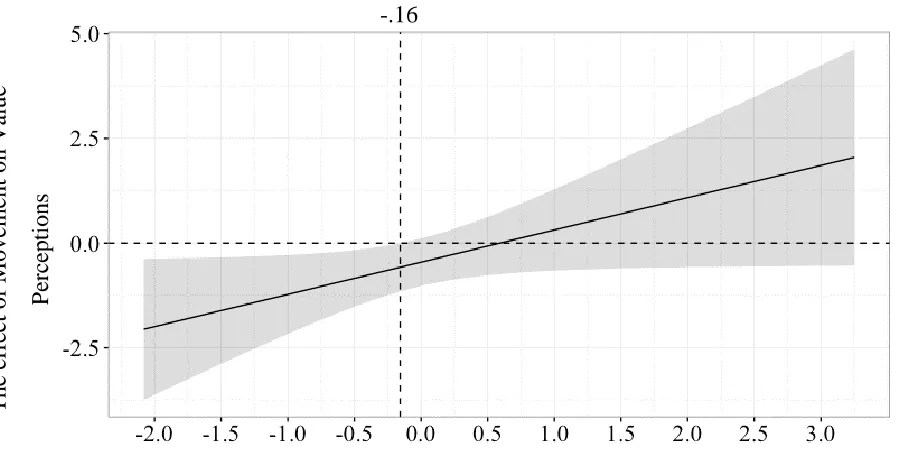
Perceived value. To test H1, we used Movement as the IV, Predominant
9
according to Kruglanski et al., 2000) as the Moderator, Product Valuations as the DV,
and the test was conducted with the PROCESS macro for SPSS (Hayes, 2012, Model
1). Results are displayed in Table 1. The hypothesized 2-way interaction between PL
motivation and Movement was positive and significant, β = .77; p< .05; Δ R² = .03)
(see Figure 2).
_____________________
Insert table 1 about here
_____________________
_____________________
Insert figure 2 about here
_____________________
The conditional effect of movement on product valuations transitioned in
significance at the centered low locomotion predominance value of -.16, β = -.58, SE
= .29, t = -1.98, p = .05, 95% CIs [-1.15, .00] and remained significant for all values
below this point. These findings support H1.
4. Study 2: Movement Integral to Evaluation Process
Study 2 was designed to test hypothesis 1 in the context of movement as part
of product evaluation. Brick-and-mortar retailers might encourage physical movement
to allow customers to test their products “in motion”. Nike stores are a good example
of this: Customers that track their movements using the Nike+ app can try football
gear in store to see how it feels in action (Nike, 2016). In-store motion sensing
through mobile phones (e.g. using WiFi data) and wearable technology can then
provide visibility into whether these initiatives influence customer movement (Hui et
10
Study 2 contributes to the understanding of physical movement and its effect on the
perceived value of products by focusing on movements integral to product evaluation
(H1).
4.1 Method and Measures
Participants (N=36) from the subject pool of a university in the northeastern
United States (9 males,Mage=23.5, SD=9.9) took part in a between-subject
experiment that manipulated physical movement (low vs. high). Participants were
asked to evaluate a stepping stool. In the high movement condition (N=18),
participants were asked to walk up and down the stepping stool as shown in an
instruction video. In the low movement condition (N=18), participants sat still at a
desktop computer and watched a video that showed the stepping stool from different
angles. Twoparticipants were excluded due to experimenter error, causing
participants not to perform the experimental task as planned or at all. All participants
received $7 for taking part in the study.
The perceived value assigned to the stepping stool was measured by asking
participants “How much do you think the stepping stool is worth?” (Pham et al.,
2011) with the values “<$20”,” $20-$39”,” $40-$59”,” $60-$79”,” $80-$99”,”
$100-$119” and “$120 and higher” Coding: 1-7, M=1.89, SD=.78). No participant
indicated “$120 and higher”. Participants’ locomotion (α = .88) and assessment (α
= .88) motivations were measured exactly as in Study 1 (Kruglanski et al., 2000, r
= .22, n.s.).
11
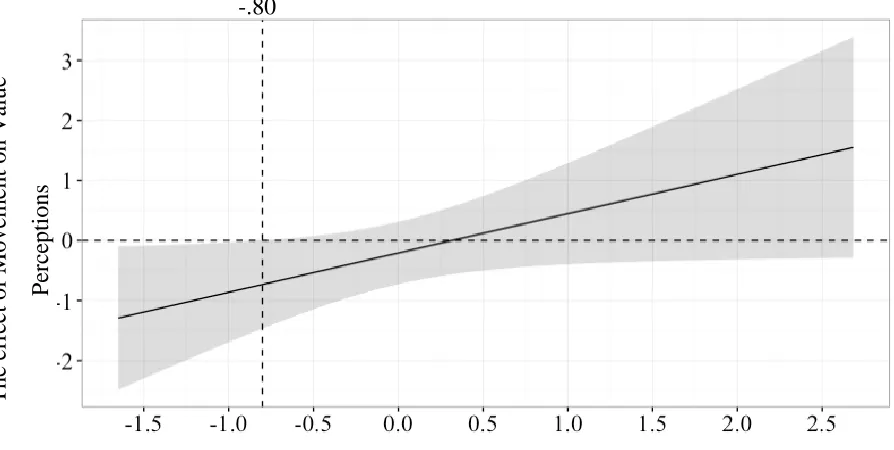
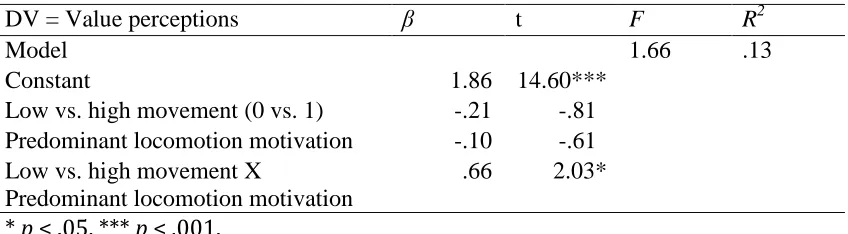
Perceived value. To test H1, we used Movement as the IV, PL as the
Moderator, Product Valuations as the DV, and the test was conducted with the
PROCESS macro for SPSS (Hayes, 2012, Model 1). Table 2 summarizes the results.
The predicted 2-way interaction between PL and low vs. high Movement (β =. 66;
p< .05; Δ R² = .11) was positive and significant (see Figure 3).
_____________________
Insert table 2 about here
_____________________
_____________________
Insert figure 3 about here
_____________________
The conditional effect of low versus high movement transitioned in
significance at the centered low predominant locomotion value of -.80, β = -.73, SE
= .36, t = -2.04, p = .05, 95% CIs [-1.08, .00] and remained significant for all values
below this point. These findings provide further support for H1.
5. Study 3: Incidental Movement and the Role of Engagement
Study 3 tested hypothesis 1 and 2 in a field setting and was designed to
contribute to the literature on retail motion sensing and mobile advertisements (Hui et
al., 2013). For retailers and digital service providers, it is important to understand
whether perceived value (H1) and engagement (H2) of advertisements can benefit
from consumer motion sensing. For example, Spotify tracks consumers’ physical
movement in order to increase engagement in activities and then confronts consumers
with audio advertisements (The Spotify Team, 2015). In this context the movement is
12
occur as a result of pursuing a product or promotion, but merely concurrently to the
advertising exposure. Little is currently known about how incidental movement
affects judgements of value, and in particular the perception of value in advertising
messages.
5.1 Methods and Measures
Participants (N=114) from the subject pool of a Dutch university (43 males,
Mage=21.9, SD=2.7) were informed that they would listen, for 15 minutes, to
advertisements using an iPhone provided to them by the researcher, as they went
about their business during a break. Participants listened to 15, 30-second
advertisements for products from five different brands (McDonald’s, Sprite, Durex,
Listerine & Burger King) while a pedometer smartphone application covertly
measured their steps per second (M=1.30, SD= .76). Three participants were excluded
due to technical errors, and all participants received € 8 for taking part in the study.
At the end of the task, participants completed a survey in which they answered
questions about engagement: “I concentrated on the McDonalds ads; I put a lot of
thought into evaluating the McDonalds ads”, and perceived value of advertisements:
“I think the McDonalds ads were valuable; I liked the McDonalds ads” (repeated for
each brand: Sprite/Durex/Listerine/Burger King, and measured on a scale of 1
Strongly Disagree - 5 Strongly Agree). After this, locomotion (α = .83) and
assessment (α = .83) were measured using the same scales as in studies 1 and 2
(Kruglanski et al., 2000; correlation between the motivations was: r = .19, p =.038).
Finally, demographic questions and payment followed before participants were
debriefed.
13
Engagement and Perceived Value. To test H1 and H2, we used Movement (in
terms of steps per second) as the IV, PL as the Moderator, Engagement as the
Mediator, Valuations as the DV, and the test was conducted with the PROCESS
macro for SPSS (Hayes, 2012, Model 8) For engagement, the findings show no
significant effect of Movement (β = .04; n.s.) or PL (β = .01; n.s.). More importantly,
the predicted 2-way interaction between PL and Movement (β =. 20; p< .05; Δ R²
= .04) was positive and significant.
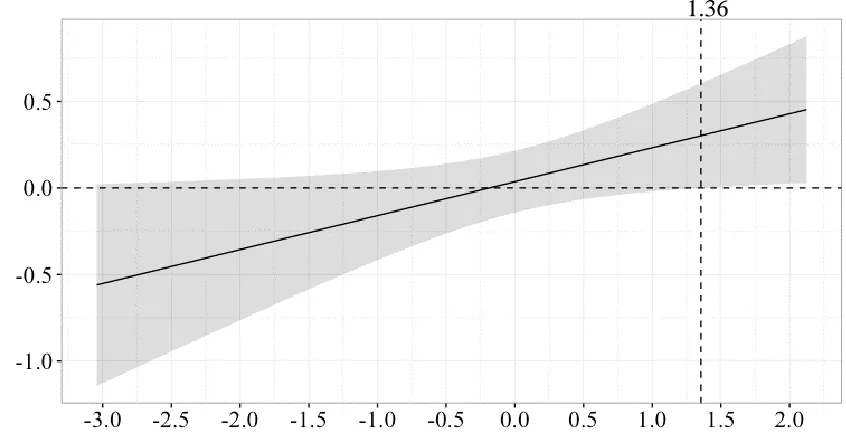
To further illustrate the nature of these interaction effects, the
Johnson-Neymann (J-N) technique was used (Hayes, 2012). The effect of Movement on
engagement transitioned in significance for the region above the centered high
predominant locomotion value of 1.36, β = .30, SE = .15, t = 1.98, p = .95, 95% CIs
[.00, .60]. This reflects the fact that, as predicted for predominant locomotors,
Movement had a positive effect on engagement in advertisements. (See Figure 4). For
value perceptions, the findings showed no significant direct effects (H1).
_____________________
Insert figure 4 about here
_____________________
Tests of Mediated Moderation. A moderated mediation analysis was
performed to test H2. To perform this analysis, Model 8 from the PROCESS macro
for SPSS (Hayes, 2012) was used (see Table 3). The interaction between Movement
(average number of steps per second) and PL motivation was positively associated
with engagement (β = .20, p <. 05) while the effects of engagement (β = .24, p < .01)
on perceived value was positive and significant. These findings illustrate that
heightened engagement has a positive effect on product valuations.
14
Insert Table 3 about here
_____________________
95% bootstrapped CIs for the indirect effects of higher order interaction (i.e.,
a3 X b1, model 8, Hayes, 2012) did not include 0 for engagement (95% BC
CI= .0021, .1306). The indirect effect of physical movement on perceived value
through engagement was significant and positive for individuals with a predominant
locomotion motivation of .86 (β = .05, SE = .03, 95% BC CI= .0002, .1446) or higher,
but not for individuals with weaker predominant locomotion motivation (locomotion
motivation <.86, n.s.). This indicates that the moderation is fully mediated (Zhao et al.,
2010). These findings confirm H2.
6. General Discussion
Physical movement as a context factor to customer’s experience of products
and marketing messages has received little attention in the academic literature.
Fast-paced advances in technology have meant the amount of real-time information on
customer movement in retail environments has grown rapidly. Yet academic research
has done little to show how this information can be relevant for marketing. Calls for
research about the influence of customer movement on the perception of value in
aspects of the marketing mix have not been answered (Hui et al., 2013; Varnali &
Toker, 2010). Literature thatindirectly accounted for physical movement, for example
by measuring in-store travel distance through mobile sensors, exclusively considered
movement as a transaction cost (Hui et al., 2013; Danaher et al., 2015). It neglected
how physical movement could increase engagement and value for some individuals
(and have the opposite effect for others) by being a fit with their predominant
locomotion orientation. This article addresses those issues by demonstrating: How
15
be used to engage particular customers with a brand and for which customers’
physical movement is related to spending behavior.
Three studies considered the effect of physical movement on perceived value
in aspects of the marketing mix. In Studies 1 and 2 movement was integral to decision
making: product search (Study 1) and product evaluation (Study 2). In Study 3
movements were incidental as customers listened to marketing communication about
different brands (Study 3). Repeatedly, it was demonstrated that regulatory fit
between physical movements and consumers’ predominant locomotion motivation
influenced these marketing mix variables.
When participants walked around a counter to select chocolates in Study 1,
high predominant locomotors paid a higher price for the chocolates they chose than
low predominant locomotors. Locomotors are those customers who have a strong
motivation for movement from one state to the next. In Study 2, customers who
performed movements to evaluate a product’s main function, stepping on a stepping
ladder, indicated they were willing to pay more for the product, when they had a
higher locomotion orientation. Crucially, this effect was due to regulatory fit, where
only locomotors responded in that way. Finally, Study 3 showed how walking while
listening to advertisements increased engagement, and in turn value of those messages
for locomotors.
From a theoretical perspective, regulatory fit due to physical movement and
predominant locomotion has not been demonstrated before. However, the findings in
this article mirror those on regulatory fit from decision-making strategies (Aaker &
Lee, 2006; Avnet & Higgins, 2003, 2006; Motyka et al., 2013; Pham & Chang, 2010).
16
customer decision-making strategies and general motivations (Higgins, 2000, 2006).
The current article shows how embodied movement can result in regulatory fit as well.
Not only does this provide a theoretical underpinning for future analysis of motion
tracking and analysis of the data generated by monitoring customer movements, it
also offers a novel segmentation approach and a source of value for physical retailers.
6.1 Managerial implications
By challenging existing assumptions about how movement affects customer
engagement and value perceptions, the present article offers new perspectives for
physical retailers. Enabled through digitization, motion sensing in physical retail
environments is one source of advantage compared to pure online retailing. What has
been missing to date is how motion and location-specific information may be used to
increase value. The key to unlocking this potential is regulatory mode, and
specifically customers’ motivation for locomotion.
Retailers do not have to guess customer movement during search and
evaluation. Location, direction and speed can be traced using mobile sensors such as
gyroscopes, GPS and WiFi (Miller, 2012) and customers can be targeted as they
approach products in a retail store (Khaljehzadeh & Oppewal, 2015). At the same
time, locomotion can also be primed, for instance by using in-store advertisements
(e.g. Nike’s just do it; Avnet & Higgins, 2003; Mathmann et al., 2017). This means
individual motivations can be nudged by targeted communications to produce fit in a
physical retail environment. A good example for such a fit is a Nike+ event, where
customers are exposed to Nike promotions while showing off their speed, activity rate,
17
Customers’ physical movement is not only relevant to decision making in
physical retail environments, but also affects customer’s response to mobile
marketing. Our results suggest that mobile advertisements are most engaging for the
locomotor segment, and in general are received more favorably by them. Interestingly,
locomotion predominance can be measured through mobile applications as well. For
instance, asking people to complete simple surveys for amusement is common
practice; “Am I a “go-getter”?” is a typical game on mobile apps like Facebook or
BuzzFeed. A fit between customers’ movement and survey data offers a path to
stronger engagement with customers using mobile advertising.
Thus, the ability to identify customers’ movement and regulatory mode, and to
do so in real-time, is uniquely enabled through digitization of physical retail stores. In
the face of strong competition from online retailers, analysis of such information
based on recent theories of customers’ regulatory mode may offer an edge and
improve the perception of value in the marketing mix for physical retailers.
6.2 Limitations and Further Research
Our findings are compelling, though questions still remain. Locomotion has
been positively related to effort investment in work activities (Pierro et al., 2006).
Literature on the Ikea effect furthermore links customers’ effort investment in
products to product value perceptions (Norton et al., 2012). Could locomotors’
preference for effort explain the presented findings? We believe that this is unlikely.
In our studies, the effort level was generally low. Walking around a table (Study 1),
stepping up and down a stepping stool (Study 2), or going for a fifteen-minute walk
(Study 3) are not high exertion activities. However, the effort investment hypothesis
18
customers spend hours walking around a shopping center to find the right product, or
rush to buy items during Black Friday sales. This creates an interesting extension to
the process we reported. Thus, further work is needed to better understand to what
extent high (vs. low) locomotors’ greater favorability to movement might derive from
the fit that movement produces for locomotors’ or the investment of effort in the
required movement.
In addition, physical movement requires cognitive resources that could
otherwise be used for evaluation (Lindenberger et al., 2000). Limiting cognitive
resources for evaluation would be in conflict with assessment motivations
(Kruglanski et al., 2000). Further research is necessary to test whether experiences of
progress or depletion of cognitive resources can explain the effects of movement. For
instance, our results hinted that in some instances high locomotors were neutral to
movement (i.e., movement’s potential detrimental effects were neutralized), and the
difference in perceived value was driven by the significant negative reaction to
movement of low predominant locomotion participants.
Another area for future research is the relevance of movement. “Relevance”,
refers to the degree to which interaction with the product facilitates movement in a
concrete and direct manner. A good example for relevant movement is a situation
where a specific movement is required for product performance (i.e.: integral
movement), such as when testing a new pair of Nike+ sensor-enabled sneakers. In our
results we found incidental, as well as integral, movements affected perceptions of
value. However, incidental movements were linked to mobile advertisements, while
integral movements were associated with products and their function. A set of studies
that reverses this design would be interesting. For instance, investigating incidental
19
integral movement in relation with mobile advertisements (e.g., targeting
advertisements as customers approach a product), could provide a fuller
understanding of the conditions under which movement affects perceived value.
These extensions may provide further insight on potential boundary conditions for the
20
References
Aaker, J. L., & Lee, A. Y., 2006. Understanding Regulatory Fit. J. Mark. Res. 43(1),
15–19. doi:10.1509/jmkr.43.1.15
Avnet, T., & Higgins, E. T., 2003. Locomotion, assessment, and regulatory fit: Value
transfer from “how” to “what.” J. Exp. Soc. Psychol. 39(5), 525–530.
doi:10.1016/S0022-1031(03)00027-1
Avnet, T., & Higgins, E. T., 2006. How regulatory fit affects value in consumer
choices and opinions. J. Mark. Res. 43(1), 1–10. doi:10.1509/jmkr.43.1.1
Chen, Y., & Chang, C., 2012. Enhance green purchase intentions. Manag. Dec. 50(3),
502–520. http://doi.org/10.1108/00251741211216250
Clifford, S., & Hardy, Q., 2013. Attention, Shoppers: Store Is Tracking Your Cell.
The New York Times, 5–9. Retrieved from
http://www.nytimes.com/2013/07/15/business/attention-shopper-stores-are-tracking-your-cell.html
Danaher, P. J., Smith, M. S., Ranasinghe, K., & Danaher, T. S., 2015. Where, when,
and how long: Factors that influence the redemption of mobile phone coupons. J.
Mark. Res. 52(5), 710–725. Retrieved from
http://ovidsp.ovid.com/ovidweb.cgi?T=JS&PAGE=reference&D=psyc11&NEW
S=N&AN=2015-44770-010
Daryanto, A., de Ruyter K., Wetzels M., & Patterson, P. G., 2010. Service firms and
21
a health club setting. J. Acad. Mark. Sci. 38(5), 604–616. doi:
10.1007/s11747-009-0165-x
Florack, A., & Scarabis, M., 2006. How advertising claims affect brand preferences
and category-brand associations: The role of regulatory fit. Psychol. Mark. 23(9),
741–755. doi:10.1002/mar.20127
Hayes, A., 2012. PROCESS: A Versatile Computational Tool for Observed Variable
Moderation, Mediation, and Conditional Process Modeling. White Paper, The
Ohio State University, 1–39. Retrieved from
http://www.afhayes.com/public/process2012.pdf
Higgins, E. T., 2000. Making a good decision: Value from fit. Am. Psychol. 55(11),
1217–1230. Retrieved from http://psycnet.apa.org/psycinfo/2000-14050-004
Higgins, E. T., 2006. Value from hedonic experience and engagement. Psychol. Rev.
113(3), 439–60. doi:10.1037/0033-295X.113.3.439
Higgins, E. T., 2012. Beyond pleasure and pain: How motivation works. Oxford
University Press, New York.
Higgins, E. T., Kruglanski, A. W., & Pierro, A., 2003. Regulatory mode: Locomotion
and assessment as distinct orientations. Adv. Exp. Soc. Psychol. 35, 293–344.
Retrieved from
http://www.sciencedirect.com/science/article/pii/S0065260103010050
Higgins, E. T., & Scholer, A. A., 2009. Engaging the consumer: The science and art
of the value creation process. J. Consum. Psychol. 19(2), 100–114.
22
Hollebeek, D. L., & Chen, T., 2014. Exploring positively- versus negatively-valenced
brand engagement: a conceptual model. J. Prod. & Brand Manag. 23(1), 62–74.
doi: 10.1108/JPBM-06-2013-0332
Hui, S. K., Inman, J. J., Huang Y., & Suher, J., 2013. The Effect of In-Store Travel
Distance on Unplanned Spending: Applications to Mobile Promotion Strategies.
J. Mark. 77(2), 1–16. doi:10.1509/jm.11.0436
Khajehzadeh, S., Oppewal, H., & Tojib, D., 2015. Mobile coupons: What to offer, to
whom, and where? Eur. J. Mark. 49(5/6), 851–873.
doi:10.1108/02683940010305270
Kruglanski, A. W., Thompson, E. P., Higgins, E. T., Atash, M. N., Pierro, A., Shah, J.
Y., & Spiegel, S., 2000. To “do the right thing” or to “just do it”: locomotion and
assessment as distinct self-regulatory imperatives. J. Pers. Soc. Psychol. 79(5),
793–815. Retrieved from http://www.ncbi.nlm.nih.gov/pubmed/11079242
Lindenberger, U., Marsiske, M., & Baltes, P. B., 2000. Memorizing while walking:
increase in dual-task costs from young adulthood to old age. Psychol. Aging
15(3), 417–36. Retrieved from http://www.ncbi.nlm.nih.gov/pubmed/11014706
Mathmann, F., Chylinski, M., de Ruyter, K., & Higgins, E. T., 2017. When Plentiful
Platforms Pay Off: Assessment Orientation Moderates the Effect of Assortment
Size on Choice Engagement and Product Valuation. J. Retail. in press. doi:
10.1016/ j.jretai.2017.02.001
Miller, G., 2012. The Smartphone Psychology Manifesto. Perspect. Psychol. Sci. 7(3),
23
Motyka, S., Grewal, D., Puccinelli, N. M., Roggeveen, A. L., Avnet, T., Daryanto, A.,
de Ruyter, K., & Wetzels, M., 2013. Regulatory fit: A meta-analytic synthesis. J.
Consum. Psychol. 24(3), 394–410. doi:10.1016/j.jcps.2013.11.004
Nike, 2012. Nike+ Presents: L.A. Live [Video file]. Retrieved from
https://www.youtube.com/watch?v=aihnaXAZ8VA
Nike, 2016. Super Bowl 50 preheats on the streets of San Francisco.
http://news.nike.com/news/super-bowl-50 (accessed 09.06.17)
Norton, M. I., Mochon, D., & Ariely, D., 2012. The IKEA effect: When labor leads to
love. J. Consum. Psychol. 22(3), 1–8. http://doi.org/10.1016/j.jcps.2011.08.002
Pham, M. T., & Chang, H. H., 2010. Regulatory Focus, Regulatory Fit, and the
Search and Consideration of Choice Alternatives. J. Consum. Res. 37(4), 626–
640. doi:10.1086/655668
Pham, M. T., Hung, I. W., & Gorn, G. J., 2011. Relaxation Increases Monetary
Valuations. J. Mark. Res. 48(5), 814–826. doi:10.1509/jmkr.48.5.814
Pierro, A., Kruglanski, A. W., & Higgins, E. T., 2006. Progress takes work: Effects of
the locomotion dimension on job involvement, effort investment, and task
performance in organizations. J. Appl. Soc. Psychol. 36(7), 1723–1743.
doi:10.1111/j.0021-9029.2006.00078.x
Scholer, A. A., & Higgins, E. T., 2009. Exploring the complexities of value creation:
The role of engagement strength. J. Consum. Psychol. 19(2), 137–143.
24
Shankar, V., & Balasubramanian, S., 2009. Mobile Marketing: A Synthesis and
Prognosis. J. Interact. Mark. 23(2), 118–129. doi:10.1016/j.intmar.2009.02.002
Spiller, S., Fitzsimons, G., Lynch J. G., & McClelland, G., 2013. Spotlights,
floodlights, and the magic number zero: Simple effects tests in moderated
regression. J. Mark. Res. 50 (2), 277–288. doi: 10.1509/jmr.12.0420
The Spotify Team., 2015, May 20. This is Spotify Running [Video file]. Retrieved
from https://www.youtube.com/watch?v=0fZBqV_yMq4
Varnali, K., & Toker, A., 2010. Mobile marketing research: The-state-of-the-art. Int.
J. Inform. Manag. 30(2), 144–151. doi:10.1016/j.ijinfomgt.2009.08.009
Wu, K., Vassileva, J., Noorian, Z., & Zhao, Y., 2015. How do you feel when you see
a list of prices? The interplay among price dispersion, perceived risk and initial
trust in Chinese C2C market. J. Retail. Consum. Serv. 25(4), 36–46.
http://doi.org/10.1016/j.jretconser.2015.03.007
Yang, Z., & Peterson, R. T., 2004. Customer perceived value, satisfaction, and
loyalty: The role of switching costs. Psychol. Mark. 21(10), 799–822.
http://doi.org/10.1002/mar.20030
Zhao, X., Lynch Jr., J. G., & Chen, Q., 2010. Reconsidering Baron and Kenny: Myths
and Truths about Mediation Analysis. J. Consum. Res. 37(2), 197–206.
25
Fig. 1: Locomotion Fit From Movement and the Role of Engagement Strength in
Perceived Value in aspects of the marketing mix.
Physical Movement
Engagement Strength
Perceived Value (in aspects of marketing mix) Locomotion
Predominanc
Study 1 Studies 2, 3
26
Fig 2. Value Perceptions as a function of Movement and Predominant Locomotion
Orientations, Study 1
-.16
The
e
ff
ec
t of Mov
ement
on Va
lue
P
erc
epti
ons
Predominant Locomotion Orientations
Notes: The graph is based on a floodlight analysis (Spiller et al., 2013) and illustrates
the effect of movement on value perceptions for any predominant locomotion value.
The shaded area represents confidence intervals and the J-N point is obtained at
27
Fig 3. Value Perceptions as a function of Movement and Predominant Locomotion
Orientations, Study 2
-.80
The
e
ff
ec
t of Mov
ement
on Va
lue
P
erc
epti
ons
Predominant Locomotion Orientations
Notes: The graph is based on a floodlight analysis (Spiller et al., 2013) and illustrates
the effect of movement on value perceptions for any predominant locomotion value.
The shaded area represents confidence intervals and the J-N point is obtained at
28
Fig. 4. Engagement as a function of Movement and Predominant Locomotion
Orientations, Study 3
1.36
The
e
ff
ec
t of Mov
ement
on Enga
ge
ment
Predominant Locomotion Orientations
Notes: The graph is based on a floodlight analysis (Spiller et al., 2013) and illustrates
the effect of movement on engagement for any predominant locomotion value. The
shaded area represents confidence intervals and the J-N point is obtained at
29
[image:30.595.88.512.155.269.2]Tables
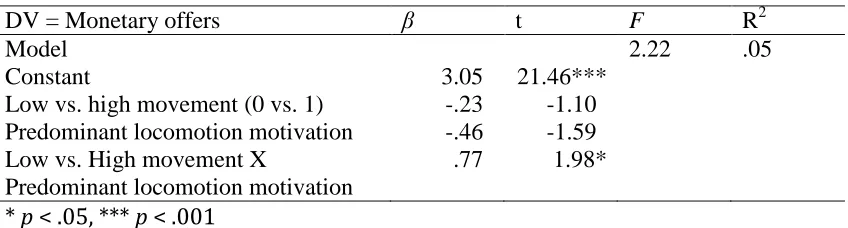
Table 1
Monetary offers as a function of Predominant locomotion motivation and Movement
DV = Monetary offers β t F R2
Model 2.22 .05
Constant 3.05 21.46***
Low vs. high movement (0 vs. 1) -.23 -1.10 Predominant locomotion motivation -.46 -1.59 Low vs. High movement X
Predominant locomotion motivation
.77 1.98*
30
Table 2
Value perceptions as a function of Predominant locomotion motivation and Movement
DV = Value perceptions β t F R2
Model 1.66 .13
Constant 1.86 14.60***
Low vs. high movement (0 vs. 1) -.21 -.81 Predominant locomotion motivation -.10 -.61 Low vs. high movement X
Predominant locomotion motivation
.66 2.03*
31
Table 3
Indirect conditional effect of Movement on Product valuations through Engagement
DV = Engagement Model 1
Β t F R2
Model 1.68 .04
Constant 3.22 47.76***
Steps per Second .04 .40
Predominant locomotion motivation .01 .07 Steps per Second X Predominant
locomotion motivation
.20 2.14*
DV= Perceived Value Model 2
Β t F R2
Model 2.14 .07
Constant 2.08 7.19***
Engagement .24 2.68**
Steps per Second -.08 -.98
Predominant locomotion motivation .05 .72 Steps per Second X Predominant
locomotion motivation
-.06 -.74
Indirect effects
Boot indirect effect BootSE BootL95 BootU95
Highest order interaction .05 .03 .0034 .1219
Engagement
32
Appendix
Floor plan for movement and stasis conditions Study 1.
Movement
Stasis
Symbol key:
Large Table Experimenter
movement
Small Table Experimenter
Location of
chocolates 1234
Experimenter office cubicle 1 2 3 4
33
Participant movement
34
1Not to be confused with regulatory focus theory (Higgins, 2012), which involves