City, University of London Institutional Repository
Citation
:
Mamouei, M. H., Qassem, M., Budidha, K. ORCID: 0000-0002-6329-8399,
Baishya, N., Vadgama, P. and Kyriacou, P. A. ORCID: 0000-0002-2868-485X (2019).
Comparison of a Genetic Algorithm Variable Selection and Interval Partial Least Squares for
quantitative analysis of lactate in PBS. 2019 41st Annual International Conference of the
IEEE Engineering in Medicine and Biology Society (EMBC), pp. 3239-3242. doi:
10.1109/embc.2019.8856765
This is the accepted version of the paper.
This version of the publication may differ from the final published
version.
Permanent repository link:
http://openaccess.city.ac.uk/id/eprint/23040/
Link to published version
:
http://dx.doi.org/10.1109/embc.2019.8856765
Copyright and reuse:
City Research Online aims to make research
outputs of City, University of London available to a wider audience.
Copyright and Moral Rights remain with the author(s) and/or copyright
holders. URLs from City Research Online may be freely distributed and
linked to.
City Research Online:
http://openaccess.city.ac.uk/
[email protected]
Abstract— Blood lactate is an important biomarker that has been linked to morbidity and mortality of critically ill patients, acute ischemic stroke, septic shock, lung injuries, insulin resistance in diabetic patients, and cancer. Currently, the clinical measurement of blood lactate is done by collecting intermittent blood samples. Therefore, noninvasive, optical measurement of this significant biomarker would lead to a big leap in healthcare. This study, presents a quantitative analysis of the optical properties of lactate. The benefits of wavelength selection for the development of accurate, robust, and interpretable predictive models have been highlighted in the literature. Additionally, there is an obvious, time- and cost-saving benefit to focusing on narrower segments of the electromagnetic spectrum in practical applications. To this end, a dataset consisting of 47 spectra of Na-lactate and Phosphate Buffer Solution (PBS) was produced using a Fourier transform infrared spectrometer, and subsequently, a comparative study of the application of a genetic algorithm-based wavelength selection and two interval selection methods was carried out. The high accuracy of predictions using the developed models underlines the potential for optical measurement of lactate. Moreover, an interesting finding is the emergence of local features in the proposed genetic algorithm, while, unlike the investigated interval selection methods, no explicit constraints on the locality of features was imposed. Finally, the proposed genetic algorithm suggests the formation of α-hydroxy-esters methyl lactate in the solutions while the other investigated methods fail to indicate this.
I. INTRODUCTION
The importance of lactate may best be described through its relationship with Adenosine TriPhosphate (ATP), known as the universal energy currency of cells. It stores energy in a form that can be readily utilized by cells and is, therefore, seen in all living organisms, fueling various biological processes such as biosynthesis, metabolism, DNA synthesis, muscle contraction, and impulse transition in the nervous system [1]. In the human body, ATP is produced using a chain of biochemical reactions collectively known as cellular respiration that involves a dynamic equilibrium between oxygen, glucose, pyruvate, lactate, fatty and amino acids. The final outcome of this chain of reactions may be summarized by the reduction of glucose to water, carbon dioxide, and the production of 38 ATPs. A disturbance in this equilibrium state can lead to an imbalance in the normal levels of each of the participating entities. For instance, an insufficient supply of oxygen is known to increase glycolysis, and as a result, lead to elevated lactate levels. This can happen as a result of a
*This research is funded by the Engineering and Physical Sciences Research Council (EPSRC).
1 All authors are with the Research Centre for Biomedical Engineering
(RCBE), School of Mathematics, Computer Science & Engineering, City, University of London, Northampton Square, London, EC1V 0HB, UK (phone: +44 (0) 20 7040 3878; e-mail: [email protected]).
reduction in blood supply, insufficient delivery of oxygen to tissue, or inadequate cardiac pump [2]. Moreover it has been suggested that cancer cells have a different pattern of energy consumption that leads to higher lactate levels even in the presence of oxygen (aerobic glycolysis) [3].
From a physiological perspective, different organs show different lactate, intake/output behavior; some are lactate producing, some are lactate consuming, some are lactate recycling, and some are lactate clearing. For instance, lactate, along with glucose, is known to be an efficient fuel for the brain. Excess, non-metabolized lactate in skeletal muscle is shipped to the liver and converted back to glucose (Cori cycle), and the kidney plays an important role in clearing
lactate in hyperlactatemia. The “lactate shuttle” theory
hypothesizes a more dynamic, pH-dependent flow of lactate between organs [4]. This brief summary underlines the importance of lactate as a biomarker that can shed light on the energy consumption patterns of the body in the cellular and physiological levels, and therefore, can contribute to the diagnosis and prognosis of many life-threatening conditions.
Currently, the gold standard for lactate measurement requires blood sampling, which is invasive, time-consuming, and costly. The development of an optical lactate sensor can resolve these issues, and pave the way for continuous, noninvasive measurements. Furthermore, achieving this aim would facilitate the incorporation of this important biomarker in AI-driven health analytics. To achieve this purpose, it is necessary to investigate the optical properties of lactate and identify the regions of the optical spectrum that are sensitive to lactate. To this end, this study reports a quantitative analysis of Attenuated Total Reflectance Fourier Transform Infrared (ATR-FTIR) spectra obtained from the controlled variation of Na-lactate in isotonic Phosphate Buffer Solution (PBS).
II. BACKGROUND A. Partial Least Squares
Spectroscopic data can often be characterized by a large number of variables, p, and relatively small number of observations, n; known as the large p, small n problem. However, many of the variables (wavelengths) are collinear and many are uninformative. Therefore, dimensionality reduction methods such as Principle Component Regression (PCR) and Partial Least Squares (PLS) can often adequately reduce the dimensionality of the independent variables space by projecting them onto lower dimensional spaces, called principle components or latent variables. Additionally, they are both linear regression methods, and the Beer-Lambert law provides the theoretical justification for the choice of linear models. Based on this law the relationship between the concentration of a molecule and its optical absorbance is
Comparison of a Genetic Algorithm Variable Selection and Interval
linear. In practical applications, this linearity assumption often remains valid when the concentration of the absorbing species is low.
While the predictive ability of PLS and PCR have often been shown to be very similar in practical applications, PLS usually achieves the same level of predictive ability with less latent variables. This is due to the fact that PLS maximizes the covariance between independent variables, X, and dependent variables, Y, while PCA finds the axes (eigenvectors) of the maximal variance in the independent variable space, X. Throughout this paper, PLS is used, but the methods discussed can be generalized to incorporate PCR or nonlinear regression methods, such as SVR with nonlinear kernels, and Artificial Neural Networks (ANNs). PLS can be described with (1),
Y=XB+G (1)
where X denotes the (n×p) matrix of independent variables, for instance, the absorption profiles of n samples, each including p wavelengths. Y denotes the (n×m) matrix of dependent variables, where m is the number of dependent variables, e.g. the concentrations of m absorbing species for n spectra. B is the (p×m) matrix of regression coefficients, and G is the (n×m) matrix the of regression residuals [5].
The choice of the number of Latent Variables (LVs), can determine overfitting or under-fitting. While many criteria in the literature exist, a common approach is the selection of the point where the Predicted Residual Error Sum of Squares (PRESS) as a function of the number of LVs plateaus. B. Wavelength Selection
While both PLS and PCA adequately deal with collinear variables, it has been shown that the exclusion of redundant, noisy, and uninformative variables from models can lead to improved accuracy and more robust models [6]. Moreover, the identification of the wavelengths with relevant information about absorbing species offers clear advantages in terms of interpretability of models. Last but not least, from a practical point of view, whether the objective is monitoring an absorbing species or building species-monitoring sensors, narrowing down the focus on smaller segments of the optical spectrum has clear cost-saving benefits.
This study, provides the first application of wavelength selection to lactate and PBS in the IR region. Previously, a quantitative investigation of lactate in blood was carried out using FT-NIR and without wavelength selection [7]. Two types of wavelength selection methods are investigated; an interval selection method, namely interval PLS (iPLS) [8], and a heuristic global optimization method, in particular a genetic algorithm (GA).
1) Interval Selection: Considering the large p, small n nature of spectroscopic data, the application of the classical variable selection methods, such as Forward Selection (FS), Backward Selection (BS) and Stepwise Selection (SS), lead to excessive development, rejection, and selection of models. As a result, statistical measures of significance such as p-values and t-statistics become unreliable and overfitting becomes much more likely. One way to circumvent this problem is to split the original spectrum into equidistant
intervals and consider each interval as a variable. This is the principle idea behind interval PLS (iPLS) [8]. Subsequently, each interval is used for the development of local models and a Measure of Performance (MoP) such as Root Mean Square Error Cross-Validation (RMSECV) is used to evaluate the relevance of intervals.
Since using this simple pretreatment the original number of variables can be reduced from (potentially) thousands of wavelengths to tens of intervals, the application of classical variable selection methods will also become more tractable. Additionally, since spectroscopic data have local features it may be more plausible to assess intervals instead of individual wavelengths.
The key limitation of iPLS lies in the suggestion of equidistant intervals which makes it very unlikely to find the optimal interval or intervals. Micro-optimizations such as single-sided and double-sided expansion and shrinkage of the local windows were suggested in [8] and many variations and modification have been proposed by others [9]. However, the key trade-off between model selectivity and overfitting has to be considered.
2) Heuristic Global Optimization Methods: Variable (wavelength) selection can be formulated as an optimization problem, i.e. finding a combination of variables with which an MoP, such as RMSECV or RMSE Calibration (RMSEC), can be improved. Given the nonlinear nature of the optimization landscape in variable selection, and the binary nature of selection/deselection, GAs have been widely used for this purpose [10].
A straightforward implementation of GA can represent the selection/deselection of every variable using a bit string. In this representation, every chromosome (candidate solution) will contain a possible combination of variables, where one denotes the selection of the corresponding variable. Each chromosome in the population is assigned a fitness value -or unfitness value in a minimization problem- and, through selection and cross-over operations, pass on their “good” features to the next generation of chromosomes. A third operation, mutation, ensures a degree of exploration.
Without local assumptions and due to intense selectivity, this formulation is bound to lead to overfitting. In this study following measure are taken to mitigate the issue; (1) GA is run 100 times and the results are averaged. (2) Prior to each GA run, five samples are randomly held out (resampling). At the end of the GA run, the out-of-fold prediction errors are assessed to keep or discard the solution. Here, the critical value was set one. (3) The unfitness value is defined as the bootstrapped estimation of MSEC. One hundred resampling operations are performed for each MSEC estimation. This layered, bootstrapped design along with the averaging of the number of times that variables are selected, reduces the likelihood of overfitting.
III. EXPERIMENTAL SETUP
water. The lactate stock solution was then diluted with 1X aqueous PBS to make 47 solutions with molar concentrations of lactate ranging between 0 to 18 mmol/L. The lactate increments are 0.25 mmol/L within the range of 0-5 mmol/L (21 samples), and 0.5 mmol/L within the range of 5-18 mmol/L (26 samples).
All solutions were maintained at room temperature 24˚C (±0.5), and their pH values were tested to be 6.5 (±0.2). Measurement of pH was carried out using Orion Star A211 Advanced pH Benchtop Meter Kit (Thermo Fisher Scientific, Massachusetts, USA). The concentrations of lactate were verified using LM5 lactate analyzer (Analox Instruments Limited, Stourbridge, England, UK).
ATR-FTIR spectra of samples, within 450-4000 cm-1, was obtained using Spectrum Two FT-IR Spectrometer (Perkin Elmer, Massachusetts, USA) with horizontal ATR accessory- ZnSe crystal (Pike Technologies, Madison, WI, USA) and the following settings, resolution of 4 cm-1, interval of 1 cm-1, accumulation of 100 scans, and internal Jacquinot-stop of 8.94 mm. The lactate solutions were run at random to prevent any potential temporal bias.
All preprocessing operations and implementation of algorithms were carried out in MATLAB R2018a.
IV. RESULTS
The data is randomly split into a calibration set of 39 observations and a validation set of 8 observations. The region of spectra between 450-700 cm-1 was removed from all samples due to high frequency noise. The choice of preprocessing operations including Savitzky-Golay (SG) derivation parameters, and application of Multiplicative Scattering Correction (MSC) or Extended MSC, along with the number of PLS components for the complete model (without wavelength selection) were guided by the results of a GA-based minimization of leave-one-out RMSCV within the calibration set. As a result, no scattering correction was applied and the following SG parameters were selected; sliding window length of 151 cm-1, polynomial order of 5, and first-order derivation.
A. Interval PLS and forward selection interval PLS
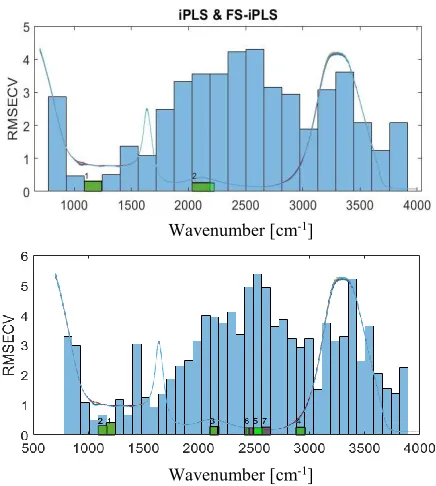
The key parameter that should be decided in iPLS is the number of intervals. In this study two interval numbers were tested, 20 and 40. Moreover, the combination of FS and iPLS is investigated (FS-iPLS). In FS-iPLS after the selection of the interval with the least RMSECV, the remaining intervals are one-by-one combined with the first selected interval, and the combination that leads to the least RMSECV will be selected. This process continues until no further reduction in RMSECV can be obtained. For both iPLS and FS-iPLS micro-optimizations were carried out on the selected intervals according to the suggestions of [8].
Fig. 1, illustrates the application of iPLS using 20 and 40 intervals. In this figure, the blue bars denote RMSECV for the local models in iPLS. The green bars pertain to FS-iPLS and show the reduction of RMSECV as additional intervals are combined with the first selected interval. The diversions of the intervals encompassed by the green windows compared to the original intervals (blue bars) are the result of the interval micro-optimization.
[image:4.612.326.544.52.295.2]0
Figure 1. The application of iPLS and FS-iPLS with a) 20 intervals and b) 40 intervals on the lactate and PBS ATR-FTIR dataset.
Two intervals can be inferred from Fig. 1.a; A) the interval with the least error, i.e. interval number 3, this will be denoted with iPLS20 and B) the combination of the two intervals selected by FS-iPLS (the green bars in Fig. 1), denoted with FS-iPLS20. Similarly, two models are selected for iPLS40.
B. Genetic Algorithm
[image:4.612.319.551.468.546.2]Fig. 2 illustrates the probability of the selection of wavelengths using the implemented GA, P(wi). This probability is calculated as the number of times that a wavelength was selected in 100 GA runs, divided by 100.
Figure 2. The normalized frequency of the selection of variables in the proposed GA method, applied to the lactate and PBS ATR-FTIR dataset.
Interestingly, it can be seen that while unlike iPLS, the locality of features is not hardcoded in the method, local features have emerged, i.e. adjacent wavelengths have relatively similar P(wi) values. Additionally, unlike iPLS, the region between 3260-3650 cm-1 includes a few significant intervals, particularly the interval 3490-3520 cm-1, which has
previously been linked to α-hydroxy-esters methyl lactate [11]. These differences can be explained by the fact that, firstly, the GA-based method does not start with pre-determined intervals. Secondly, it imposes no constraints on the pairing of non-neighboring wavelengths.
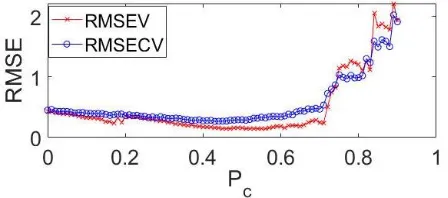
Before the development of a model, one has to determine a threshold for the probability of wavelengths, P(wi), for selection; this value is denoted by Pc. The authors suggest the
Wavenumber [cm-1]
Wavenumber [cm-1]
use of a separate (dependent) validation set, or RMSECV. Fig. 3, depicts these values as a function Pc. A good tradeoff between variable reduction and model performance can be obtained at Pc=0.61. Therefore, all variables with P(wi) > Pc are eliminated.
Figure 3. RMSEV and RMSECV as a function of the cut-off value for the probability of selection.
C. Comparison of models
[image:5.612.53.300.410.605.2]In this subsection, the five variable-reduced models, and the complete model are compared. Prior to the analysis, the optimal number of components for all six models were selected as the elbow point in the PRESS plot. The comparison of models is carried out using bootstrapping and a validation set that was separated from the dataset in the beginning. In each iteration of bootstrapping, five samples are randomly held out (resampling), a model is calibrated based on the remaining samples, and the RMSE of predictions of the five held-out samples is calculated. This operation is repeated 10000 times (with replacement). Table 1. summarizes the results.
TABLE I. THE COMPARISON OF THE FIVE MODELS WITH THE COMPLETE PLSMODEL
Models #Wave- Models Specifications
lengths #LVs a (std(SE))RMSEV b %Rv2 RMSECV (std(SE))b
PLS 3152 5 (0.07) 0.34 99.68 (0.45) 0.54
iPLS20 151 6 (0.09) 0.31 99.72 (0.15) 0.33
iPLS20_FS 345 8 (0.04) 0.21 99.86 (0.1) 0.24
iPLS40 84 6 (0.14) 0.38 99.59 (0.37) 0.45
iPLS40_FS 424 9 (0.04) 0.27 99.79 (0.1) 0.26
GA-PLS 391 4 (0.33) 0.42 99.51 (0.37) 0.48
a. LV denotes the number of latent variables or components used in each model b. The value inside brackets represents the standard deviation of squared errors
V. CONCLUSION
In this study all investigated models obtained promising prediction performances, and it was shown that using wavelength selection, parsimonious models with higher accuracies can be obtained for optical measurement of lactate. Building on these results, we plan to continue our investigation on more complex matrices such as blood, and in the NIR region.
Table I. shows that the FS-iPLS models outperform others in terms of error values. The iPLS improves the performance
while significantly reducing the number of variables, if the number of intervals is selected carefully. The proposed GA-based wavelength selection method, obtains a comparable error performance with the full PLS model, while eliminating many uninformative variables. It also requires the smallest number of LVs. This can be associated with the definition of the fitness function. Choosing the subset of variables with the least RMSEC can be viewed as minimizing model uncertainty [12]. Nevertheless, a few interesting properties were observed. (1) The GA method seems to have circumvented overfitting. (2) Using this method, a flexible, unconstrained representation of variable importance can be obtained while the other methods have parameter-dependence and flexibility limitations. As a result the proposed GA method identified the formation of a new species while the other methods failed to give any indication of this. Our future effort will be dedicated to exploring other fitness functions and conducting more conclusive comparisons by investigating more wavelength selection techniques and using different datasets.
REFERENCES
[1] P. D. Boyer, "Energy, Life, and ATP," Bioscience Reports, p. 97–117, 1998.
[2] C. Lazzeri, S. Valente, M. Chiostri and G. F. Gensini, "Clinical significance of lactate in acute cardiac patients," World Journal of
Cardiology, p. 483–489, 2015.
[3] B. Jiang, "Aerobic glycolysis and high level of lactate in cancer metabolism and microenvironment," Genes & Diseases, vol. 4, no. 1, pp. 25-27, 2017.
[4] G. A. Brooks, "The Science and Translation of Lactate Shuttle Theory," Cell Metabolism, vol. 27, no. 4, pp. 757-785, 2018. [5] R. Rosipal and N. Krämer, "Overview and Recent Advances in Partial
Least Squares," in International Statistical and Optimization Perspectives Workshop "Subspace, Latent Structure and Feature
Selection", Bohinj, Slovenia, 2006.
[6] C. H. Spiegelman, M. J. McShane, . M. J. Goetz, M. Motamedi, Q. L. Yue and G. L. Coté, "Theoretical Justification of Wavelength
Selection in PLS Calibration: Development of a New Algorithm,"
Analytical Chemistry, vol. 70, no. 1, p. 35–44, 1998.
[7] D. Lafrance, L. C. Lands and D. H. Burns, "Measurement of lactate in whole human blood withnear-infrared transmission spectroscopy,"
Talanta, vol. 60, no. 4, pp. 635-641, 2003.
[8] L. Nørgaard, A. Saudland, J. Wagner, J. P. Nielsen, L. Munck and S. B. Engelsen, "Interval Partial Least-Squares Regression (iPLS): A Comparative Chemometric Study with an Example from Near-Infrared Spectroscopy," Applied Spectroscopy, vol. 54, no. 3, p. 413–419, 2000. [9] L.-L. Wang, Y.-W. Lin, X.-F. Wang, N. Xiao, Y.-D. Xu, H.-D. Li and
Q.-S. Xu, "A selective review and comparison for interval variable selection in spectroscopic modeling," Chemometrics and Intelligent
Laboratory Systems, vol. 172, no. 1, p. 229–240, 2018.
[10] A. Niazia and R. Leardi, "Genetic algorithms in chemometrics,"
Journal of Chemometrics, vol. 26, no. 6, pp. 345-351, 2012.
[11] N. Seurre, K. Le Bardu-Debus, F. Lahmani, A. Zehnacker, N. Borho and M. A. Suhm, "Chiral recognition between lactic acid derivatives and an aromatic alcohol in a supersonic expansion: electronic and vibrational spectroscopy," Physical Chemistry Chemical Physics, vol. 8, no. 8, p. 1007–1016, 2006.
[12] J.-H. Jiang, R. James Berry, H. W. Siesler and Y. Ozaki, "Wavelength Interval Selection in Multicomponent Spectral Analysis by Moving Window Partial Least-Squares Regression with Applications to Mid-Infrared and Near-Mid-Infrared Spectroscopic Data," Analytical Chemistry,