1
Probing pheomelanin synthesis using thioflavin T fluorescence
A D Davy and D J S Birch*
Photophysics Group, Department of Physics, SUPA,
University of Strathclyde, Glasgow, G4 0NG, Scotland
ABSTRACT
The fluorescent rotor probe thioflavin T (ThT) is used to investigate the presence of sheet structures in pheomelanin by studying the formation and disassembly of pheomelanin synthesized from L-cysteine, L-DOPA and the enzyme tyrosinase. Brown/black eumelanin and red/yellow pheomelanin are the most common forms of melanin with the former more extensively studied. The conclusion of decades of research is that both melanins possess ill-defined polymeric structures, which are reflected in their complex photophysics. The structural integrity and co-existence of these two forms has significant bearing on their functionality and indeed their spectroscopy offers possibilities as a melanoma biomarker. Extrinsic fluorescence probes have been little used to study melanin, but the evidence from ThT fluorescence is consistent with other techniques in finding that eumelanin’s constituent dihydroxyindoles form a stacked sheet structure akin to graphite. Whether or not such an equivalent sheet structure exists for pheomelanin’s constituent benzothiazines and benzothiazoles is unresolved. On investigating this possibility we find a sigmoidal increase in ThT fluorescence during pheomelanin synthesis is similar to that observed for eumelanin, implying a sheet structure. A red spectral shift in ThT fluorescence in pheomelanin and the emergence of a fluorescence decay component of ~ 5.5 ns, much longer than that of ThT, are interpreted in terms of sites wherein ThT is coupled to pheomelanin’s native structure. Such sites can act as fluorescent traps to which energy is funneled when melanin is excited and the composite fluorescence yield thus increased. However, we find the abundance of this decay component is significantly less for pheomelanin (6%) than eumelanin (11%), suggesting that ThT does not intercalate so readily in pheomelanin. This may reflect less sheet structure or tighter binding of pheomelanin’s sheets, consistent with its low fluorescence quantum yield. Disassembling pheomelanin upon raising pH provides further spectroscopic evidence that ThT is trapped in sheet-like aggregates of smaller oligomeric forms.
Keywords: Pheomelanin, eumelanin, thioflavin T, fluorescence spectra, fluorescence lifetime, sheet structure, melanoma, rotor probes,
1. INTRODUCTION
The hetero-biopolymer melanin is a key metabolite with somewhat “good guy, bad guy” dual properties. It protects us from the harmful effects of ultraviolet light, is anti-oxidative, a free-radical scavenger and yet is also implicated in melanoma (the most virulent form of skin cancer) and has links to neurodegenerative disease.1,2 Although it is often compared to the sheet structures of graphite and lignin, melanin’s low solubility and reluctance to crystallize have for decades frustrated attempts to fully understand its formation process and its structure remains largely unresolved at the functional level.
Melanin assembles from small molecules, much like a jigsaw, and like a jigsaw the fine detail of assembly is quickly lost in the emerging structure. Because of its relevance to disease it is clear that discovering melanin’s fundamental functional unit will have a significant impact on healthcare. Similarly, replicating this functional unit could well convert melanin’s novel physical properties into new technology. However, we do not definitively know if melanin has a protomolecule or not, if it is the same as the minimum functional unit, and if both do exist, at what stage they are formed.
---
2
There are two common forms of human melanin. Eumelanin is the brown/black pigment and pheomelanin the red/yellow pigment. Figure 1shows their different synthetic pathways.3 The laboratory synthesis of eumelanin formed by the oxidation of L-DOPA is thought to bear strong structural similarities to natural melanin that is commercially available from the ink sacs of cuttlefish (Sepia Officinalis), the latter differing by the presence of protein, amino acids, sugars, lipids and metal ions.4
Synthesis of melanin in mammals occurs in organelles called melanosomes within melanocytes and proceeds from the amino acid L-tyrosine though a series of chemical and enzymatic steps facilitated by the copper-containing glycoprotein tyrosinase. In the case of eumelanin unstable intermediates include dopaquinone and dopachrome before the more stable 5,6-dihydroxyindole (DHI) and 5,5-dihydroxyindole-2-carboxylic acid (DHICA), and their oxidized forms are produced. The oxidation of these primary structures is then thought to give rise to oligomers, which further aggregate into π– stacked cross-linked sheet structures and subsequently supramolecular aggregates. Unfortunately no equivalent natural analogue to Sepia Officinalis exists for pheomelanin, but, like eumelanin, there is a synthetic analogue. In the case of pheomelanin the addition of cysteine to form the precursor cysteinldopa leads to mainly sulfur-containing benzothiazine and benzothiazole derivatives rather than dihydroxyindoles. Figure 1 provides a summary of some of the key steps in the laboratory synthesis of both forms.3 Whether or not sheet structures exist in pheomelanin has been an unanswered question for some time and provides the basis of our study here. The coexistence of both forms of melanin in skin is in itself potentially useful as the ratio of eumelanin to pheomelanin using two-photon excitation5 has been proposed as a cancer biomarker.6 Hence the more that can be understood about the structure-spectroscopy relationship of both forms serves important medical applications spanning both cancer diagnostics and neurology.
Figure1. Summary of the synthetic pathways for eumelanin and pheomelanin [3]. The structure of ThT is also shown.
3
complicated by overlapping bands,12 thus offering little structural insight although the presence of copper ions can simplify the usual complex intrinsic fluorescence, producing only one fluorescence decay component, suggesting a single excited state and a more uniform structure.13,14
Although the constituents of melanin are known melanin’s poor solubility and unsuitability for crystallography have defied conventional approaches to finding how they are organized, with conflicting models continuously emerging. For example in 2015 it was proposed from mass spectrometry data15 that self-aggregates of the eumelanin precursor, L-3,4-dihydroxylphenylalanine (L-DOPA), not its polymeric auto-oxidative products such as dihydroxyindoles, form the basis of the structure. In 2016 others reported evidence16for yet a different structure, porphyrin-like, to explain electrochemical fingerprinting data. Seeking to resolve such contradictions and confusion, and driven by the opportunities in healthcare and technology, discovering more about melanin’s fundamental structural-spectroscopic links is of paramount importance. Nevertheless within this apparent conflict of knowns and unknowns the consensus has endured that eumelanin is akin to graphite with a stacked sheet structure loosely bound by π electrons.17
There can be no doubt that the structure-spectroscopic links have been far more widely researched for eumelanin than pheomelanin. Perhaps somewhat surprisingly fluorescence studies of both forms of melanin have been largely confined to intrinsic fluorescence rather than the use of extrinsic probes, despite the latter’s increasing popularity in other areas, some closely related to melanin.18,19 Previously we used the rotor probe thioflavin T (ThT), which is widely used to detect beta sheets in protein and sheets of beta-amyloid (Aβ) associated with Alzheimer’s disease,20 to provide complementary fluorescence evidence of the sheet structure of eumelanin.21 Recently we have extended this approach in comparisons between eumelanin and pheomelanin.22 As can be seen from Figure 1 ThT is a benzothiozole with more structural similarity with pheomelanin’s benzothiazine and benzothiazole building blocks than it has with those of eumelanin. This might be expected to improve the probe’s sheet-sensing capability. Indeed here we report evidence from both the assembly and disassembly of pheomelanin that ThT forms a photophysically coupled complex within pheomelanin sheets.
2. EXPERIMENTAL DETAILS
1.1 Pheomelanin assembly
All chemicals were supplied by Sigma-Aldrich and used as delivered. The pheomelanin synthesis was similar to a previously reported protocol.23 Stock solutions of L-DOPA (>98 %), L-Cysteine (>97 %), mushroom tyrosinase with 2687 enzymatic units per mg (u/mg) and ThT were made by mixing each compound with distilled water at a concentration of 3 mM for DOPA and cysteine, 1 mM for ThT and 1500 u/ml for tyrosinase. The stock solution of L-DOPA was sonicated for 5-10 min to ensure complete dissolution. The sample pH was between 6.4 and 7. Relative concentrations of 40 μM L-DOPA and 40 µM ThT were the same as used previously for eumelanin21 with 125 μl of ThT being added to 3 ml of distilled water, followed by 125 μl of melanin solution. Concentrations of L-DOPA and cysteine had a ratio of 1 mM: 1 mM and the tyrosinase concentration was diluted to 750 enzymatic units per ml (u/ml). Eumelanin was prepared as for pheomelanin at 40 µM of L-DOPA and 40 µM ThT mixed in distilled water, but with a solution of ammonium hydroxide prepared via dilution of ammonium hydroxide (max 33% NH3) solution with distilled
water. The volume of ammonium hydroxide needed to increase the pH to 10 was 10 μl. Prior to measurement, the diluted samples were aspirated 3 times with a 1 ml pipette and then sealed with Parafilm.
1.2 Pheomelanin disassembly
Dissolution of melanin was achieved by raising the pH along the lines published previously for Sepia Officinalis.24 Prepared solutions of 40 μM melanin with 40 μM ThT were left to react overnight. Samples where then spun down at 2000xg, for 10 mins, to remove free dye. The collected pellet was suspended in 1M NaOH overnight. (Previously 12 hours was taken for complete disassembly.24) Solutions were deoxygenated by bubbling N2 gas through the stock
solutions. The next day, an equal volume of deoxygenated 1 M KH2PO4 was added to neutralize the pH and prevent
4
melanin particles. For comparison we also dissembled Sepia Officinalis using the same protocol and observed the same spectral changes as previously reported.24
1.3 Spectroscopy measurements
Steady-state spectroscopy measurements were performed using 4 ml, clear wall, UV grade, plastic cuvettes (Fisher Scientific). Absorption spectra were obtained on a Perkin-Elmer Lambda 25 spectrophotometer using a reference optical channel. The wavelength range was 250 nm to 1100 nm with a scan speed of 960 nm/min. Fluorescence spectra were measured using a HORIBA FluoroMax 2 fluorimeter. Time series data were obtained with the excitation monochromator set to 450 nm and the emission monochromator set to 490 nm to be consistent with previous work21,25 and maximize the fluorescence as ThT is a complicated probe with a fluorescence spectrum which depends on the excitation wavelength.26 The integration time and the measurement time interval was 1 second. Optical bandwidths were fixed at 4 nm for both excitation and emission. The total number of data points was 7200, which equated to a 2 hour measurement. A 7x2 mm stir bar kept the solution mixed without vortex formation.
Time-correlated single-photon counting fluorescence decay measurements were performed using a HORIBA Jobin Yvon IBH DeltaFlex incorporating non-linear least-squares reconvolution analysis with DAS6 software and a χ2 goodness of fit criterion.27,28 2 - 4 exponential models were used as appropriate. Excitation was with a NanoLED laser diode at 437 nm, 1 MHz repetition rate and < 200 ps pulse width.29 The emission monochromator was set to 490 nm at a bandwidth of 32 nm. A 450 nm long pass filter in the emission path reduced Rayleigh scatter. The emission polarizer was set to the magic angle of 55o with respect to the excitation polarizer to eliminate polarization effects. Scatter from dilute colloidal silica (LUDOX ) was used to record the instrument temporal response function. Decay data were acquired up to a peak count of 10,000.
3. RESULTS AND DISCUSSION
3.1 Steady-state spectroscopy
The fluorescence emission spectra of pheomelanin, ThT and the two combined are shown in Figure 2. What is immediately apparent from these spectra is the significantly higher ThT fluorescence in fully formed pheomelanin. Given that ThT is a sheet sensing probe this immediately implies evidence for sheets occurring in pheomelanin as was observed previously for eumelanin.21 ThT is a rotor probe because of the nature of its twisted intramolecular charge transfer state whereby its fluorescence is greatly enhanced when constrained into a flattened structure.20,26,30,31
[image:4.595.190.410.492.655.2]
5
[image:5.595.171.424.148.323.2]The increase in the fluorescence intensity as pheomelanin is synthesized, shown in Figure 3, bears all the hallmarks of the sigmoidal trend observed previously during eumelanin synthesis.21The fluorescence is seen to increase rapidly and then level off irrespective of whether or not the fluorescence at 490 nm or the integrated fluorescence intensity over all wavelengths is monitored.
Figure 3. Increase in fluorescence of ThT at 490 nm when excited at 450 nm during pheomelanin synthesis and the increase in integrated fluorescence intensity over the whole fluorescence spectrum. Both curves are normalized.
Both curves of Figure 3 can be described by the function:
I(t) ~ I(0) + / {1 + exp [ -k(t – t0)]} (1)
where I(t) is the fluorescence intensity and I(0) is the initial intensity level, the fluorescence maximum above the background, k the rate of melanin formation and t0 the time where the fluorescence intensity has reached the half
maximum value. Table 1 compares the best fit values to Equation 1 according to the reduced chi-squared (χ2) with that previously reported for ThT and eumelanin. 21 The enzyme tyrosinase reduces the time delay t
0 for pheomelanin sheets to
be formed to half that of eumelanin. The procedure of subtracting intrinsic melanin fluorescence, as done previously for eumelanin,21has not been performed in this case as evidence to be discussed later in this article suggests that ThT and pheomelanin are coupled and their fluorescence is not linearly separable.
Table 1: Values for pheomelanin and ThT obtained from fitting the sigmoidal function of Equation 1 to the normalized fluorescence growth curve of Figure 3 at 490 nm compared to those published previously for ThT and eumelanin.21
Type of melanin I(0) (a.u.) α (a.u.) k (min-1) t0 (min) χ
2
Pheomelanin + ThT (pH neutral) -0.20 1.13 0.06 31.1 0.99
Eumelanin + ThT21 (pH 10.8) -0.06 1.19 0.17 48.6 -
[image:5.595.63.532.547.606.2]6
[image:6.595.184.413.151.315.2]increased exposure to water but this would run contrary to the pheomelanin synthesis which is occurring. The nature of the ThT-pheomelanin interaction warrants further investigation, but such spectral shifts are also a feature of excited charge transfer complexes (exciplexes).32 An exciplex, facilitated by Van der Waal interaction in the ground state due to pheomelanin’s structural similarities to ThT, would not be surprising and further evidence of coupling between ThT and pheomelanin is provided in the discussion of fluorescence decay measurements to follow.
Figure 4. Fluorescence emission spectrum of ThT as pheomelanin is formed. The red shift (~ 6 nm maximum) in the fluorescence provides evidence of coupling between ThT and sheets of pheomelanin as they are formed.
3.2 Fluorescence decay
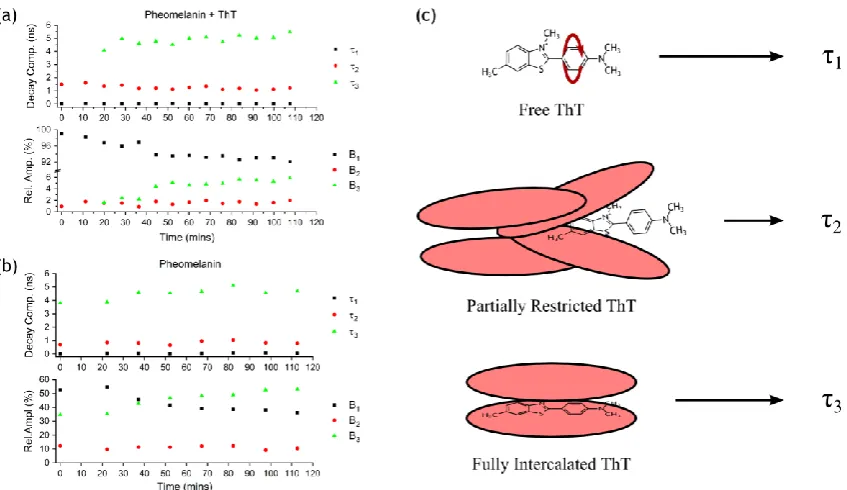
Here we compare and interpret the fluorescence decay F(t) of ThT in pheomelanin at 490 nm with pheomelanin’s intrinsic fluorescence at 490 nm when excited at ~ 450 nm. The results of fitting the decay data to the standard multi-exponential function of Equation 2 are shown in Figure 5a for pheomelanin with ThT and Figure 5b without ThT.
F(t) =
Bi exp (-t/i ) for i = 1,2,3 etc (2)For ThT in pheomelanin before ~ 20 mins there was no improvement in the χ2 by fitting to 3 exponentials as compared to 2 exponentials as the decay is dominated by free ThT in water (τ1 ~ 20 ps, relative amplitude > 97 %). Beyond 20 mins
3-exponentials consistently gave a better description (χ2 1.2). The third component (τ3),increasing up to ~ 5.5 ns, we
associate with the fluorescence increase shown in Figures 2-4. For ThT in Aβ and protein sheets the longest decay component has been observed previously to be ~ 2 ns26,31 and the pure radiative decay time in glycerol solvent to be 3.4 ns.30 Hence the ThT decay component we observe to increase up to ~ 5.5 ns in pheomelanin in Figure 5a must correlate with ~ 5 ns component for pheomelanin intrinsic fluorescence observed in Figure 5b. This provides further evidence of coupling and complex formation between the excited states of melanin and ThT bound in a sheet structure of pheomelanin consistent with the red shift in ThT fluorescence as pheomelanin is formed shown in Figure 4. The slightly higher average ThT-pheomelanin value for <τ3>(4.96 ns), in comparison to that for pheomelanin without ThT (4.72 ns),
also bears testimony to close coupling modifying the radiative rates when ThT is intercalated within sheets. Moreover, the constancy in decay component and relative abundance of τ2after ~ 20 mins in both Figures 5ain the presence of ThT,
and Figure 5b without ThT, and the relative increase in average τ2 value with ThT (<τ2> = 0.86 to 1.26 ns), suggests that
ThT also dominates this component. Given the likely distribution of ThT locations within pheomelanin τ2 may well
originate from sites with less sheet structure. For ThT in eumelanin the abundance B3 of τ3 is higher than in
pheomelanin22 (~ 11% compared to ~ 6%) and this would be consistent with increased sheet formation in eumelanin.33
7
Figure 5. Fluorescence decay parameters as a function of synthesis time for (a) ThT and pheomelanin and (b) pheomelanin. (c) The three fluorescence decay components describe ThT free in solution (1), ThT partially restricted in pheomelanin (2) and ThTtrapped within sheets of pheomelanin (3).
Together τ3 and B3 provide unequivocal evidence that it is not just pheomelanin intrinsic fluorescence which is being
tracked. For example in Figure 5 B3 for pheomelanin rises to ~ 50% but is only ~ 6% when ThT is added. The
interpretation of the origins of the decay components are depicted in Figure 5c in terms of free ThT (τ1), ThT partially
constrained from twisting (τ2) and ThT trapped in pheomelanin sheets (τ3).
3.3 Disassembly studies
In order to learn more about the changes in pheomelanin structures, which are influencing the photophysics of ThT as pheomelanin is synthesized, we have investigated the disassembly of pheomelanin by raising the pH in the manner previously reported for Sepia Officinalis.24 Figure 6 compares the absorption and fluorescence spectra for the pellet formed from centrifuging pheomelanin + ThT before disassembly, after disassembly and the supernatant.
[image:7.595.116.479.531.669.2]8
Following centrifuging, and before disassembly of the pellet, Figure 6(a) shows evidence of ThT present in a weak absorption peaking around 400-450 nm (there is clear evidence of ThT in the supernatant spectrum). However, there is no evidence of ThT in the disassembled structure. Together with the higher energy absorption of the disassembled structure compared to the assembled structure, this suggests that larger structures than those present when disassembled are needed to trap the ThT. In Figure 6b the pellet shows clear evidence of ThT fluorescence peaking at 490 nm, in stark contrast to after disassembly when the spectrum is dominated by Rayleigh scatter and the 530 nm Raman band. The negligible level of the 490 nm peak in the fluorescence further supports the idea that ThT is not trapped in smaller structures as it is in the fully formed pheomelanin. The clear implication is that sheets of oligomers are needed for ThT to be trapped sufficiently in a flat structure for its spectroscopy to be observed. Fluorescence decay measurements support this interpretation. Figure 7 compares the fluorescence decay of the pheomelanin + ThT pellet before and after disassembly. The disassembled sample requires a 4th decay component to describe it in a manner more akin to that required for the intrinsic fluorescence of Sepia Officinalis,35,36 resulting in a quite different decay profile and components to those before disassembly.
Figure 7. Fluorescence decay (red), instrument excitation response (blue), reconvoluted fitted function and weighted residuals (green) before (a) and after (b) disassembly of pheomelanin+ ThT. The best fit values with reference to Equation 2 were (a) τ1 ~
0.05 ns (B1 ~ 88%), τ2 ~ 0.99 ns (B2 ~ 4 %), τ3 ~ 4.64 ns(B3 ~ 8%), χ2 ~ 1.15. (b) τ1 ~ 0.11 ns (B1 ~ 28%), τ2 ~ 1.01 ns (B2 ~ 14%),
τ3 ~ 2.87 ns(B3 ~ 38%), τ4 ~ 6.75 (B4 ~ 20%), χ2 ~ 1.01. The excitation and emission wavelengths were 437 nm and 490 nm
respectively.
Methods of characterizing the structure of pheomelanin and eumelanin are clearly important in improving our fundamental understanding. The use of extrinsic fluorescence probes like ThT, as we describe here, provides important new information on the sub-nanometre structure which can complement information gleaned from other techniques such as atomic force microscopy4, scanning tunneling microscopy17 and small angle scattering.37 Also, in applications requiring the characterization of both eumelanin and pheomelanin, such as the search for alternative methods to excision for melanoma detection, the fluorescence decay of a probe such as ThT might potentially offer a simpler alternative to ultrafast laser methods.5,6,38
ACKNOWLEDGEMENT
[image:8.595.89.501.244.456.2]9
REFERENCES
[1] Pan, T., Li, X., and Jankovic, J., “The association between Parkinson’s disease and melanoma,” Int. J. Cancer 128, 2251-2260 (2011).
[2] Li, J., Zhu, M., Manning-Bog, A.B., Di Monte, D.A., and Fink, A.L., “Dopamine and L-dopa disaggregate amyloid fibrils: implications for Parkinson’s and Alzheimer’s disease,” FASEB J. 18(9), 962-964 (2004).
[3] Ito, S., “A chemist's view of melanogenesis,” Pigment Cell Res. 16, 230-236 (2003).
[4] Clancy, C. M. R. and Simon, J. D., “Ultra organization of eumelanin from Sepia officinalis measured by atomic force microscopy,” Biochem. 40, 13353-13360 (2001).
[5] Teuchner, K., Freyer, W., Leupold, D., Volkmer, A., Birch, D. J. S., Altmeyer, P., Stuker, M. and Hoffmann, K., “Femtosecond two-photon excited fluorescence of melanin,” Photochem. and Photobiol. 70, 146-151 (1999).
[6] Krasieva, T. B., Stringari, C., Liu, F., Sun, C-H., Kong, Y., Balu, M., Meyskens, F. L., Gratton, E. and Tromberg, B. J., “Two-photon excited fluorescence lifetime imaging and spectroscopy of melanins in vitro and in vivo,” J. Biomed. Optics. 18(3), 031107 (2013).
[7] Meredith, P. and Sarna, T., “The physical and chemical properties of eumelanin,” Pigment Cell Res. 19(6), 572-594 (2006).
[8] Ambrico, M., Ambrico, P. F., Ligonzo, T., Cardone, A., Cicco, S. R., Lavizzera, A., Augelli, V. and Farinola, G. M., “Memory-like behavior as a feature of electrical signal transmission in melanin-like bio-polymers,” Appl. Phys. Lett. 100, 253702, 2012.
[9] Guin, T., Cho J. H., Xiang, F., Ellison, C.J. and Grunlan, J.C., “Water-based melanin multilayer thin films with broadband UV absorption,” ACS Macro Lett.4(3), 335-338 (2015).
[10] Chen, C-T., Chuang, C., Cao, J., Ball, V., Ruch, D. and Buehler, M. J., “Excitonic effects from geometric order and disorder explain broadband optical absorption in eumelanin,” Nat. Comm. 5, 3859 (2014).
[11] Assis Oliveira, L. B., Tertius, L. F., Costa Cabral, B. J., Coutinho, K., Canuto, S., “Hydration effects on the electronic properties of eumelanin building blocks,” J. Chem. Phys. 145, 084501 (2016).
[12] Yip, P. and Sutter, J. U., “Tracking the formation of eumelanin from L-Dopa using coupled measurements,” Methods Appl. Fluoresc. 6, 027001 (2018).
[13] Birch, D. J. S. and Sutter, J. U., “The effect of copper on eumelanin photophysics and morphology,” Proc. SPIE 8587, 858705 (2013).
[14] Sutter, J. U. and Birch, D. J. S., “Metal ion influence on eumelanin fluorescence and structure,” Methods Appl. Fluoresc. 2, 024005 (2014).
[15] Li, Y., Liu, J., Wang, Y., Chan, H. W., Wang, L. and Chan, W., “Mass spectrometric and spectrophotometric analyses reveal an alternative structure and a new formation mechanism for melanin,” Anal. Chem. 87, 7958-7963 (2015).
[16] Kim, J. Y., Khetan, A., Wu, W., Chun, S., Viswanathan, V., Whitacre, J. F. and Bettinger, J. C., “Evidence of porphyrin-like structures in natural melanin pigments using electrochemical fingerprinting,” Adv. Mater. 28, 3173-3180 (2016).
[17] Zajac, G. W., Gallas, J. M., Cheng, J., Eisner, M., Moss, S. C. and Alvarado-Swaisgood, A. E., “The fundamental unit of synthetic melanin: a verification by tunneling microscopy of X-ray scattering results,” Biochim. Biophys. Acta. 1199, 271-278 (1994).
[18] Fanyong Y., Xiaodong S., Fanlin Z., Zhangjun B., Yingxia J., Keqing F. and Jie, W., “Fluorescent probes for detecting cysteine,” Methods Appl. Fluoresc. 6, 042001 (2018).
[19] Russell, B.A., Garton, A., Alshammaria, A. S., Birch, D. J. S. and Chen, Y., “Sudlow Site II of Human Serum Albumin remains functional after Gold Nanocluster Encapsulation: a Fluorescence-Based Drug Binding Study of L-Dopa,” Methods Appl. Fluoresc. 6, 035017 (2018).
[20] Benseny-Cases, N., Cócera, M. and Cladera, J., “Conversion of non-fibrillar beta-sheet oligomers into amyloid fibrils in Alzheimer's disease amyloid peptide aggregation,” Biochem. Biophys. Res. Comm. 361, 916 (2007). [21] Sutter, J. U., Bidláková, T., Karolin, J. and Birch, D. J. S., “Eumelanin kinetics and sheet structure,” App. Phys. Letts. 100, 113701 (2012).
10
[24]Ju, K., Kang, J., Chang, J. H. and Lee, J., “Clue to understanding the Janus behavior of eumelanin: investigating the relationship between hierarchical assembly structure of eumelanin and its photophysical properties,” Biomacromolecules 17(9), 2860-2872 (2016).
[25] Rolinski, O. J., Amaro, M. and Birch, D. J. S., “Early detection of amyloid aggregation using intrinsic fluorescence,” Biosensors and Bioelect. 25(10), 2249-2252 (2010).
[26] Freire, S., De Araujo, M. H., Al-Soufi, W. and Novo, M, “Photophysical study of Thioflavin T as fluorescence marker of amyloid fibrils,” Dyes and Pigments 110, 97 (2014).
[27] Birch D.J.S. and Imhof R.E. “Time-domain fluorescence spectroscopy using time-correlated single-photon counting.” Ed. Lakowicz J.R., [Topics in Fluorescence Spectroscopy. Vol.1: Techniques]. Plenum, New York, Ch.1, 1-95 (1991).
[28] Birch, D. J. S., Chen, Y., Rolinski, O. J., “Fluorescence,” Ed. Andrews, D. L., [Photonics Vol 4: Biological and Medical Photonics, Spectroscopy and Microscopy], John Wiley and Sons, New Jersey, Ch.1, 1-58 (2015).
[29] McGuiness, C. D., Sagoo, K., McLoskey D. and Birch, D. J. S. “A new sub-nanosecond LED at 280 nm: application to protein fluorescence,” Meas. Sci. Technol. 15, L19-L22 (2004).
[30] Stsiapura, V. I., Maskevich, A.A., Kuzmitsky, V. A., Uversky, V. N., Kuznetsova, I. M. and Turoverov, K. K., “Thioflavin T as a molecular rotor: Fluorescent properties of thioflavin T in solvents with different viscosity,” J. Phys. Chem. B. 112, 15893 (2008).
[31] Mohanty, J., Choudhury, S. D., Pal, H. and Bhasikuttan, A. C., “Early detection of insulin fibrillation: a fluorescence lifetime assay to probe the pre-fibrillar regime,” Chem. Comm. 48, 2403 (2012).
[32] Birks, J. B., [Photophysics of Aromatic Molecules], Wiley-Interscience, London and New York, 403-491 (1970). [33] Riesz, J., Sarna, T. and Meredith, P., “Radiative relaxation in synthetic pheomelanin,” J. Phys. Chem. B 110, 13985-13990 (2006).
[34] Ozeki, H., Ito, S., Wakamatsu, K. and Thody, A. J. “Spectrophotometric characterization of eumelanin and pheomelanin in hair,” Pigment Cell Res. 9, 265-270 (1996).
[35] Forest, S. E., Lam, W. C., Millar, D. P., Nofsinger, J. B. and Simon, J. D., “A model for the activated energy transfer within eumelanin aggregates,” J. Phys. Chem. B 104, 811-814 (2000).
[36] Birch, D. J. S., Ganesan, A. and Karolin, J., “Metabolic sensing using fluorescence,” Synth. Met. 155, 410–413 (2005).
[37] Cheng, J., Moss, S. C. and Eisner, M., “X-Ray characterization of melanins – II,” Pigment Cell Res. 7, 263–278 (1994).