Maximising wind generation through optimised operation of on-load tap changing
transformers in active distribution networks
Daniel Danzerl
1, Simon Gill
2, Olimpo Anaya-Lara
2 1Wind Energy CDT, Department of Electronic and Electrical Engineering, University of Strathclyde, Glasgow, UK
2Department of Electronic and Electrical Engineering, University of Strathclyde, Glasgow, UK
E-mail: [email protected]
Published inThe Journal of Engineering; Received on 12th October 2017; Accepted on 3rd November 2017
Abstract:On-load tap changing transformers are the most common control device to regulate and maintain distribution network voltage within required limits. Voltage rise issues on the other hand have become a major factor limiting greater penetration of low carbon generators, par-ticularly in weak distribution networks. Here, the voltage rise problem is addressed through the application of optimised set-point voltage technique that aims to improve network hosting capacity to accommodate high wind penetration. It assesses the effectiveness of the technique on a realistic 289-node UK generic 11 kV distribution network using time-series optimal powerflow simulations. The results reveal that when the tap changer is operated at the optimised set-point voltage, it can lead to greater energy yields. It also shows a reduction in the number of tap changing operations when the transformer is operated within the optimised deadband allowing for an improved life-span and minimum main-tenance cost.
1 Introduction
Centralised voltage control methods in distribution networks have traditionally relied on on-load tap changing (OLTC) transformers as the most common control device to regulate and maintain network voltages within required limits [1]. In the UK, the statutory voltage limits are defined in the Electricity Safety, Quality and Continuity (ESQC) Regulations 2002 [2] and it specifies that, low-voltage (LV) customers’be supplied at 400/230 V with tolerance of +10/−6%, whereas high-voltage (HV) customers, at tolerance of ±6%. The OLTC operates by moving their tap positions to select appropriate transformer turns ratio that suits a range of power
flow conditions on the network. To simplify and automate voltage control, automatic voltage control (AVC) relays are used in conjunction with line drop compensation (LDC) equipment. The AVC relay continually monitors the network to detect voltage variation and initiates a tap change command to the motorised OLTC when the voltages are outside the pre-set limits [3].
The AVC relay operation usually incorporates a time delay setting between 10 and 120 s from detecting an out of range voltage and starting a tap-change command. The time-delay setting is to avoid unnecessary tap operation during short-term voltagefluctuations on the network. The LDC is used to compen-sate for voltage drop variations on the line between the transformer and loads situated towards the far end of the feeder
Previous passive operation of the network assumed unidirection-al powerflows and uncontrollable resources from the transmission system into distribution networks at the grid supply points (GSP) [4]. However, recent proliferation of distributed generator (DG) connections renders such assumptions invalid and as such have initiated significant changes to the previous passive methods to an active approach to network management. Operational challenges such as reverse powerflows from the DGs in current active distri-bution systems adversely affect the operation of OLTCs to effi cient-ly regulate and maintain the voltages [5]. Weak distribution networks, particularly, rural networks with poorX/Rcharacteristics,
are highly susceptible to voltage rise problems when various DG resources are connected [6]. Power generations from intermittent re-newable resources such as wind and solar compound the challenge and undermine the performance of the OLTCs to efficiently regulate the voltage. These complexities have rendered conventional OLTC transformers alone, inefficient and unreliable to control the voltage, limiting DG connection capacities on the network.
The paradigm shift towards an intelligent and advanced distribu-tion management systems (DMS) requires sophisticated control strategies that optimise existing network assets. Addressing the voltage rise problem efficiently will require a well-coordinated DMS that can control transformer tap changers, voltage regulators, power plants, compensators, and loads at the primary substation [7]. The advent of active network management (ANM) techniques offers a feasible solution in this direction in developing an efficient,
flexible, and reliable network. It involves real-time monitoring and control of the network and is seen to enhance greater DG connec-tion capacities without reinforcement. Recent ANM schemes and trial projects in the UK have investigated control strategies that address thermal and power flow congestion problems on the network. However, voltage constraint issues are becoming a more complex challenge and one that has not been fully investigated and trailed in current ANM schemes.
In this paper, the voltage rise problem is addressed and mitigated. The study investigates an optimised set-point voltage technique that aims to improve network hosting capacity to accommodate high wind penetration levels. It presents a detailed case-study assessment of the benefits and impact on DG capacities using time-series AC optimal power flow (OPF) simulations. It concludes that, when the OLTC is operated at the optimised set-point voltage, it can lead to greater generation levels.
2 Optimisation problem
Previous work reported by Deckmyn et al. [8] involved an area control strategy of OLTC operation using local network measure-ment. The authors used voltage information of remote measurement
The 6th International Conference on Renewable Power Generation (RPG)
points to determine optimal tap positions that minimises voltage de-viation on the network. This was achieved through heuristic-based optimisation methods which treated the tap changer as discrete vari-ables. A decision-making algorithm is proposed in [9] tofind ad-equate set-point voltage generated through simulations or historical performance to control voltage rise using OLTCs. In [3], the authors discuss voltage regulation using a coordination between OLTC and LDC in medium-voltage feeders to improve DG connection capacities. A similar area-based coordinated control strategy that controls the voltage set-points of the AVC relay at the primary substation have been studied in [6] using time-domain simulations. The authors investigated the dynamic oper-ation and responses of the AVC relays and tap changer mechanism to the system load variations. In [10], the authors discuss an interior point (IP) method based on a non-linear complementarity model for OPF problems with load tap changes. The authors initially treat the tap positions as continuous variables to identify the upper and lower bounds of the transformer using OPF. The complementarity con-straints of the transformer taps are then modelled into the OPF and solved using IP optimisation method.
The proposed control technique in this paper is formulated as an optimisation problem that makes use of mathematical AC OPF ana-lysis tools using time-series simulations. It utilises the standard ACOPF [11,12] formulation at each time-step and treats the tap position as control variables. The optimisation aims to achieve the following system objectives:
† maximise wind generation outputs at minimum cost, † improving network hosting capacity,
† minimise the impact of DGs on voltage profiles,
† minimise the number of OLTC transformer tap operations.
The ACOPF-based problem is modelled as a set of non-linear equations consisting equality and inequality constraints and is given as follows:
Optimise: f(x,u) (1)
Subject to: g(x,u)=0 (2)
h(x,u)≤0 (3)
wherefrepresents the objective function,gthe physics of the power system enforced through the powerflow equations, andhthe par-ameter limits of the system.xrepresents a vector of state variables and it includes the real power generation of the slack busPG(slack), load bus voltages Vi, reactive power generation QGi, and line
thermalflowsSiand can be expressed as:
x=[PG(slack) ViQGiSi] (4)
urepresents the vector of control variables and includes generator real power PGi, generator voltage VGi, and transformer tap
changerTiand can be expressed as:
u=[PGiVGiTi] (5)
To maximise wind generation capacitiesPGi, the objective function ftakes the form in (6):
Maximise
NG
G=1
PGi (6)
The quadratic cost function of the generators is represented as:
min
NG
i=1
ai+bi(PGi)+ci(PGi)2 (7)
whereai,bi, andcirepresent the cost coefficient of active power
outputPGi. The OPF model assigns high cost values to the swing
bus to discourage grid active power imports from the GSP and low cost values to all the DGs to encourage active demands on the network be met by the DGs. The nodal power balance (2) can be expanded as:
PGi−PDi− NG
i=1
ViVjYij
cos (uij−di+dj)=0 (8)
QGi−QDi− NG
i=1
ViVjYij
sin (uij−di+dj)=0 (9)
The parameter constraint limits in (3) is expanded as:
Generator constraints:Generator voltages and real and reactive power outputs are constrained by their upper and lower limits as follows:
VGimin≤VGi≤VGimax (10)
PminGi ≤PGi≤PmaxGi (11)
QminGi ≤QGi≤QmaxGi (12)
Transformer constraints: The OLTC transformer tap settings are bounded as follows:
Timin≤Ti≤Timax (13)
Slack bus constraint:The slack bus voltage is bounded as:
vmins ≤vs≤vmaxs (14)
Security constraints:These include the constraints of voltages at load buses and thermal powerflow limits
Vimin≤Vi≤Vimax (15)
Sij
≤Sijmax (16)
The ACOPF formulation in this paper involves a two-stage opti-misation process that treats the tap positions as discrete and continu-ous control variables similar to the methods discussed in [10]. The initial stage is a discrete method which models the voltage step ratio as discrete variables that can vary between a certain maximumvmaxs
and minimum vmins set-point voltage by afixed step-sizeΔv. The AVC model manually moves up or down by one step sizeΔvat a time and locks the transformer tap position to a pre-determined voltage set-point. Each optimisation cycle requires a physical move-ment of the tap position to the desired set-point, where the voltage is heldfixed at the slack bus to connect the multiple DG schemes. The control logic can be expressed mathematically as:
vs=
vs+Dv if vk−vref ,Dm and vs,vmaxs ;vmins =vmaxs vs if vk−vref,Dm; vmins =vmaxs
vs−Dv if vk−vref .Dm and vs.vmaxs ;vmins =vmaxs
⎧ ⎪ ⎨ ⎪ ⎩ (17)
where vsrepresents the set-point voltage at the slack bus, vk the
represents the AVC relay deadband. The ACOPF discrete model investigates a narrowed deadband that aims to optimise DG capaci-ties within the specified network constraints. Within this narrowed deadband, lies an optimum set-point voltage. In the second stage, the narrowed AVC deadband is modelled into the OPF and treats the transformer tap positions as continuous variables. The continu-ous method assumes a small tap step ratioΔvand models the dis-crete switches as approximated continuous variation of the set-point voltage vs. In this case, the ACOPF can choose optimum set-point values between the narrowed upper maximum limit vmaxs(optimised) and lower minimum limits vmins(optimised) that maxi-mises the objective function at each iteration. This can be repre-sented mathematically as:
vmins(optimised)≤vs(optimised)≤vmaxs(optimised) (18)
3 UK generic distribution test network
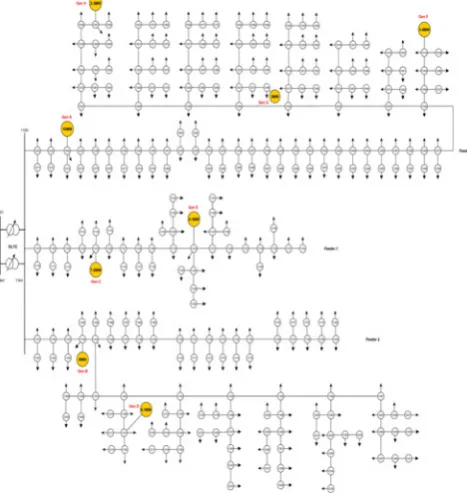
The proposed strategy is applied to a realistic 11 kV UK generic distribution system (UKGDS) to assess its effectiveness. Fig. 1
shows a single-line representation of a 289-node radial distribution network developed in IPSA with full network parameters given in [13]. The model comprises a mix of urban and rural sections con-sisting of underground cables followed by overhead lines charac-terised by varied X/R ratios and medium conductor lengths. The primary substation supplies three 11 kV feeders and is linked to a 33 kV distribution system represented as a source of real and react-ive power. The primary substation is equipped with two identical 33/11 kV OLTC transformers, each rated at 22 MVA connected in parallel to regulate the network voltage to a pre-defined target.
Here, the OLTCs at the 33/11 kV substation controls the second-ary nominal voltage to a reference set-point and has a maximum and minimum tap settings of +4 to−14%, respectively, in 19 steps with a step size of 1.0%. The AVC relay bandwidth is allowed an output voltage deviation of ±3% of the nominal. The secondary bus vol-tages are constrained at current DNO operational limits and allowed to vary within a permissible range of ±3% of the nominal. The medium circuit conductor lengths with varied MVA
ratings are considered as additional thermal constraints on the network. However, thermal limits on the network are deliberately relaxed to enable the voltage limits to operate as binding constraints to control the generators. Half-hourly time-series load profiles are connected on all secondary buses and consists a mixture of residen-tial, industrial, and commercial loads. These are aggregated values scaled from a single load profile (peak loads) provided in [13] with minimum demands set at 25% of the peak load. Fig.2presents a 2-week long snapshot of half-hourly demand data.
The use of historic wind resource time-series, such as normalised output of a nearby wind farm, is used to estimate potential gener-ation. Fig.3shows a 2-week sample of normalised wind generation profile. A suit of eight ‘non-firm’ distributed wind generator (DWG) schemes of varied capacities are connected to the network at nodes 1244, 1144, 1105, 1191, 1120, 1310, 1358, and 1387 and assumed to operate an ANM scheme.
The DWGs are modelled and connected to the network as (P,Q) nodes and operated at unity power factor mode with no voltage control capabilities. The principle of access rule for connecting the multiple generators and sharing of curtailment is via a technical best arrangement. Here, all the DG schemes are assumed to have equal priority and access to the network. In this rule, the OPF engine optimally shares limited network capacity by assigning greater curtailment in order of generator with the most impact on voltage rise constraint. The model is deployed in Matpower [14] where simulation studies are carried over 1 month period at half-hourly resolution consisting a total of 1440 time-steps.
4 Results
To demonstrate and quantify the effectiveness of the proposed strat-egy to mitigate the voltage rise problem,five scenarios for connect-ing the multiple DG schemes have been investigated and are summarised in Table 1. Each scenario configures the set-point
Fig. 1 11 kV radial distribution network (HV_UG_OHb) [13]
Fig. 2 Active demand profile (2 weeks)
[image:3.595.375.488.58.151.2]Fig. 3 Normalised wind profile (2 weeks)
Table 1 Summary of AVC set-point voltages
Scenario % kV p.u.
1 +3 11.33 1.03
2 +2 11.22 1.02
3 +1 11.11 1.01
4 0 11.00 1.00
[image:3.595.374.487.186.277.2] [image:3.595.50.284.505.754.2] [image:3.595.311.550.691.770.2]voltage of the AVC relay to a pre-determinedfixed target value to assess the impact on the DGs and adequacy of the technique to miti-gate the problem. Each scenario provides a quantitative assessment of renewable energy yields and curtailment levels required to main-tain the network limits when the strategies are implemented.
In this study,−2 and−3% set-point voltages are ignored as a result of undervoltage conditions occurring towards the ends of the feeders. The OPF failed to converge due to breach of lower voltage limits at certain time-steps. A sample of the scenarios studied and corresponding simulation results obtained are presented in the following sections.
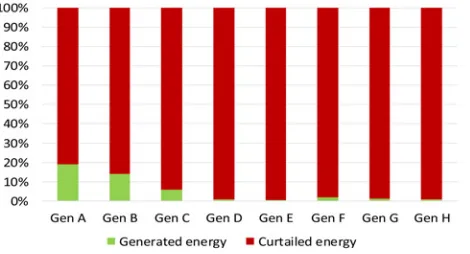
4.1 Scenario 1: set-point voltagefixed at +3% of nominal
This scenario represents a worse-case operation condition of the AVC set-point voltage. In this study, the set-point voltage at the slack bus is raised and held fixed at the upper maximum limit (+3% of nominal) which serves as a reference point to the rest of the secondary bus voltages. The ACOPF reveals poor DG perfor-mances in terms of generation levels (Fig.4) with the biggest size generator Gen A (which is electrically closer to the primary sub-station) generating a maximum capacity of 19%. In comparison to Gen H (which is the smallest size and electrically the most fur-thest away), the generator is observed to be generating∼1% of its rated capacity. All the DGs are observed to experience significant curtailment due to reduced voltage margins and substantial impact on voltage rise constraints from active generations.
4.2 Scenario 3: set-point voltagefixed at +1% of nominal
In this scenario, the set-point voltage is lowered and heldfixed at +1% of the nominal. The ACOPF results show improved generation levels of the DGs with generators A, B, and C operating at maximum installed capacities. Subsequently, the OPF allows an improved access for the rest of the DGs to generate onto the network. Generator H is now observed to be generating up to a maximum of 27% of its rated capacity when compared with scen-ario 1 and is shown in Fig.5
4.3 Scenario 5: set-point voltagefixed at−1% of nominal
Here, the set-point voltage is further lowered to−1% of the nominal voltage. Simulation results presented in Fig.6show a significant improvement in generation capacities, allowing the remotely con-nected generators greater network access and subsequent wind yields. Generator H is now observed to be generating up to a maximum of 36% of its installed capacity.
The total energy realised across the investigated set-point vol-tages are presented in Fig. 7. It is seen that, the total generation across the DG schemes increases by lowering the slack bus set-point voltage. Operating the AVC at high set-set-points significantly reduces generation capacities. For example, at +3% set-point voltage, a total energy yield of 1071 MWh was realised out of 12,851 MWh available energy representing a total generation cap-acity of 8.3% across the DGs. In the case of −1% set point voltage, a total generation of 10,909 MWh was realised out of the total available energy representing an improved generation capacity of 85% across the DG schemes.
Generator performance profile across the investigated set-point voltages are presented in Fig. 8. From here, it is observed that,
Fig. 4 Energy generated and curtailed at +3% set-point voltage
Fig. 5 Energy generated and curtailed at +1% set-point voltage
Fig. 6 Energy generated and curtailed at−1% set-point voltage
Fig. 7 Total energy generation
[image:4.595.313.545.58.185.2] [image:4.595.48.283.59.186.2] [image:4.595.315.536.465.584.2] [image:4.595.310.544.624.752.2] [image:4.595.49.283.627.754.2]the DGs generation capacities decrease as we move further along the feeders and away from the primary substation. Generators located closer to the substation showed greater penetration levels across all voltage set-points when compared with the remotely located DGs. For instance, at +3% set-point, it seen that generators A, B, and C are most favoured with greater network access due to their strong location. Conversely, the rest of the DGs are least favoured (with highly restricted or no access to the network) due to their weak remote location. Comparatively, it is seen that the OPF allows an improved access for all DGs schemes when the slack bus set-point voltages are lowered to levels that reduce their impact on voltage rise constraint.
5 Discussion
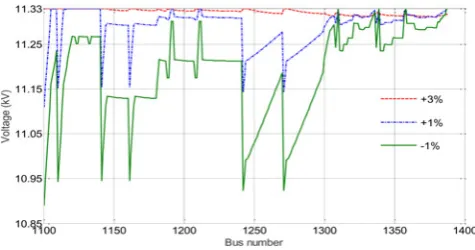
The optimisation engine controls and dictates generation capacities according to DGs active power impact on local voltage rise at their point of connection. Setting the AVC at high-voltage set-points ad-versely limits the network’s headroom capacity to cope with high DG penetration. In effect, active generation from the DGs become highly susceptible to pushing the network’s voltage profiles up to the maximum limits forcing the OPF to heavily curtail genera-tions to levels that satisfy the constraint. In such extreme cases, gen-erators located on the stronger sections of the network (with minimum impact on voltage rise) are allowed access, whereas the remotely connected DGs have no access as seen in Fig. 8. Therefore, to influence fairness and greater connection capacities for all DGs across the various network location points, there is a scope to lower the voltage settings at the slack bus to enhance DG voltage margins and allow greater active generation capabil-ities. By doing this, the voltage profiles and network headroom cap-acity can be improved to accommodate high wind penetration levels. Fig. 9 shows single time-step profiles of maximum bus voltage magnitudes recorded during the optimisation. Here, by comparing the voltage profiles of selected set-point voltages (scen-arios 1, 3, and 5), it seen that operating the AVC at−1% set-point voltage improves the voltage profile and mitigates the voltage rise problem. Voltage profile at −1% showed the least number of points at which the voltage magnitudes reach the upper maximum limits implying reduced curtailments when compared with +3 and +1%. To compare the actions of the tap operation with respect to changes in set-point voltages, the tap positions are treated as con-tinuous variables. A base-case is initially investigated where the slack bus set-point voltage is modelled to vary between the full set of minimum and maximum operational limits
−3%≤vs≤+3%. In this study, the optimised deadband for the OLTC is established at 0%≤vs (optimised)≤ −1%. Fig. 10 (base-case) shows high variation and changes in set-point voltage of the AVC which controls the OLTC indicating a potential increase in the number of tap operation of the OLTC transformer. Conversely, Fig. 11shows a significant reduction in changes in voltage variation when the AVC is operated within the narrowed optimised deadband. This indicates a potential reduction in the
number of tap changing operation of the OLTC transformer, enhan-cing the life-span and reduenhan-cing the cost of maintenance.
6 Conclusion
This paper has presented a constraint optimisation strategy that
con-figures the set-point voltage of OLTC transformers at distribution primary substation. It investigates an optimum set-point voltage control technique of the tap-changer transformer with an overall aim to improve network hosting capacity to accommodate greater wind connections at weak distribution networks. The results obtained demonstrated that, configuring the AVC relays at lower set-point voltage significantly improves the network hosting capaci-ties. By doing so, the DG voltage margins can be improved and their active power impact on the constraint effectively minimised. It also shows that, controlling the transformer within a narrowed optimum deadband effectively reduces the number of tap changing operations allowing for an improved life-span and reduced mainten-ance cost.
7 Acknowledgment
This work was funded by the UK’s Engineering and Physical Science Research Council (EPSRC), project reference number EP/G037728/1.
8 References
[1] Lakervi E., Holmes E.J.:‘Electricity distribution network design’ (2007, 2nd edn.)
[2] Department of Trade and Industry: ‘Guidance on the Electricity Safety, Quality and Continuity regulations 2002’. Rep. Number URN 02/1544, October 2002, pp. 1–47
[3] Viawan F.A., Sannino A., Daalder J.:‘Voltage control with on-load tap changers in medium voltage feeders in presence of distributed generation’,Electr. Power Syst. Res., 2007,77, (10), pp. 1314–1322 [4] Vovos P.N., Kiprakis A.E., Wallace A.R.,ET AL.:‘Centralized and
dis-tributed voltage control: impact on disdis-tributed generation penetra-tion’,IEEE Trans. Power Syst., 2007,22, (1), pp. 476–483
[image:5.595.311.553.58.174.2]Fig. 9 Maximum voltage profile
[image:5.595.311.552.217.331.2]Fig. 10 Changes in set-point voltage at full range
[image:5.595.48.286.629.754.2][5] Kulmala A.:‘Active voltage control in distribution networks includ-ing distributed energy resources’. PhD thesis, 2014
[6] Kulmala A., Mäki K., Repo S., ET AL.: ‘Active voltage level management of distribution networks with distributed generation using on load tap changing transformers’. PowerTech, 2007, pp. 455–460
[7] Strbac G., Jenkins N., Hird M.,ET AL.:‘Integration of operation of em-bedded generation and distribution networks’. Manchester Centre for Electrical Energy, 2002, pp. 1–95
[8] Deckmyn C., Vandoorn T.L., Meersman B.,ET AL.:‘A coordinated voltage control strategy for on-load tap changing transformers with the utilisation of distributed generators’. 2016 IEEE Int. Energy Conf. ENERGYCON 2016, 2016
[9] Xu T., Wade N.S., Davidson E.M.,ET AL.:‘Case-based reasoning for coordinated voltage control on distribution networks’,Electr. Power Syst. Res., 2011,81, (12), pp. 2088–2098
[10] Li B., Bai X., Wei H.:‘An interior point method based on nonlinear complementarity model for OPF problems with load tap changing transformers’. Asia-Pacific Power Energy Eng. Conf. APPEEC, 2010 [11] Carpentier J.:‘Optimal powerflows’,Int. J. Electr. Power Energy
Syst., 1979,1, (1), pp. 3–15
[12] Dommel H., Tinney W.:‘Optimal powerflow solutions’,IEEE Trans. Power Appar. Syst., 1968,PAS-87, (10), pp. 1866–1876
[13] UKGDS:‘UK generic distribution system’, 2015. [Online]. Available athttps://github.com/sedg/ukgds