SEMI-SUPERVISED LEARNING APPROACH FOR CRACK DETECTION
AND IDENTIFICATION IN ADVANCED GAS-COOLED REACTOR
GRAPHITE BRICKS
Craig Berry, Graeme West and Stephen McArthur Electronic and Electrical Engineering
Institute for Energy and Environment Advanced Electrical Systems
University of Strathclyde
[email protected]; [email protected]; [email protected];
Anna Rudge
EDF Energy Nuclear Generation Barnett Way
Gloucester, UK
ABSTRACT
One of the life-limiting components of an Advanced Gas cooled Reactor (AGR) is its graphite core. The bricks present in the core undergo radiolytic oxidation throughout their lifetime which causes graphite weight loss and irradiation which can result in some of the bricks developing cracks. Understanding the nature and extent of brick cracking within the core is key to ensuring continued and extended operation of the AGR fleet. A semi-supervised machine learning classification algorithm is proposed as a method for improving the detection of cracked graphite bricks, by combining the labels derived from infrequent, detailed inspections of the core, with unlabeled, more frequent monitoring measurements taken during refueling operations. Semi-supervised machine learning, which is an emerging field in nuclear power condition monitoring, is the combination of ideas from both supervised and unsupervised machine learning whereby the data that is used to train the algorithm is a combination of labeled and unlabeled data. This paper introduces the initial research that has been undertaken in creating a semi-supervised self-training algorithm to detect the presence of graphite brick cracks and then proceeds to show that there is an improvement in the classification of graphite bricks using a semi-supervised machine learning classifier compared to supervised machine learning classifiers. This improved classification performance is encouraging as it does not require time consuming and costly human analysis to obtain extra learning information from available data.
Key Words: Monitoring, Semi-Supervised Learning, Self-Training
1
INTRODUCTION
cylindrical bricks and irradiated from the inner bore surface (as is found in the graphite cores), this has the effect of building up internal stresses within the bricks, which can lead to cracking. When this turnaround point is reached, the internal stresses within the bricks also changes, which can introduce new cracking mechanisms. Cole-Baker and Reed [2] describe this process in further detail. Understanding these cracking mechanisms, as well as the level of cracking present in the core is key to ensuring safe continued operation of the station. Too many cracks in certain configurations, coupled with a seismic event, could lead to distortions in the core, which could lead to difficulties in fuel and control rod movement.
This paper discusses the initial work completed on detecting cracked graphite bricks from refueling data using a semi-supervised machine learning algorithm. The paper describes how utilizing more frequently available unlabeled data can improve fault detection from new, previously unseen data. The novelty of the work in this paper stems from the investigation of semi-supervised learning techniques as a method to detect the presence of cracks in graphite bricks from refueling monitoring data. The true benefit of semi-supervised learning is the cost and time savings that could occur by making use of unlabeled data. This unlabeled data is currently manually analyzed which is a time consuming process.
2
BACKGROUND INFORMATION
The use of Fuel Grab Load Trace (FGLT) data to provide health information about the state of the graphite core is an ongoing research area. The earliest use of the FGLT data for condition monitoring was the generation of database to store the fuel channel and graphite brick FGLT responses to create a benchmark of normal behavior of the bricks and identifying any anomalous bricks. Simulated anomalous brick FGLT data, such as cracks, were obtained from experimental rig work to provide understanding of how certain crack configurations would manifest themselves in the FGLT response [3][4]. More recent work is ongoing to create a model that explains the relationship of the FGLT data to the bore diameter measurements of fuel channels [5]. The model isolates a component relating to stabilizing brush friction, which in turn is used to estimate the channel bore diameter.
Semi-supervised learning is an emerging concept in the field of fault detection in nuclear power stations, with only two instances being reported in the literature [6][7]. Semi-supervised learning has been shown to be useful to be able to generate a fault diagnostic classification system for a CANDU simulator and nuclear process components facility when there is limited training data available [6]. Initially limited offline data is analyzed and labels are associated to the faults. Then, during online operation, faults are detected and using a graph based semi-supervised clustering model they are provided a label. It was found that although only a limited amount of labeled data with uncertainty was used as training data all faults in the data were correctly diagnosed. Additionally the combination of both supervised and semi-supervised learning has been shown to be used to identify transients in nuclear power station data [7]. Both known and unknown transients are used to train a classifier which identifies further unknown transients. It was shown that this method of applying labels to the unknown transients resulted in an improvement in performance for transient identification compared to previously developed classifiers.
3
MONITORING AND INSPECTION
3.1
Fuel Grab Load Trace Data
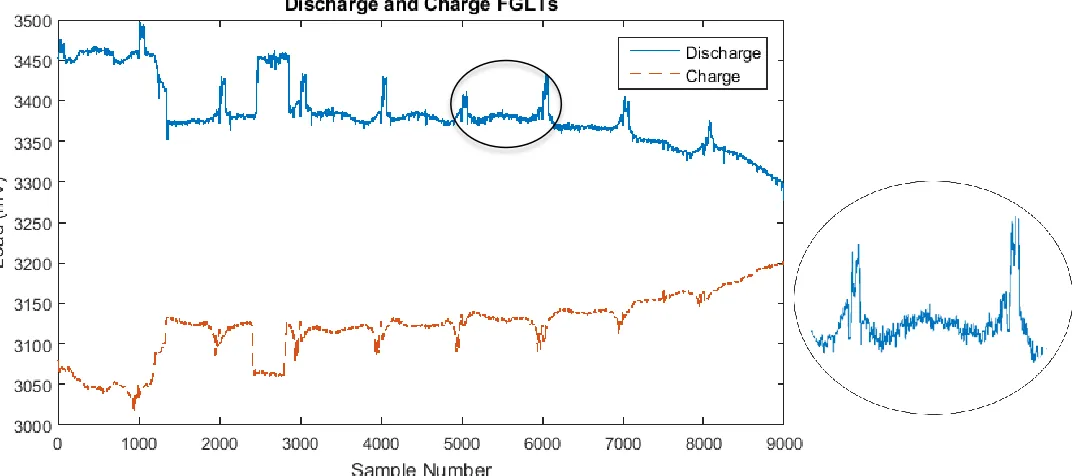
stringer, the frictional component of the set of lower stabilizing brushes being in contact with the channel wall, the frictional component of the upper stabilizing brush being in contact with the refueling guide tube and aerodynamic contributions from the carbon dioxide coolant gas. It is important to note that the load contributions from the fuel stringer deadweight and the aerodynamic will always be a positive contribution to the load value unlike the frictional components which change depending on the direction of motion of the fuel stringer. This results in an increase in load when the fuel channel is narrow in the discharge as it is more difficult to lift the fuel stringer out and a decrease in load in the charge trace as the friction is supporting the weight of the stringer as it is inserted into the core. It can be seen in Figure 1 that there are periodic peaks (in the discharge trace) and troughs (in the charge Trace) in the load value, these are the brick interface points where the channel becomes narrower resulting in increased friction. Additionally contributions from friction can be seen as step changes at sample numbers 1-1100 and 2500-2800 where there is friction introduced be the upper set of stabilizing brushes interacting with restrictions being in the refueling guide tube and the piston seal bore respectively.
3.2
Inspection
Inspections of the graphite bricks occur every 1-3 years during planned, periodic outages. Before
[image:3.612.50.586.298.536.2]These are then reported in the Television Graphite Assessment Panel (TV-GAP) reports with the type of defect found in the graphite and additional information such as description and dimensions of the features. The devices can also be reinserted and maneuvered to obtain better images of defects such as cracks. Once the inspections have been performed the fuel stringers can be reinserted into the fuel channels.
It is important to clarify that during the offload visual and physical inspections it is required to remove the fuel stringers of the respective channels being inspected. Therefore for every inspection that occurs there is a matching set of monitoring FGLT data, meaning that for offload FGLT data a label can be provided to the various layers in the trace indicating if there are cracks present.
4
GRAPHITE BRICK CRACKS
Cracks in AGR graphite bricks can be caused by a number of reasons, some cracks occurred in the years following construction that are not associated with the ageing process in the core. Other cracks developed much later in the lifetime of the reactor due to the stress that is exhibited on the bricks due to weight change caused by irradiation [11]. Cracks occurring in graphite bricks can manifest in numerous ways and detailed categorization of their features are recorded in the TV-GAP reports produced at inspections. However for these cracks to be noticeable in the FGLT there has to be a change in the diameter of the fuel channel which will result in a different frictional response in load than a normal brick. This resulting change in load value in the FGLT varies with the type of crack and the magnitude of the dimensional change that has occurred. An example of a brick trace which has cracks present is shown in Figure 2 where a circumferentially cracked brick and an axially cracked brick have been indicated. The
[image:4.612.102.506.438.666.2]circumferential crack results in the narrowing of the fuel channel which corresponds to a prominent spike in the FGLT trace. However, the presence of the axial crack in Figure 2 is much more subtle and depends upon a number of factors, such as where the crack initiated from, whether it covers the full height of the brick and whether the crack has opened up. Domain expertise of graphite core engineers is key to determining the presence of these types of cracks and has been used to guide the selection of suitable features in the data to be used as inputs to a semi-supervised classifier.
Figure 2. A full FGLT trace containing both an axially cracked brick and a circumferentially cracked brick which have been indicated.
Circumferential Crack
5
SEMI-SUPERVISED LEARNING
Semi-supervised learning is a machine learning technique which combines principles from both supervised and unsupervised machine learning methods. Typical supervised learning for classification is the default machine learning method, where a relationship between input and output data is explored through learning examples with a supply of ground truth training data. Unsupervised learning is focused on determining the underlying patterns and distributions of data with no information about the outputs [7]. Examples of unsupervised learning include clustering data into similar groupings, identifying anomalous data sample or reducing the dimensionality of data while retaining its characteristics. Semi-supervised learning combines both aspects of Semi-supervised and unSemi-supervised learning by using both labeled data (input data with ground truth value) and unlabeled data (only input data) to improve performance than just using either labeled or unlabeled data in isolation. This can be seen as supervised learning that uses the statistical properties of all data to construct a classifier or unsupervised learning that assigns meaning to patterns or groupings based on known data [7].
Semi-supervised learning is often applied to many problems where there is a disparity between the amount of labeled data and unlabeled data. This often occurs due to the abundance of sensors recording operational data and as a result it is costly to provide labels to that data. In the case considered here detailed inspections to understand the health of the graphite can only be performed when the reactor is offline and only on a select number of fuel channels in parallel FGLT data is obtained from these channels. FGLT data is also produced at scheduled refueling events, while the reactor is operating at reduced capacity, on a more frequent basis but contains no corresponding ground truth information to apply to this data. Overall, the number of online refueling events greatly outnumbers the number of offline events which have associated labels
.
5.1
Feature Extraction
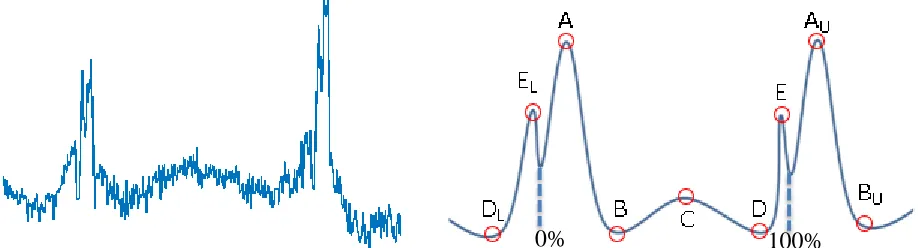
Initially the features that have been chosen as inputs to the classifier were the base calculations which are obtained from the M/W point features [4]. The M/W point features shown on stylized discharge brick trace which can be seen in Figure 2. They are named after the general shape of a single brick in the FGLT, where a single brick can either be simplified to 5 points that look similar to the letters “M” and “W”. The points are calculated from different regions of the bricks with how their values are obtained shown in Table 1 where 0-100% indicates a relative location from the bottom of the brick to the top of the brick or left to right in the FGLT as indicated in Figure 3. These values were chosen to be able to obtain the key shape of the response of a single graphite brick in the trace. The base calculations then develop this further by performing operations on the bricks and their neighbors. These operations were originally chosen by graphite core engineers as a guideline to detect abnormal bricks and the calculations to obtain them can be seen in Table 2 where the subscripts to the M/W points are indicating if they are obtained from the neighboring bricks specifically the upper or lower bricks indicated by U and L respectively. Additional features that were in included were the difference between the current bricks average load and the average load of the neighboring bricks, both upper and lower. The last feature was the difference in load of the height of the highest peak in the middle 20-80% of the brick layer and the average load over that same region.
[image:5.612.87.546.608.732.2]0%
100%
Table 1. Calculations to obtain W point features for a single brick from a discharge trace [4]
Table 2. Basic calculations for feature selection obtained from W point data for discharge trace [4]
5.2
Self-Training
The self-training algorithm [12] is the simplest form of semi-supervised learning. Self-training is a wrapper algorithm which means that any base classifier can be used provided the base classifier can assign a confidence score of predicted data. The self-training algorithm can be seen in Figure 4.
A
The maximum load value between 0-10% of the brick
B
The minimum load value between 10-25% of the brick
C
The maximum load value between 25-75% of the brick
D
The minimum load value between 75-90% of the brick
E
The maximum load value between 90-100% of the brick
BC1
Height of the upper brick interface peak for the previous brick layer (E
L-D
L)
BC2
Difference between the upper brick interface for the previous brick layer and the lower
brick interface for the current layer (A-EL)
BC3
Height of the lower brick interface peak for the current layer (A-B)
BC4
Difference in the peak base heights between the upper brick interface for the previous brick layer and the lower brick interface for the current brick layer(B-D
L)
BC5
Difference in the peak base heights between the upper brick interface for the current brick layer and the lower brick interface for the next brick layer(D-B
U)
BC6
Difference in the upper brick interface peak for the current brick layer(E-D)
BC7
Difference between the upper brick interface for the current brick layer and the lower brick interface for the next brick layer(E-A
U)
BC8
Height of the lower brick interface peak for the next brick later(A
U-B
U)
BC9
The difference between the mean load value of 45-55% and mean load value of 20-80% of the brickClassification Confidence Classifier
Unlabeled Data
Labeled Data
Semi-Supervised
Classifier
[image:6.612.99.545.493.657.2]Self-training initially involves splitting the available dataset into labeled and unlabeled instances of data and deciding which base classifier to implement. The labeled data is then used to train the base classifier. Once the classifier has been trained the unlabeled data is supplied to it to be classified. A subset of the highest confidence data instances is then provided with labels from the classifier. The newly labeled data instances are then removed from the unlabeled group and added to the labeled group. This process is then repeated by training new classifiers and to apply labels to more unlabeled data until defined criteria is met such as all the unlabeled data eventually being provided a label. Once the criterion is met a final classifier is trained which is then use to classify future data.
Self-training has been implemented using two base classifiers; these were an Artificial Neural Network (ANN) and a linear Support Vector Machine (SVM). The confidence scores that were used for the ANN were the output scores of the network. These indicate the likelihood of the output being correct based on their training and vary between 0-1 with 1 being strong confidence in the classification. Therefore, data that has an output that exceeds the defined threshold of 0.9 can be assumed to be classified correctly to be applied a label. Similarly the confidence score for the SVM is the distance that the unlabeled data is on either side of the separating hyperplane. The hyperplane is the boundary generated in the feature space that is used to separate the different classes. The further the sample is away from the hyperplane the more likely that it has been classified correctly. Therefore the furthest away 10% of the data from the hyperplane are chosen to be labeled.
6
RESULTS
6.1
Available Data
The data that is available and used to train the self-training algorithm is from roughly a decade of inspection and monitoring data from a single reactor. Of this data each brick layer is considered on an independent basis. Some layers are not able to be resolved with the M/W features such as some of which can be seen in Figure 1 particularly brick layer 4 and 5. In this example the brick layer was chosen which contained the largest amount of cracks on a single layer. The layer that was chosen contained 58 instances of inspection data which can be paired with associated FGLT data to extract the previously mentioned features. Additionally there are a further 71 instances of inspection data that can be used as training data. These are obtained from channels which have had inspections and FGLT monitoring data but not at the same time. When the monitoring data occurs prior to the inspection data only uncracked bricks can be included as training data as it is known that they were also uncracked in the past. Similarly only cracked bricks can be used when monitoring data is obtained after the inspection data as there is no guarantee that the uncracked bricks have not cracked in the time between inspection and monitoring. Lastly there are 216 unlabeled traces which do not have any associated inspection data. This large discrepancy in available labeled data was a drive to use semi-supervised learning as the labeled data on its own is not sufficient enough data to obtain a true relationship.
6.2
Implementation
Figure 5. Performance results for semi-supervised self-training ANN compared to supervised ANN with varying amounts of labelled training data used
[image:8.612.86.521.446.679.2]It can be seen that there is an improvement in classification performance accuracy when using unlabeled data as compared to using only labeled data for ANN however overall the performance is not yet sufficient to be fully reliant on this method of identifying the cracked bricks. Conversely the self-trained SVM does not show much of an improvement over the supervised SVM. This occurs as continually choosing the most confident data results in labeled instances which are very far from the other classification in the feature space and often they will not be used in generating the future separating hyperplane boundaries. However it is worth noting that the self-trained ANNs performed the best out of all learning methods tested and is an improvement compared to basic supervised machine learning.
It was hypothesized that when enough training data was used the performance of the supervised learning method should converge to the same performance as semi-supervised learning. This should occur as when the feature space becomes saturated with training examples no new trained data is from areas of the feature space that is unknown and therefore the current solution cannot be improved. From this choice of features for the data there appears to be valuable information that can be obtained from unlabeled data as there is still an increase in performance when all available labeled training data is used. Therefore for this particular application there is still information to be learned about the classification of cracks that cannot be obtained from the currently available data. This means that until a suitable amount of future inspections have taken place, unlabeled data is a viable solution compared to purely labeled inspection data.
7
FURTHER WORK
The initial results show an increase in the performance of brick classification with the inclusion of combining unlabeled training data with labeled training data compared to training on only labeled data for ANNs. However the performance in these initial tests is not reliable enough to be fully relied on practical industrial usage. This could occur due to the features that have been chosen to train the algorithm. The features that have been chosen to characterize the shape of the brick do not allow for sufficient separation of the classes in the feature space. This means that the current features will always experience a tradeoff between false positives or undetected cracks. Possible solutions to this problem are to:
Investigate different features in the FGLT that better represent all types of cracks in the graphite bricks
Transform the current features to improve their separation in the feature space Use multiple classifiers that are used to detect individual different types of cracks
Another improvement that should be made in the future is being able to train the algorithms from more than one layer in the core or from other reactors of similar design. This has the benefit of providing both unlabeled and labeled additional data.
8
CONCLUSIONS
9
ACKNOWLEDGMENTS
The authors would like to thank EDF Energy for supporting this work.
10
REFERENCES
1. J.E. Brocklehurst, B.T. Kelly, “Analysis of the dimensional changes and structural changes in polycrystaline graphite under fast neutron irradiation”, Carbon, Vol 31, pp.155-178 (1993).
2. C.J. Jones, “Predicting the Stresses and Deormations of Irradiated Graphite Moderator Bricks”, Management of Aging Processes in Graphite Reactor Cores, Cardiff, 28th-30th November 2006, Vol 1, pp. 167-174.
3. G.M. West, G.J. Jahn, S. D. J. McArthur, J.R. McDonald, J. Reed, “Data mining reactor fuel grab load trace data to support nuclear core condition monitoring”, IEEE Transactions on Nuclear Science, Vol. 53, pp.1494-1503 (2006).
4. G.M. West, S.D.J. McArthur, & D. Towle, “BETA A System for Automated Intelligent Analysis of Fuel Grab Load Trace Data for Graphite Core Condition Monitoring”, Securing the Safe Performance of Graphite Reactor Core, Nottingham, 24th
-26th November 2008, Vol 1, pp 79-87.
5. C. Berry, D. Pattison, G.M. West, S.D.J. McArthur, A. Rudge, “Estimating Fuel Channel Bore from Fuel Grab Load Trace Data”, 5th EDF Energy Generation Ltd Nuclear Graphite Conference, Southhampton, 10th
-12th May 2016.
6. J. Ma, J. Jiang, “Semisupervised Classification for Fault Diagnosis in Nuclear Power Plants”, Nuclear engineering and Technology, Vol. 47, pp.176-186 (2014).
7. K. Moshkbar-Bakhshayesh, M.B. Ghofrani, “Combining Supervised and Semi-Supervised Learning in the Design of a New Identifier for NPPs Transients”, IEEE Transactions of Nuclear Science, Vol. 63, pp.1882-1888 (2016).
8. G.M. West, G.J. Jahn, S. D. J. McArthur, J.R. McDonald, J. Reed, “Graphite Core Condition Monitoring through Intelligent Analysis of Fuel Grab Load Trace Data”, Management of Aging Processes in Graphite Reactor Cores, Cardiff, 28th
-30th November 2006, Vol 1 pp. 232-239
9. C.E. Watson, P.C. Robinson., P.R Maul, “The Role of Data Visualisation in Core Inspection Decision Making”, Modelling and Measuring Reactor Core Graphite Properties and Performance,
Birmingham, 31st October - 3rd November 2011, Vol 1, pp. 149-157.
10. A. Cole-Baker, J. Reed, Measurement of AGR Graphite Fuel Brick Shrinkage and Channel
Distortion, Management of Aging Processes in Graphite Reactor Cores, Cardiff, 28th-30th November 2006, Vol 1, pp. 201-208.
11. P.R. Maul, P.R. Robinson, A.G. Steer, “Understanding AGR Graphite Brick Cracking Using Physical Understanding and Statistical Modelling”, Securing the Safe Performance of Graphite Reactor Cores, Nottingham, 24th-26th November 2008, Vol 1, pp103-110.

![Table 1. Calculations to obtain W point features for a single brick from a discharge trace [4]](https://thumb-us.123doks.com/thumbv2/123dok_us/1432728.95806/6.612.99.545.493.657/table-calculations-obtain-point-features-single-brick-discharge.webp)

