R E S E A R C H A R T I C L E
Open Access
Development and impact of the Iranian hospital
performance measurement program
Asgar Aghaei Hashjin
1,2*, Dionne S Kringos
1, Jila Manoochehri
3, Aidin Aryankhesal
2and Niek S Klazinga
1Abstract
Background:Iran developed a national hospital performance measurement program (HPMP) which has been implemented annually throughout its hospitals since 1997. However, little is known yet about its development and the impact of the program on hospital performance.
This study aims to describe the development and process of implementation of the HPMP, and to explore the impact on hospital performance by looking at the trends of performance scores of all different types of Iranian hospitals. Methods:This was a mixed method study consisting of longitudinal data and qualitative document analysis. Hospital performance data over the period of 2002 to 2008 was analysed.
Results:Iran instituted a comprehensive HPMP and implemented it in all hospitals since 1997. The program followed a phased development to stimulate performance and quality improvement in hospitals. Overall, the program has had a positive impact on the performance of general and specialized hospitals. The performance of general hospitals did not appear to be associated with their size or affiliated university ranking. However, the rate of performance improvement of general teaching and private hospitals was significantly lower than the average improvement rate of all general hospitals. There was no relationship between teaching status of the specialized hospitals and their level of performance. However, the performance of the governmental specialized hospitals showed a substantial decline over time. Moreover, among specialized hospitals, the bigger sized and those affiliated with higher ranked universities, reported better performance. Conclusions:Overall, the development and implementation of an obligatory HPMP in Iran has improved the level of performance in general and specialized hospitals. However, there is room for further performance improvement especially in the general teaching, private, and governmental specialized hospitals. Reconsidering the ownership type, funding mechanisms and responsibility for the HPMP may have an impact on the absolute level of performance and improvement capacity of hospitals. In addition, the role and composition of survey teams, mechanism of
implementation according to the characteristics of hospitals, and updating standards are important factors to promote performance improvement and hospital accreditation requirements.
Keywords:Hospital performance, Performance measurement, Accreditation, External evaluation, Quality assurance, Quality improvement, Iran
Background
Performance and quality improvement (QI) of hospitals has become an intrinsic target of health care systems. Nowadays most health care managers and policy makers are trying to find mechanisms to measure performance and improve quality in health care [1,2]. Access to health
care organizations’performance and quality information is now considered as an absolute right for communities and patients because they could be better informed for making choices between health care facilities and pro-viders [3]. Performance measurement (PM) is a key con-cept of QI initiatives; which provides information on the level of achievement of quality improvement targets and facilitates the identification of opportunities for improve-ment [4-6]. Various studies e.g. [7-12] have reported that PM causes improvements in health care performance; such as quality of care, efficiency and accountability in * Correspondence:[email protected]
1
Department of Public Health, Academic Medical Center (AMC)/University of Amsterdam, Postbox: 22660, 1100 DD Amsterdam, The Netherlands
2
Department of Health Services Management, School of Health Management and Information Sciences, Iran University of Medical Sciences, Tehran, Iran Full list of author information is available at the end of the article
different sectors of health systems. Hospital PM usually focuses on the level of achievement of specific func-tional, clinical and administrative targets. It provides information to compare hospital’s commitment with the original targets, standards or expectations which can facilitate the identification of possible opportunities for improvement in different dimensions [4,13-17].
Considering the important role of PM in the health sec-tor and the increasing interest in development and expan-sion of PM especially in hospitals, health care systems around the world have invested in measuring and report-ing hospital performance data in recent years [18,19]. As a result, considerable resources are spent on performance and quality measurement and reports which make them as influential tools for policy makers [4,20,21]. For example, at international level the World Health Organization (WHO)–among others–reports the results of health systems PM globally [22]. At national level, most re-cently in 2012, the US government established a bonus and penalty system for hospitals which links the pay-ments to the level of performance and quality of care provided to patients [23].
In response to the worldwide interest and increasing de-mands for PM, the Iranian Ministry of Health and Medical Education (MOHME) instituted in 1997 an evaluation system for measuring performance of hospitals and im-proving their quality. The so-called “Hospital Evaluation Program”will be referred to in this paper as“Hospital
Per-formance Measurement Program”(HPMP). The MOHME
measures the performance of all hospitals at least once a year by grading them on a six point scale according to their performance scores. The government obliged all hos-pitals by statutory to undergo the HPMP. The results are linked to the financial mechanisms through a pay for per-formance (P4P) and perper-formance-based budgeting system [12]. Therefore, the PM has a substantial impact on budget allocation and payments to the hospitals.
Although the Iranian HPMP is one of the first, most comprehensive [20] and unique evaluation programs in the world, little is known about its the development, cedures of implementation phases and impact of the pro-gram on the performance of hospitals [24]. Hence in this paper we aim to describe the development and current implementation procedures of the Iranian HPM program, and to explore its impact on the performance of Iranian hospitals by answering the following three questions:
1. How was the HPMP developed and implemented across the Iranian hospitals?
2. What is the trend of Iranian hospitals’performance results, as assessed through the performance scores, over the period of 2002 to 2008?
3. Is there any association between the type of ownership, teaching status, hospital size or rank of
the medical university (to which hospitals are affiliated) of the general (non) teaching and specialized hospitals and the hospitals’performance scores over the period of 2002 to 2008?
Methods
We performed a mixed qualitative and quantitative study, consisting of a descriptive analysis of the implementation of the HPM program, and a quantitative comparative ana-lysis of hospital performance data over the period of 2002 to 2008. The descriptive data for this study were collected from accessible official documents of the MOHME issued between 1997 and 2010, medical universities’ websites, and a PhD thesis [12,25-27]. Professional experiences of the authors as health services researcher and hospital manager were also included. The descriptive data were first verified by experts who were hospital administrators, quality improvement managers and hospital evaluation implementers. The information then was translated from Persian (Farsi) into English by the authors who were ex-perts in health services research and health care manage-ment. Finally, the data were checked by five experts who were qualified in both the English language and hospitals affairs. This group controlled the quality of content and translation. The first author was involved in all of the aforementioned steps.
We analysed the results of specific performance scores of the hospitals to assess the impact of the program using a linear mixed-effects model. The performance scores were measured using the HPM instrument as de-veloped by the Iranian MOHME covering performance, facility and functional domains of quality of care (e.g. safety, patient-centeredness), equipment, manpower, and buildings. Figure 1 shows the flow chart of the process of a typical hospital evaluation and grading (scoring) in the Iranian health care system.
We made a distinction between multi-specialty and single-specialty hospitals, which we will call general and specialized hospitals respectively in this paper. On aver-age, the performance of 553 general and 143 specialized hospitals were analysed per year over the period of 2002 to 2008 in this study. Different scoring mechanisms in combination with different bonus scores were applied for general teaching and general non-teaching hospitals over the study period. As a result, we studied the performance scores in two different time periods; firstly from 2002 to 2005 and secondly from 2006 to 2008 for both general teaching and general non-teaching hospi-tals. The most important change for general hospitals took place in 2006 by adding quality indicators to the PM domains, increasing the maximum number of scores which a hospital could achieve with 867. In contrast, a single analysis could be conducted for specialized hospi-tals for the whole period from 2002 to 2008, due to an
absence of critical changes in the scoring/bonus system. The variation (improvement/decline) in performance of specific hospitals from the average performance scores in the reference years (2002 for period 1 and 2006 for period 2) and the average rate of changes in the next years over the study time period were analysed in the
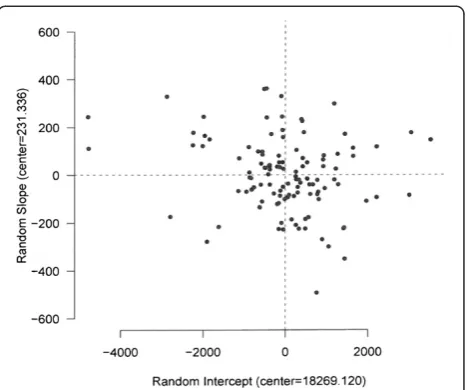
[image:3.595.58.538.90.570.2]model. The model was used to evaluate (graphically) whether hospitals’ performance level (through repeated measurement) changed over the period. In this study, the baseline average performance score in the reference years (intercept) and the mean change (slope) over the period are the fixed effects of the model (which make Figure 1The flow chart of the process of a typical hospital evaluation & grading in Iranian Healthcare System, adapted from
the center of the effects graph). The random effect is the variability of hospitals from the baseline intercept and slope, which is normally distributed with zero-mean and standard deviation σ. Based on this variability, which allows the hospitals to differ randomly in intercept and slope from the baseline intercept and slope, the hospitals are located in four quadrants in the figure of the effects (see Figure 2).
The quantitative database of hospital performance scores (including grades) over the period of 2002 to 2008 were obtained from the MOHME [28]. We completed the MOHME dataset for our study purposes by including data from two different sources. We included general hospital performance scoring data for the year 2008 from internal reports of the MOHME [29]. The data included the scores of 575 general hospitals affiliated with 37 medical univer-sities across the country in 2008 [30]. The detailed performance scores data were not openly available. We obtained these data from the Department of Evaluation and Supervision of Medical Centers in the MOHME upon the official request provided by the Iran University of Medical Sciences (IUMS). To examine the impact of the national ranking of the medical university on hospitals’ performance, we retrieved the latest Iranian medical universities’ ranking from the openly available report by Mehr (national) News Agency [31].
We followed the RATS guidelines for the qualitative components of the study to ensure all relevant informa-tion was included in the manuscript.
The study was approved by the Deputy of Research and Technology of the Iran University of Medical Sciences (Code: 958/1635996). There was no need to obtain informed consent for this study.
Results
Hospital performance measurement in Iran
The PM program is a regulatory instrument for quality improvement and quality assurance, and to increase public accountability and informed decision making in hospitals in Iran. The medical universities provide the instructions for PM and standards to all affiliated hos-pitals in their region, and are responsible for the on-site PM. The program is conducted in a specific period determined by the medical universities in all provinces across the country.
Each medical university has a PM team responsible for conducting evaluations in the affiliated hospitals within a certain province. The teams are composed of at least 10 persons, including at least 2 different medical special-ists (internal medicine, general surgery, paediatrics, gy-naecology, or anaesthesiology), a radiologist, a clinical technician (preferably a doctor of laboratory sciences or pathologist), an experienced nurse, a medical equipment expert, an inspector for building and construction, an
administrative and personnel issues expert, a finance and budgeting expert and a coordinator who is representative of Vice-chancellor for Treatment of the university. Other persons could be included in the team if necessary. Every evaluation team can evaluate at most two hospitals per working week.
According to the regulations, hospital emergency de-partments (ED) and Critical Domains (CD) are evaluated first and only the rest of the hospital would be evaluated if the ED and CD are awarded at least grade 3. If a hos-pital does not acquire the necessary scores for its ED and CD, it should improve the situation to the standard level within three months (see Figure 1). In the re-evaluation, if the ED acquires the minimum level of standard, the rest of the hospital will be evaluated. The total hospital grade cannot be better than the awarded grade to the ED which includes 8% of the overall hos-pital assessment scores [32]. Two different instruments were used for PM of general and specialized hospitals, as described in the next two sections.
Performance measurement of general hospitals
[image:4.595.306.540.87.282.2]The PM instrument for the general teaching and general non-teaching hospitals includes 15 domains with 1027
Figure 2A linear mixed-effects model for the general teaching hospitals.The analysis of general teaching hospitals’performance is shown in Figure 1 (as an example) for the period of 2002 to 2005. The hospitals that are located in the first quadrant (top right), have a higher performance above the average at the baseline. They increased their performance with a higher rate than the average. Quadrant II (top left) represents the hospitals in which their performance was lower than the average performance in the reference year, but the average rate of increase was higher than the overall average. Quadrant III (bottom left) represents the hospitals in which their average performance and the rate of increase both were lower than the overall averages in the reference year. The hospitals in the fourth quadrant (bottom right) showed a higher performance and lower rate of increase than the overall averages.
detailed questions. For each question within a specific domain, a maximum number of scores could be obtained by a hospital. The maximum achievable score for the gen-eral teaching and gengen-eral non-teaching hospitals is 24,667 and 23,667 respectively. The total score for these hospitals can result in one of six grading levels including‘excellent 1’,‘1’,‘2’,‘3’,‘4 or sub-standard’, and‘5 or to be shut down’,
based on the hospitals’ degree of compliance with the
specified standards of evaluation domains (see Table 1). In 2002, the MOHME introduced a new domain to the HPMP, with the introduction of nine quality indicators (see Table 2). The new quality indicators domain was introduced with the aim to further improve the quality of care, produce information for decision making, and in-crease regulation and accountability. The first three indi-cators were related to the emergency department (ED) with an overall score of 72 (titled ED quality indicators). The remaining six indicators provide the opportunity to assess quality of care in the inpatient services and other sections of hospitals as“general quality indicators”.
In 2006, the MOHME improved the HPMP by re-considering the quality domains; five domains were determined as critical domains (CDs) in the program (as indicated in Table 1A by the first five rows in bold). Obtaining acceptable scores for each of these five domains is a prerequisite for the final evaluation, thus each hospital must acquire a minimum score in any of these domains. In addition, getting an evaluation grade in each grading level requires getting minimum acceptable scores for all of the five domains at that specific level [25].
According to the regulations, hospital EDs are evalu-ated first. Only when an ED is awarded at least the mini-mum acceptable score (grade 3), the rest of the hospital is evaluated. According to the regulations, the total hos-pital grade cannot be better than the awarded grade to the ED which includes 8% of the overall hospital evalu-ation scores.
Performance measurement of specialized hospitals
The performance measurement instrument for the specialized hospitals has 32 domains including 213 ques-tions with related scores for each question which makes the possible maximum: 5688. The total awarded scores for this group of hospitals can result in only four grades
including “grade 1”, “2”, “3” and “4 or sub-standard”
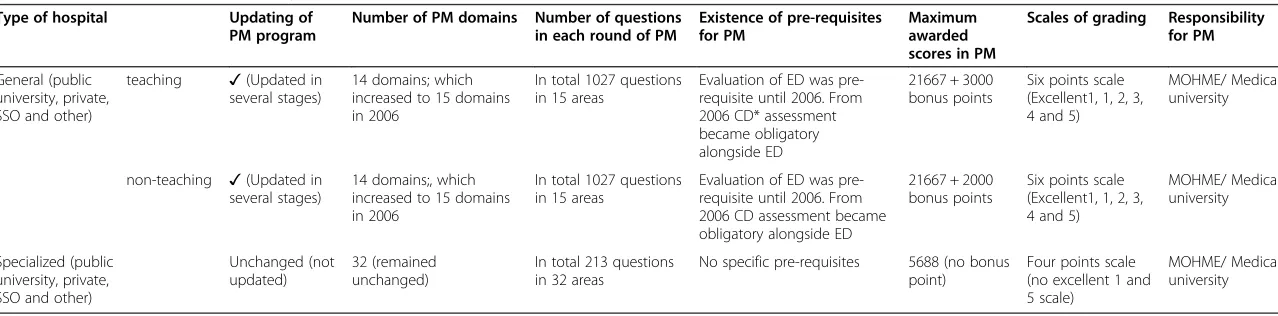
(Table 3). The process remained unchanged from the official introduction in 1997. The key characteristics of the HPMP in the general and specialized hospitals are shown in Table 4.
The impact of the Iranian hospital performance measurement program
The Iranian HPM program has a direct impact on all hospitals across the country by grading them based on
the achieved scores every year. The payments and specific services delivery charges (e.g. patient stay) to the hospitals are defined based on the results of the performance measurement. Hospitals with a better grade (or performance score) are allowed to charge a higher patient stay price. For example hospitals with grade 1 can charge 100% of the patient stay charge per day, while the grade 3 hospitals can charge only 60% of the charges [33].
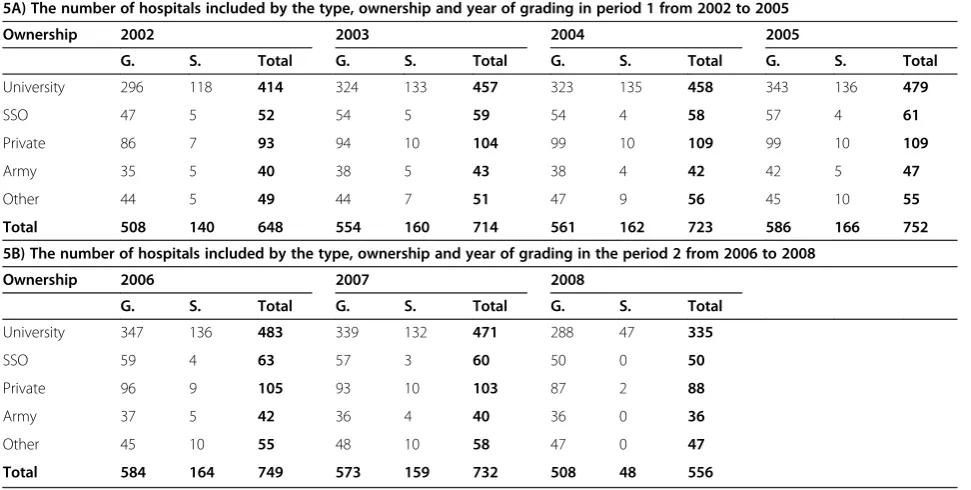
To explore the impact of the PM program in hospitals, we analysed the trend of performance over the period of 2002 to 2008 by looking at the hospital performance scores. The statistics of hospitals included in the analysis per year are shown in Table 5.
Among the studied hospitals; 64% were (university) gov-ernmental, 8% SSO, 15% private for profit, 6% army, and the remaining 7% belonged to the other organizations.
Table 6 summarises the results of linear mixed-effects model analysis of the general and specialized hospitals' performance scores.
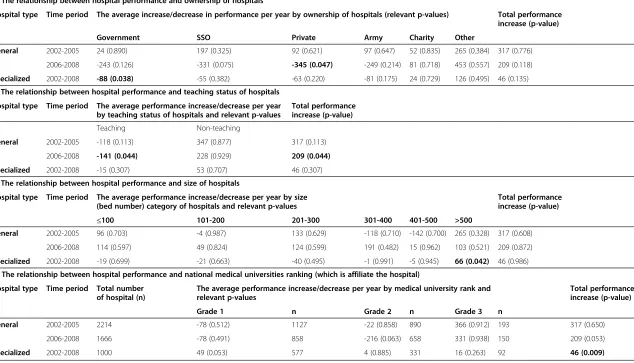
The relationship between the level of performance and characteristics of general and specialized hospitals The relationship between the level of performance and characteristics of hospitals including the type of owner-ship, teaching status, size and national rank of affiliated universities is shown in Table 7. The results show that the performance improvement of general teaching and private hospitals was significantly slower than that of all general hospitals. The performance of the governmental special-ized hospitals showed a substantial decline over time. The bigger specialized hospitals (>500 bed) showed signifi-cantly faster performance improvement than smaller specialized hospitals. Moreover, the specialized hospitals which were affiliated with the high-ranked universities (such as Tehran, Shiraz and Isfahan) showed a higher per-formance than specialized hospitals affiliated with lower-ranked universities (such as Ilam, Ghom and Kurdistan).
Discussion
Table 1 A) The domains, allocated scores, relevant grades, and B) minimum score requirement for getting specific grade for the general hospitals, [12,24-27,32]
1A
Domain Grade*
Excellent1 1 2 3
4 (sub-standard)
1 Emergency department (ED) 1800 1348-1799 899-1347 449-898 Under 448
2 Sanitation & cleanness 800 741-799 691-740 640-690 Under 640
3 Medical records & informatics 1000 861-999 731-860 600-730 Under 600
4 Hospital committees 1000 861-999 731-860 600-730 Under 600
5 - General quality indicators 795 596-794 397-595 198-396 Under 198
- ED quality indicators 72 54-71 36-53 18-35 Under 18
6 Consideration of values & Religious regulations 2000 1801-1999 1601-1800 1400-1600 Under 1400
7 Patient satisfaction 1000 861-999 731-860 600-730 Under 600
8 Medical & professional staff 3600 3121-3599 2641-3120 2160-2640 Under 2160
9 Nursing staff 1600 1361-1599 1121-1360 880-1120 Under 880
10 Other staff 1200 1021-1199 851-1020 680-850 Under 680
11 Management 1600 1301-1599 1001-1300 700-1000 Under 700
12 Safety equipment 600 561-599 521-560 480-520 Under 480
13 Non-medical equipment 800 661-799 531-660 400-530 Under 400
14 Medical equipment & medicine 1800 1591-1799 1291-1590 990-1290 Under 990
15 Hospital infrastructure & Installations 2000 1701-1999 1401-1700 1100-1400 Under 1100
1B
Total achievable score** (Over) 21667 18368-21667 15868-18367 13219-15867 10867-13218
Minimum score requirement for getting specific grade
Teaching hospitals (maximum score = 21667 + 3000 bonus points) 88% 74% 64% 54% 44%
Non-teaching hospitals (maximum score = 21667 + 2000 bonus points) 92% 78% 67% 56% 46%
* The worst performing hospitals, so-called“to be shut down”with a total score under 10866, for which they are not allowed to undertake any medical activity as a hospital, but as a clinic or minor surgery center.
**There are bonus points for four domains including teaching activities, non-general departments in general hospitals, CCU and ICU and other special facilities; each can add up 500 additional (2000 in total) scores to the non-teaching hospitals’scores. This bonus can add 3000 scores to teaching hospitals (additional 1000 scores for teaching activities).
Aghaei
Hashjin
et
al.
BMC
Health
Services
Research
2014,
14
:448
Page
6
o
f
1
4
http://ww
w.biomedce
ntral.com/1
[image:6.794.69.705.127.464.2]of the general hospitals did not appear to be associated with the ownership, teaching status, size and ranking of the university to which they were affiliated in the period of 2002 to 2005, but the general teaching hospi-tals performance improved slower than that of general non-teaching hospitals over the period of 2006 to 2008. There was no relationship between teaching status of specialized hospitals and their level of performance.
However, the performance of governmental specialized hospitals declined over time. In contrast, the perform-ance of specialized hospitals with more than 500 beds increased significantly faster compared to smaller spe-cialized hospitals. Moreover, the level of performance of specialized hospitals was positively associated with the national ranking of affiliated universities. Although this study provides unique insights into the Iranian hospitals’performance, it is subject to some limitations concerning the quantitative data used. Underreporting
of the hospitals’ performance data to the public by
some owners, and limited access to the performance data were the main concerns.
[image:7.595.56.291.122.303.2]The Iranian hospital performance measurement program; a unique model for“pay for performance and quality” The Iranian HPMP is unique in terms of the linkage of the results to the hospital financing (P4P and pay for quality (P4Q); which are both embedded in the pro-gram). The PM is on the one hand a regulatory tool for the government to improve the performance and quality of care in hospitals; while on the other hand, it is neces-sary for the hospitals to get a higher performance score to charge the patient higher and to get a higher share from the annual government budget. The government strictly applies a performance-based budgeting system for the payments to the hospitals based on the results of
Table 3 The domains, allocated scores and relevant grades for performance measurement of the specialized hospitals [24]
A
Domain Score Domain Score Domain Score
1 Radiology 925 12 Kitchen 113 23 Central Sterilization Room (CSR) 50
2 Management and supervision 870 13 Emergency department 110 24 Sanitation 45
3 Nursing 720 14 Using standard forms 110 25 Admission and discharge 43
4 Engineering and maintenance 535 15 Pharmacy 110 26 Statistics 40
5 Hospital committees 215 16 Physiotherapy 105 27 Finance 40
6 Administration 215 17 Medical records 77 28 Physician related medical records 40
7 Board of physicians 205 18 Delivery room 75 29 Monthly medical seminars 30
8 Ownership 200 19 Laundry 70 30 Board of directors 25
9 Laboratory 190 20 Information 67 31 Library 20
10 Clinics 180 21 Board of physicians guideline 53 31 Procurement 20
11 Operation room 140 22 Dialysis unit 50 Total score 5688
B
Awarded score Grade Minimum score (out of total score) which is necessary for
getting specific grade
Over 2500 1 44%
2000-2499 2 35%
1500-1999 3 26%
[image:7.595.61.541.459.731.2]Under 1500 4 (sub-standard) 26%
Table 2 The quality indicators and relevant scores as subjected to the HPMP from 2002 for general hospitals [25,32]
Quality indicator Maximum score
(%)
Waiting time for the first visit of physician in the ED
24 (2.8)
Waiting time for the first nursing services in the ED
24 (2.8)
Patient satisfaction in the ED 24 (2.8)
Pre-operative assessment 50 (5.8)
Pre-operative prophylactic antibiotic therapy 100 (11.5)
Pain management 100 (11.5)
The ratio of caesarean section to natural delivery 140 (16.1)
Safe injections 155 (17.9)
Hospital infections 250 (28.8)
Table 4 The comparison of obligatory performance measurement (PM) characteristics in general and specialized hospitals
Type of hospital Updating of PM program
Number of PM domains Number of questions in each round of PM
Existence of pre-requisites for PM
Maximum awarded scores in PM
Scales of grading Responsibility for PM
General (public university, private, SSO and other)
teaching ✓(Updated in several stages)
14 domains; which increased to 15 domains in 2006
In total 1027 questions in 15 areas
Evaluation of ED was pre-requisite until 2006. From 2006 CD* assessment became obligatory alongside ED
21667 + 3000 bonus points
Six points scale (Excellent1, 1, 2, 3, 4 and 5)
MOHME/ Medical university
non-teaching ✓(Updated in several stages)
14 domains;, which increased to 15 domains in 2006
In total 1027 questions in 15 areas
Evaluation of ED was pre-requisite until 2006. From 2006 CD assessment became obligatory alongside ED
21667 + 2000 bonus points
Six points scale (Excellent1, 1, 2, 3, 4 and 5)
MOHME/ Medical university
Specialized (public university, private, SSO and other)
Unchanged (not updated)
32 (remained unchanged)
In total 213 questions in 32 areas
No specific pre-requisites 5688 (no bonus point)
Four points scale (no excellent 1 and 5 scale)
MOHME/ Medical university
*CD = Critical domains.
Aghaei
Hashjin
et
al.
BMC
Health
Services
Research
2014,
14
:448
Page
8
o
f
1
4
http://ww
w.biomedce
ntral.com/1
PM [36]. In addition, the inclusion of quality indicators in the program and establishment of quality evaluation of the hospitals and introduction of“pay and penalty for quality” were the most progressive efforts to push the hospitals being accountable for their performance and the quality of care they provided to patients in Iran [37]. This has been associated with increased efforts among Iranian hospitals to adhere to the audited standards [20,38]. Recently, the US government disclosed a similar “pay and penalty for quality” method for its Medicare hospitals [23]. Having a higher or lower PM score results in a higher or lower revenue for hospitals. The lower score leads to a lower income and consequently the low rate of functioning could result in a shut down and bankruptcy (especially in the private sector). This can potentially stimulate competition between the hospitals in their ambition to improve their performance and quality
of care to get a higher score. As the budget of hospitals and their revenue strongly relate to the PM results, it is recommended that the measurement process runs in-dependently from the owner of hospitals. Performance measurement by an independent body can avoid bias in the results which may originate from the relationship between hospitals and their owners.
The trend of performance of general and specialized hospitals
General hospitals
[image:9.595.57.543.103.348.2]The performance of the general teaching hospitals improved with an average of 231 points every year from 2002 to 2005. Over the next period (from 2006 to 2008) for the same group of hospitals, the performance scores improved, but the average improvement rate was slower at 180 points per year. The average rate of the
Table 6 The analysis of the trend of hospital performance scores over the period 2002 to 2008
Hospital Time
period
Average performance score in the first year of time period (intercept)
SD SE Average performance score
increase per year (slope)
SE P-value
General Teaching 2002-2005 18269 1367 142.7 231 43.4 0.000
2006-2008 19557 1235 134.9 180 50.5 5e-04
Non-teaching 2002-2005 16293 1666 79.8 341 20.8 0.000
2006-2008 18049 1602 75.1 189 25.2 0.000
[image:9.595.57.540.641.732.2]Specialized 2002-2008 2812 648 49.9 46 7.6 0.000
Table 5 The statistics of hospitals included in the study by the type, ownership and year of grading
5A) The number of hospitals included by the type, ownership and year of grading in period 1 from 2002 to 2005
Ownership 2002 2003 2004 2005
G. S. Total G. S. Total G. S. Total G. S. Total
University 296 118 414 324 133 457 323 135 458 343 136 479
SSO 47 5 52 54 5 59 54 4 58 57 4 61
Private 86 7 93 94 10 104 99 10 109 99 10 109
Army 35 5 40 38 5 43 38 4 42 42 5 47
Other 44 5 49 44 7 51 47 9 56 45 10 55
Total 508 140 648 554 160 714 561 162 723 586 166 752
5B) The number of hospitals included by the type, ownership and year of grading in the period 2 from 2006 to 2008
Ownership 2006 2007 2008
G. S. Total G. S. Total G. S. Total
University 347 136 483 339 132 471 288 47 335
SSO 59 4 63 57 3 60 50 0 50
Private 96 9 105 93 10 103 87 2 88
Army 37 5 42 36 4 40 36 0 36
Other 45 10 55 48 10 58 47 0 47
Total 584 164 749 573 159 732 508 48 556
Table 7 The relationship between hospital performance and characteristics of hospitals from 2002 to 2008*
A) The relationship between hospital performance and ownership of hospitals
Hospital type Time period The average increase/decrease in performance per year by ownership of hospitals (relevant p-values) Total performance increase (p-value)
Government SSO Private Army Charity Other
General 2002-2005 24 (0.890) 197 (0.325) 92 (0.621) 97 (0.647) 52 (0.835) 265 (0.384) 317 (0.776)
2006-2008 -243 (0.126) -331 (0.075) -345 (0.047) -249 (0.214) 81 (0.718) 453 (0.557) 209 (0.118)
Specialized 2002-2008 -88 (0.038) -55 (0.382) -63 (0.220) -81 (0.175) 24 (0.729) 126 (0.495) 46 (0.135)
B) The relationship between hospital performance and teaching status of hospitals
Hospital type Time period The average performance increase/decrease per year by teaching status of hospitals and relevant p-values
Total performance increase (p-value)
Teaching Non-teaching
General 2002-2005 -118 (0.113) 347 (0.877) 317 (0.113)
2006-2008 -141 (0.044) 228 (0.929) 209 (0.044)
Specialized 2002-2008 -15 (0.307) 53 (0.707) 46 (0.307)
C) The relationship between hospital performance and size of hospitals
Hospital type Time period The average performance increase/decrease per year by size (bed number) category of hospitals and relevant p-values
Total performance increase (p-value)
≤100 101-200 201-300 301-400 401-500 >500
General 2002-2005 96 (0.703) -4 (0.987) 133 (0.629) -118 (0.710) -142 (0.700) 265 (0.328) 317 (0.608)
2006-2008 114 (0.597) 49 (0.824) 124 (0.599) 191 (0.482) 15 (0.962) 103 (0.521) 209 (0.872)
Specialized 2002-2008 -19 (0.699) -21 (0.663) -40 (0.495) -1 (0.991) -5 (0.945) 66 (0.042) 46 (0.986)
D) The relationship between hospital performance and national medical universities ranking (which is affiliate the hospital)
Hospital type Time period Total number of hospital (n)
The average performance increase/decrease per year by medical university rank and relevant p-values
Total performance increase (p-value)
Grade 1 n Grade 2 n Grade 3 n
General 2002-2005 2214 -78 (0.512) 1127 -22 (0.858) 890 366 (0.912) 193 317 (0.650)
2006-2008 1666 -78 (0.491) 858 -216 (0.063) 658 331 (0.938) 150 209 (0.053)
Specialized 2002-2008 1000 49 (0.053) 577 4 (0.885) 331 16 (0.263) 92 46 (0.009)
* Statistically significant relationships are shown in bold.
Aghaei
Hashjin
et
al.
BMC
Health
Services
Research
2014,
14
:448
Page
10
of
14
http://ww
w.biomedce
ntral.com/1
performance level of the general non-teaching also in-creased in from 2002 to 2008. But the rate of improve-ment was largest over the first period from 2002 to 2005. General teaching hospitals indicated a higher per-formance in the first time period in 2002, but they im-proved their performance with a lower rate in the next years until 2006 compared to the general non-teaching hospitals. Over the second time period starting from 2006, although again teaching hospitals showed a higher performance compared to the general non-teaching hospitals, both groups improved their level of performance with almost the same rates in the next years. The average rate of performance improvement of the gen-eral non-teaching hospitals was substantially lower in the second time period starting from 2006 compared to the first period. Although both general teaching and general non-teaching hospitals showed an improvement in their performance scores; this can partly be the result of the addition of quality indicators’scores to the total achievable scores. Another explanation might be the introduction of new medical facilities and not really performance im-provement because of the PM program. It seems that getting higher performance scores became more difficult since 2006 onwards for both teaching and non-teaching general hospitals, which may partly be due to the additional critical domains and quality indicators of the PM program and the tightened requirements. There was also a substantial decline in the performance improvement trends of the general teaching and private hospitals in this period.
Specialized hospitals
The overall performance of the specialized hospitals improved from 2002 with an average rate of 46 points per year until 2008. However, there is a concern about the governmental specialized hospitals whose perform-ance decreased (on average 88 points per year) compared to the overall improvement rate over the study period. It is difficult to interpret this substantial decreasing perform-ance trend of specialized hospitals. This can be due to several reasons. It can be partly because of the type of ownership and responsibility for the PM among special-ized hospitals. The government and medical universities as the owner of a majority (above 80%) of specialized hos-pitals do not seem to use much force to stimulate the spe-cialized hospitals to increase their level of performance. Using an outdated PM mechanism and minimized requirements for grading of these hospitals indicates a somewhat conservative policy regarding the specialized hospitals by the government. In addition, the quantity of specialized hospitals represents a relatively small segment of the hospital sector in Iran. As a result, it is more difficult for the government to suspend the license of specialised
hospitals compared to general hospitals in case of violation from PM requirements.
The associations between the performance of hospitals and their characteristics
The results show that there was no statistical significant relationship between the level of performance of the general hospitals and the ownership, teaching status, size of hospital and university rank in the period of 2002 to 2005. In contrast, from 2006 to 2008, the average per-formance improvement of the general teaching hospitals was significantly lower than the overall average rate of improvement. The lower performance improvement of these hospitals may partly relate to the changes in the mechanism of the PM and extra forces by the govern-ment on the hospitals to improve their performance and quality of services by tightening the PM standards. Al-though there was no relationship between the hospitals’ ownership and the level of performance, the performance of the general private hospitals was substantially lower than the overall general hospitals’ performance improve-ment rate from 2006 to 2008. This might be because of the existence of less commitment with the government to stimulate performance and quality measurement stan-dards in the private hospitals.
standards may be necessary to encourage the improve-ment of specialized hospitals’performance.
Factors influencing a valid assessment of hospital performance in Iran
Although our study revealed that the overall performance of the Iranian hospitals improved over the study period, it is important to consider the factors that can influence the performance of hospitals when interpreting the hospital performance. The ownership, method of funding, responsi-bility and validity of the PM are important factors. The PM is conducted by assessment teams which are employed by the medical universities (and the MOHME) which are the owners of hospitals in most cases. Since both universities and hospitals are likely not keen to provide information which might lead to public blame or litigation; the objectiv-ity of the process of PM might potentially be compromised [4]. This potentially also explains why the MOHME has not been very active in publishing the hospitals’ perform-ance data [39]. The dependency of the measurement teams may cause deviation of results in favour of the owners (affiliated medical universities) of hospitals, as suggested by other studies [20,38]. In many countries, evaluating bodies are usually independent from the ownership of hospital and they are not involved in other processes such as policy making and conducting of PM process [40]. The other important factor is that although the program is unique in terms of the variety of professions involved [41], nonetheless it seems to be necessary to involve different stakeholders including the hospital’s board of directors’ members, hospital managers, patients’delegates, payers, insurance companies, and quality control officers for standard setting and PM processes. Their involvement in the hospital administration, quality and patient safety issues in the field of hospitals is very useful, making them very familiar with the characteristics of hospital services and performance, and can make professional judgments [42].
Although the scheduled on-site survey is one of the advantages of the Iranian hospital PM program; it could be the case that hospitals prepare themselves briefly in advance and improve their performance just for the period of the conduction of the PM process. This can make the results of the evaluation biased, indicating limited to no sustainable improvements in hospital performance. In addition, as the program is applied both for the teach-ing and non-teachteach-ing hospitals with the same mechan-ism and standards, applying a PM that is fine-tuned towards the specific characteristics (for example teach-ing status) of hospitals may increase the accuracy of the measurement results. Finally, the updating of the meas-urement methods, standards and instruments alongside above mentioned factors may also improve the validity of PM results (as also reported elsewhere [43]). This
will also contribute to the development of a mature hospital accreditation model in Iran.
Conclusion
The Iranian MOHME developed a compulsory national HPMP as early as 1997 and implemented it as a regulatory instrument to improve performance in all hospitals in Iran. Development and implementation of the program for more than one decade shows an extensive effort to es-tablish a framework to improve hospital performance. The existence of such a program has improved the level of per-formance amongst the Iranian hospitals, but the impact varied in different groups of hospitals. Although in total the performance of both general and specialized hospitals has improved, the improvements in performance scores over time in the general teaching hospitals was substan-tially lower than that in general non-teaching hospitals. Moreover, the level of performance in the governmental specialized hospitals significantly decreased over the study period. To further promote an effective PM and accredit-ation model for hospital that meets quality assurance re-quirements and stimulates the performance improvement efforts in Iranian hospitals it may be helpful to reconsider a number of essential mechanisms that are currently in place. Areas of attention include the roles of different stakeholders in the PM program, the composition of survey teams and their training, ownership and funding of the program. It may also be worthwhile to fine-tune the PM mechanism, procedures of implementation for different hospitals, updating standards and type of scoring systems.
Abbreviations
HPMP:Hospital performance measurement program; QI: Quality
improvement; WHO: World Health Organization; MOHME: Ministry of health and medical education; P4P: Pay for performance; SSO: Social security organization; ED: Emergency departments; CD: Critical domains; CSR: Central sterilization room; PM: Performance measurement; G: General; S: Specialized; P4Q: Pay for quality.
Competing interests
The authors declare that they have no competing interests.
Authors’contributions
AAH designed the study, prepared the questionnaire, collected the data, performed the data analysis, and drafted the manuscript. JM and AA facilitated the data collection in Iran, provided advice on the study design, and commented on drafts of the manuscript. JM provided advice on the data analysis strategy, and participated in the manuscript drafting. DSK provided support in the data analysis, edited the English texts, and contributed to writing the manuscript, and provided feedback on all drafts of the manuscript. NSK coordinated the study, supervised AAH, provided advice on all stages of the study, and contributed to drafting the manuscript. All authors read and approved the final manuscript.
Authors’information
AAH MSc,1- Junior Health System Researcher and PhD candidate, Department of Public Health, Academic Medical Center (AMC)/University of Amsterdam, the Netherlands. 2- Researcher in Department of Health Services Management, School of Health Management and Information Sciences, Iran University of Medical Sciences, Tehran, Iran.DSK PhD,Postdoctoral Health System
Researcher, Department of Public Health, Academic Medical Center, University of Amsterdam, the Netherlands.JM PhD,Health System Researcher and quality improvement officer in Tehran Heart Center Hospital, Department of quality improvement (head of department), Tehran University of Medical Sciences, Tehran, Iran.AA PhD,Researcher and Assistant Professor of Health Services Management, Department of Health Services Management, School of Health Management and Information Sciences, Iran University of Medical Sciences, Tehran, Iran.NSK MD PhD,Professor of Social Medicine, Department of Public Health, Academic Medical Center, University of Amsterdam, the Netherlands.
Acknowledgments
The authors are grateful to Dr. Hamid Ravaghi, Dr. Reza Tooyserkanmanesh, Mr. Saeidreza Azami, Dr. Mehdi Jafari, Dr. Seysed Hesam Seyedin, Mrs. Seyran Naghdi for facilitating the data collection for this study. Gratitude goes to Wim Busschers for his advice on the data analysis for this study. The authors would also like to thank Professor Dr. Karien Stronks for supporting this research project at the Department of Public Health, Academic Medical Center (AMC) - University of Amsterdam.
Author details
1
Department of Public Health, Academic Medical Center (AMC)/University of Amsterdam, Postbox: 22660, 1100 DD Amsterdam, The Netherlands.
2
Department of Health Services Management, School of Health Management and Information Sciences, Iran University of Medical Sciences, Tehran, Iran.
3
Department of Quality Improvement, Tehran Heart Center Hospital, Tehran University of Medical Sciences, Tehran, Iran.
Received: 18 February 2014 Accepted: 23 September 2014 Published: 1 October 2014
References
1. Greenfield D, Braithwaite J:Health sector accreditation research: a systematic review.Int J Qual Health Care Advance2008,20(3):172–183. 2. Rooney AL, van Ostenberg PR:Licensure, Accreditation, and Certification: Approaches to Health Services Quality, Quality Assurance Methodology Refinement Series. USA: Center for Human Services (CHS), Quality Assurance Project; 1999.
3. Shih A, Schoenbaum SC:Measuring Hospital Performance: The Importance of Process Measures, Data brief, The Commonwealth Fund. ; 2007.
4. Shaw C:How Can Hospital Performance Be Measured and Monitored?
InHealth Evidence Network report.Copenhagen: WHO Regional Office for Europe; 2003.
5. Nutley S, Smith PC:League tables for performance improvement in health care.J Health Serv Res Policy1998,3:50–57.
6. Performance Measurement. In http://en.wikipedia.org/wiki/ Performance_measurement, accessed 07-12-2013.
7. Soeters R, Habineza C, Peerenboom PB:Performance-based financing and changing the district health system: experience from Rwanda.Bull World Health Organ2006,84:884–889.
8. Eichler R, Auxila P, Antoine U, Desmangles B:Performance-Based Incentives For Health: Six Years Of Results From Supply-Side Programs In Haiti. InCGD Working Paper #121. Washington, DC: Center for Global Development; 2007.
9. Sondorp E, Palmer N, Strong L, Wali A:Afghanistan: Paying NGOs for performance in a postconflict setting. InPerformance Incentives for Global Health: Potential and Pitfalls.Edited by Eichler R, Levine R, The Performance-Based Incentives Working Group. Washington, DC: Center for Global Development; 2009.
10. Toonen J, Canavan A, Vergeer P, Elovainio R:Performance-based Financing for Health: Lessons from Sub-Saharan Africa.Amsterdam: Royal Tropical Institute. Cordaid and the World Health Organization; 2009.
11. Basinga P, Gertler P, Binagwaho A, Soucat LBA, Sturdy J, Vermeersch MJC:
Effect on maternal and child health services in Rwanda of payment to primary health-care providers for performance: an impact evaluation.
Lancet2011,377:1421–1428.
12. The Iranian Ministry of Health and Medical Education:Standards And Principles Of Evaluation Of The General Hospitals, The instruction (in Farsi). ; 1997.
13. World Health Organization Hospital Advisory Group:A Review of the Determinants of Hospital Performance.Geneva, Switzerland: World Health Organization. District Health Systems Unit; 1994.
14. Healy J, McKee M:The role and function of hospitals. InHospitals in a Changing Europe.Edited by McKee M, Healy J. Buckingham: Open University Press; 2002.
15. Onyebuchi A, Arah TC, Klazinga NS:Updating the Key Dimensions of Hospital Performance: The Move Towards a Theoretical Framework. In Barcelona: Third Workshop on Hospital Performance Measurement; 2003. 16. Ovretveit J:Quality evaluation and indicator comparison in health care.
Int J Health Plann Manage2001,16(3):229–241.
17. The National Committee for Quality Health Care (NCQHC), CEO Survival Guide Pay for Performance, 2006 Edition, http://www.leapfroggroup.org/ media/file/HospitalCEOGuidetoP4P.pdf, accessed 10 September 2012. 18. Shaw CD:Developing Hospital Accreditation In Europe.Copenhagen Denmark:
WHO Regional Office for Europe, Division of Country Support; 2004. 19. Nicholas D:Using Accreditation to Improve Quality. The quality
assurance project’s information outlet,1999.
20. Aryankhesal A, Sheldon TA, Mannion R:Role of pay-for-performance in a hospital performance measurement system: a multiple case study in Iran.Health Policy Plan2013,28(2):206–214. doi:10.1093/heapol/czs055. 21. Stockard J, Tusler M:Does publicizing hospital performance stimulate
quality improvement efforts?Health Aff2003,22(2):84–94.
22. World Health Organization:Health Systems: Improving Performance.InThe World Health Report.Geneva: Bulletin of the World Health Organization; 2000. 23. Rau J:Medicare Discloses Hospitals’Bonus, Penalties Based On Quality. In
2012. http://www.kaiserhealthnews.org/Stories/2012/December/21/ medicare-hospitals-value-based-purchasing.aspx?goback=%2Egmp_83749% 2Egde_83749_member_199766202, accessed 07-01-2013.
24. Aryankhesal A:The Iranian Hospital Grading System And Its Influence On Stakeholders’Behaviour. In PhD thesis. York: The university of York; 2010. 25. The Iranian Ministry of Health and Medical Education:Practical Instruction To
Quality Evaluation In Hospitals (In Farsi).; 2002.
26. Tabriz Medical University:Hospitals’Evaluation Department. In http:// treatment.tbzmed.ac.ir/?MID=21&Type=News&TypeID=2&ID=16, accessed 20-01-2014.
27. Shiraz Medical University:Hospitals’Evaluation Department. In http:// www.sums.ac.ir/, accessed 15-12-2013.
28. The Iranian Ministry of Health and Medical Education:Hospitals Performance Grading Results.2008.
29. The Iranian Ministry of Health and Medical Education:The Graphs Of The General Hospitals Grading Based On Acquired Scores In Annual Evaluation (2007-2008). In 2009.
30. The Iranian Ministry of Health and Medical Education:The Trend of Changing General Hospitals’Grades From 2005 To 2008.In 2009. 31. Mehr New Agency:The Results of Medical Universities Grading. In 2010.
http://www.mehrnews.com/fa/newsdetail.aspx?newsID=1408888, accessed 16-11-2012.
32. MOHME:The Instruction of Standards and Principles of Evaluation of The General Hospitals (in Farsi). In Tehran: The Ministry of Health and Medical Education; 1997.
33. The Iranian Ministry of Health and Medical Education:Charges For The Diagnostic And Treatment Services (In Farsi), 2009–2010. In 2009. available at: http://treatment.tbzmed.ac.ir/uploads/30/CMS/user/file/47/ tarafe/tarefeglo88.pdf, accessed 20-01-2014.
34. Gyani GJ:Hospital Accreditation in India - Standardising healthcare.Asian Hosp Healthcare Manag2012, (22):From Asian Hospital & Healthcare Management, http://www.asianhhm.com/knowledge_bank/articles/ healthcare_accreditations_india.htm, accessed 7 May 2012. 35. The Health Ministry of Malaysia:Malaysian Government Considers
Mandatory Accreditation For Hospital Licenses, Patient Safety Monitor: Global Edition. In 2008. http://www.hcpro.com/QPS-225413-5482/ Malaysian-government-considers-mandatory-accreditation-for-hospital-licenses.html, accessed 18-04-2012.
36. Kiadaliri AA, Jafari M, Gerdtham U-G:Frontier-based techniques in measuring hospital efficiency in Iran: a systematic review and meta-regression analysis.BMC Health Serv Res2013,13:312. doi:10.1186/1472-6963-13-312.
37. Aghaei Hashjin A, Ravaghi H, Kringos DS, Ogbu UC, Fischer C, Azami SR, Klazinga NS:Using quality measures for quality improvement: the perspective of hospital staff.PLoS One2014, doi:10.1371/journal. pone.0086014.
examination of possible mechanisms.Health Policy2014,115(2):206–214. doi:10.1016/j.healthpol.2013.11.004.
39. Aryankhesal A, Sheldon T:Effect of the Iranian hospital grading system on patients’and general practitioners’behaviour: an examination of awareness, belief and choice.Health Serv Manage Res2010,23(3):139–144. doi:10.1258/hsmr.2009.009028.
40. Shaw CD, European Foundation for Quality Management. International Organization for Standardization:External quality mechanisms for health care: summary of the ExPeRT project on visitatie, accreditation, EFQM and ISO assessment in European Union countries. External peer review techniques.Int J Qual Health Care2000,12(3):169–175. PubMed Abstract | Publisher Full Text.
41. Aghaei Hashjin A, Delgoshaei B, Kringos DS, Tabibi SJ, Manoochehri J, Klazinga NS:Implementation of hospital quality assurance policies in Iran: Balancing the role of licensing, annual evaluation, inspections and quality management systems.Int J Health Care Qual Assur2014, forthcoming.
42. Hendrikse I:The Dutch Healthcare Accreditation System. InThe Netherlands Institute for Accreditation in Healthcare (NIAZ).Prague: Utrecht; 2009.
43. Ginsberg C, Sheridan S, Ginsberg C, Sheridan S:Limitations of and barriers to using performance measurement: purchasers’perspectives.Health Care Finance Rev2001,22(3):available from http://www.highbeam.com/ doc/1G1-79053740.html#, accessed 12 June 2012.
doi:10.1186/1472-6963-14-448
Cite this article as:Aghaei Hashjinet al.:Development and impact of the
Iranian hospital performance measurement program.BMC Health Services
Research201414:448.
Submit your next manuscript to BioMed Central and take full advantage of:
• Convenient online submission
• Thorough peer review
• No space constraints or color figure charges
• Immediate publication on acceptance
• Inclusion in PubMed, CAS, Scopus and Google Scholar
• Research which is freely available for redistribution
Submit your manuscript at www.biomedcentral.com/submit
![Figure 1 The flow chart of the process of a typical hospital evaluation & grading in Iranian Healthcare System, adapted fromAryankhesal (2010) [24]](https://thumb-us.123doks.com/thumbv2/123dok_us/8308274.291703/3.595.58.538.90.570/figure-process-typical-hospital-evaluation-iranian-healthcare-fromaryankhesal.webp)
![Table 1 A) The domains, allocated scores, relevant grades, and B) minimum score requirement for getting specific grade for the general hospitals,[12,24-27,32]](https://thumb-us.123doks.com/thumbv2/123dok_us/8308274.291703/6.794.69.705.127.464/domains-allocated-relevant-minimum-requirement-getting-specific-hospitals.webp)
![Table 2 The quality indicators and relevant scores assubjected to the HPMP from 2002 for general hospitals[25,32]](https://thumb-us.123doks.com/thumbv2/123dok_us/8308274.291703/7.595.61.541.459.731/table-quality-indicators-relevant-scores-assubjected-general-hospitals.webp)