R E S E A R C H
Open Access
Enhanced surveillance and data feedback
loop associated with improved malaria data
in Lusaka, Zambia
Zunda Chisha
1, David A. Larsen
1,2, Matthew Burns
1, John M. Miller
3, Jacob Chirwa
4, Clara Mbwili
5, Daniel J. Bridges
1,
Mulakwa Kamuliwo
4, Moonga Hawela
4, Kathrine R. Tan
6, Allen S. Craig
6and Anna M. Winters
1,7*Abstract
Background:Accurate and timely malaria data are crucial to monitor the progress towards and attainment of elimination. Lusaka, the capital city of Zambia, has reported very low malaria prevalence in Malaria Indicator Surveys. Issues of low malaria testing rates, high numbers of unconfirmed malaria cases and over consumption of anti-malarials were common at clinics within Lusaka, however. The Government of Zambia (GRZ) and its partners sought to address these issues through an enhanced surveillance and feedback programme at clinic level.
Methods:The enhanced malaria surveillance programme began in 2011 to verify trends in reported malaria, as well as to implement a data feedback loop to improve data uptake, use, and quality. A process of monthly data collection and provision of feedback was implemented within all GRZ health clinics in Lusaka District. During clinic visits, clinic registers were accessed to record the number of reported malaria cases, malaria test positivity rate, malaria testing rate, and proportion of total suspected malaria that was confirmed with a diagnostic test.
Results and discussion:Following the enhanced surveillance programme, the odds of receiving a diagnostic test for a suspected malaria case increased (OR = 1.54, 95 % CI = 0.96–2.49) followed by an upward monthly trend (OR = 1.05, 95 % CI = 1.01–1.09). The odds of a reported malaria case being diagnostically confirmed also increased monthly (1.09, 95 % CI 1.04–1.15). After an initial 140 % increase (95 % CI = 91–183 %), costs fell by 11 % each month (95 % CI = 5.7–10.9 %). Although the mean testing rate increased from 18.9 to 64.4 % over the time period, the proportion of reported malaria unconfirmed by diagnostic remained high at 76 %.
Conclusions:Enhanced surveillance and implementation of a data feedback loop have substantially increased malaria testing rates and decreased the number of unconfirmed malaria cases and courses of ACT consumed in Lusaka District within just two years. Continued support of enhanced surveillance in Lusaka as well as national scale-up of the system is recommended to reinforce good case management and to ensure timely, reliable data are available to guide targeting of limited malaria prevention and control resources in Zambia.
Keywords:Surveillance, Malaria, Case management, Elimination, DHIS2, Zambia
* Correspondence:awinters@akros.com
1Akros, Cresta Golfview Grounds, Great East Road, Unit 5, Lusaka, Zambia 7
University of Montana School of Public and Community Health Sciences, Missoula, MO, USA
Full list of author information is available at the end of the article
Background
Data-driven decision-making amongst national malaria control programmes in Africa is critical for the efficient use of resources among an often increasingly stratified malaria burden. Despite the need for improved informa-tion, routine malaria surveillance throughout sub-Saharan Africa is known to have many challenges including under-representation of the true burden of malaria circulating in communities [1–3], as well as lacking quality and timely data reporting. As malaria control programmes pursue malaria elimination, timely, reliable data becomes crucial to respond to potential resurgence and to target foci of malaria transmission with appropriate interventions [4, 5].
Improvements in Health Management Information Systems (HMIS) are needed in order to provide quality data necessary for a responsive malaria programme [6, 7]. However, national malaria control programme data are often from population-based surveys conducted at intervals of two years or more, rather than relying upon surveillance data from continuously operating health in-formation systems [8, 9]. Scaling up and integrating the reporting of diagnostic confirmations of malaria cases has the potential to significantly reduce malaria reporting and unnecessary anti-malarial treatment administra-tion, especially in areas with variable malaria transmis-sion patterns [10].
The HMIS in Zambia collects and monitors health-related indicators through paper-based reporting systems collected on a monthly basis. Although collecting accur-ate and timely data has been a goal of the Government of Zambia (GRZ) since the inception of the HMIS, oper-ational challenges remain. These include inadequate support for training of especially new facility staff on reporting standards and processes; infrequent supervi-sion, especially amongst more rural, and distant facilities; and insufficient data validation across multiple reporting forms [11]. The lack of consistent feedback to health fa-cilities regarding data quality and trends has previously been identified in an assessment of the HMIS system [11]. Furthermore, the time from a patient encounter at a clinic to receipt of those data at the central level can take weeks or even months.
In response to some of these challenges, the Ministry of Health (MOH) recently began implementing the Dis-trict Health Information System 2 (DHIS2), a central-ized, web-based aggregate reporting system at national, provincial, and district level to expedite data access and reporting. The DHIS2 data flow model improves access to information and timeliness from the point of data entry. It further allows greater functionality for report-ing, feedback, and communication among system users. As the basis for aggregate reporting, DHIS2 was also used by the National Malaria Control Programme (NMCP) for data reporting from facility and community
levels in areas of low malaria burden in support of the National Malaria Strategic Plan goal to bring areas closer to malaria elimination [12].
To further improve the accuracy and timeliness of malaria data and to understand the true malaria burden within all GRZ health facilities within Lusaka District, the NMCP, and its partners initiated an enhanced surveil-lance programme in 2010. This paper examines trends in malaria indicators before and after the enhanced surveil-lance programme, and assesses the benefits these invest-ments had on reducing the levels of reported malaria in the district.
Methods
Study site
Lusaka District, located in the southern area of the cen-tral plateau of Zambia and home to the capital city Lusaka with an estimated population of 1.7 million, is the most urbanized area of the country. Lusaka District alone represents approximately 14 % of the national population and therefore resource allocation for malaria control efforts for Lusaka greatly affects national plan-ning efforts. Recent survey reports suggest that Lusaka Province, including areas in Lusaka District are amongst the lowest malaria prevalence areas in Zambia, with less than 1 % malaria parasite prevalence reported in chil-dren under the age of 5 over the past 8 years [13–16]. Although indoor residual spray campaigns have been conducted since 2003, the distribution of long lasting in-secticide treated nets (through mass distributions, at antenatal clinics, and at clinics for children under 5) as well as the use of artemisinin combination therapy (ACT) for clinical management of malaria are considered by some to be major contributing factors to low malaria prevalence [17]. Low malaria prevalence in Lusaka is also likely an outcome of the rapid rate of urbanization and high altitude [18, 19]. Routine HMIS data in Lusaka, Zambia reported 171,578 malaria cases (cumulative inci-dence (CI) = 104 cases per 1,000 population) in 2009 and 221,244 malaria cases (CI = 119 cases per 1000 popula-tion) in 2010.
Enhanced surveillance
test results provided by facility-based laboratory techni-cians and the NMCC; and 4) consistent and timely report-ing and feedback from the NMCC to the district and facility staff of results of prospectively collected informa-tion and quality assurance results.
Initially, retrospective malaria data were collected (January 2004 to March 2011) from each health facility in Lusaka District from a small team of data collectors. Due to high levels of incompleteness, only data starting from January 2009 were used in analyses. Data sources consulted included outpatient disease (OPD) registers, RDT registers, laboratory registers, stock control cards, and HMIS disease aggregation forms which are used to aggregate monthly facility data sent through the HMIS every month. Data collected included total consultations, total reported malaria, total malaria rapid diagnostic tests (RDTs) administered, total malaria microscopy slides collected, total confirmed malaria positives by RDT or microscopy, and total artemisinin combination therapy (ACT) courses dispensed. These data elements were adapted from a tool used by the PATH Malaria Control and Elimination Partnership in Africa (MACEPA) in other districts of Zambia [10]. The number of confirmed malaria cases reporting recent (within one month) travel history outside Lusaka District was also collected from clinic re-cords starting in January 2012.
Supervision and feedback
Between April 2011 and December 2012, the latest malaria data recorded in clinic logbooks was compared with re-ported numbers during monthly supervision visits, and feedback was provided to health facility staff on the previ-ous month’s data. Clinicians, nurses, and laboratory staff were instructed on correct data definitions and reporting standards and were kept informed of their progress in ad-hering to national guidelines for treatment and reporting (e.g., dispensing anti-malarials only based on diagnostic confirmation). Areas in which improvements could be made were identified and corrected, such as use of case definitions or data recording practices. During monthly clinic visits, the data collection team provided reports to laboratory and clinic staff on their performance relative to other Lusaka District clinics. In addition, meetings be-tween NMCP officers coordinating this activity and Dis-trict Health Management Team (DHMT) staff were used to further disseminate information on the district malaria situation. These meetings brought the data to the forefront and helped foster an environment where the accuracy and quality of the data were considered important and helpful for decision-making.
Laboratory quality assurance
The enhanced surveillance programme team partnered with the NMCP parasitology department to collect malaria
laboratory quality assurance data. Each month all positive malaria blood slides as well as a sample of ten negative slides from each health facility were collected and re-examined by NMCP parasitology experts. RDT cassettes were also reviewed and compared to results, which clinic/ lab staff had recorded. Week-long refresher training for all laboratory staff that included parasite detection, quanti-fication, and Plasmodium spp. identification with WHO-approved reference slides was also provided. These trainings were conducted in May 2011 and included an additional component on malaria case management provided to at least one clinician from each health fa-cility. These activities were all aimed at improving the accuracy of malaria diagnosis, case management, and ultimately, malaria surveillance.
Data analysis
The Raster package [20] in R version 3.1.0 [21] was used to extract EVI for Lusaka District. All analyses were con-ducted using STATA 10.0 (College Station, TX), and R version 3.1.0 [21].
Results
Data completeness of the enhanced surveillance programme exceeded 95 % for the study period. The enhanced surveil-lance system also allowed clinic data to be reviewed imme-diately upon monthly collection at the health facility, compared to a lag of three to six months or longer, which was common at that time within the routine HMIS sys-tem. Aggregated reported number of malaria cases in Lusaka District declined from 204,827 in 2009 to 130,374 in 2012 in conjunction with an actual decrease in the pro-portion of outpatients reported as malaria from 30.35 % in 2009 to 11.55 % in 2012 (Table 1).
Test positivity
Test positivity at each facility rarely exceeded 10 % even in the high transmission season (Fig. 1). The odds of an individual testing positive for malaria were 2.86 times greater in the high transmission season than in the dry season (Odds Ratio (OR) = 2.86, 95 % CI = 2.30–3.56). The enhanced vegetation index was not associated with test positivity (Table 2). From 2009 to 2010, results sug-gest a moderate decreasing trend of test positivity with the odds of testing positive decreasing by 0.024 each month (p= 0.092). From 2011 to 2012 results suggest an increas-ing trend in test positivity with the odds of testincreas-ing positive increasing by 0.042 each month (p= 0.026) (Table 2).
Improved testing rates
Before the implementation of the enhanced surveillance programme, 18.94 % of suspected malaria cases were tested with either microscopy or an RDT. Following the implementation of the enhanced surveillance programme, testing rates increased to 64.41 % with an immediate increase in January 2011 (Fig. 2a). The interrupted time series results suggest that the enhanced surveillance programme had a large impact on testing rates; the OR for a suspected malaria patient being tested was 1.54 (95 % CI = 0.96–2.49) following the introduction of the enhanced surveillance programme (Table 3). There was
no trend in testing rates before the enhanced surveillance programme (p= 0.487), but following its introduction, the odds of receiving a diagnostic test increased to 1.048 per month (p= 0.023).
Reporting confirmed malaria
In conjunction with the rising testing rates, the proportion of reported malaria that was unconfirmed by microscopy or RDT fell from 98.33 % before the implementation of the enhanced surveillance programme to 76.32 % after (Fig. 2b). The interrupted time series results suggest there was no change in the odds of a reported case being confirmed diagnostically before the enhanced surveil-lance programme (p= 0.511), and an increase of 0.090 per month in the odds of a reported case being con-firmed following the intervention (p= 0.002). Reported malaria cases were more likely to be confirmed during the wet season (OR = 2.57, 95 % CI = 2.12–3.12) and with lower total outpatient attendance (Table 4).
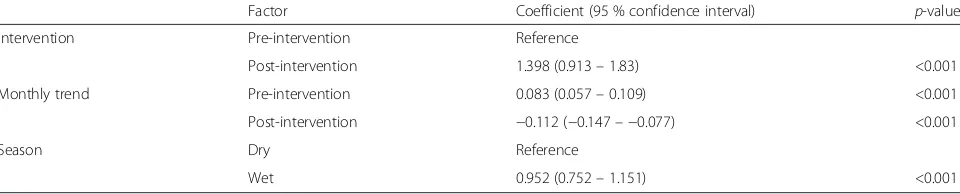
Malaria-related costs
ACT consumption also decreased from 242,140 in 2010 to 119,790 in 2012. Lab diagnostic costs increased dur-ing this time period in conjunction with the testdur-ing rates. The interrupted time series results suggest that before the implementation of the enhanced surveillance programme, malaria costs were rising approximately 8.3 % per month (Table 5). Immediately following the implementation of the enhanced surveillance programme, malaria costs were higher than before the enhanced surveillance programme, but thereafter decreased 11.2 % each month.
Agreement between HMIS data and clinic records
[image:4.595.56.539.656.733.2]Prior to the initiation of enhanced surveillance, there was only a moderate correlation (total malaria, r = 0.476) between data recorded in clinic registers and the num-ber of malaria cases actually reported to the HMIS (Fig. 3). During the enhanced surveillance period, these two datasets became not only more correlated (total malaria, r = 0.810), but the correlation increase was sig-nificant (z-score =−1.974,p= .048).
Table 1Total outpatient and malaria indicators reported through the enhanced surveillance programme in Lusaka, Zambia
2009–2012
Year Total outpatient consultations Reported malaria cases Percent outpatient consultations reported as malaria
Mean testing rate Mean test positivity
2009 674,824 204,827 30.35 % 18.94 % 6.41 %
2010 887,477 307,242 34.62 % 25.02 % 4.36 %
2011 911,230 209,945 23.04 % 51.04 % 4.26 %
Discussion
Clear benefits of the enhanced surveillance programme were observed during its implementation: a significant increase in the number of suspected cases being tested and a decrease in reported cases going unconfirmed. Costs associated with malaria treatment and diagnosis initially increased as testing rates increased with the im-plementation of the enhanced surveillance programme.
However, the initial rise in cost was followed by a steady downward trend of 11.2 % per month. Prior to the en-hanced surveillance programme, costs had been rising by 8.3 % per month. With 80 % of reported malaria still unconfirmed through diagnostics and a typical test posi-tivity < 10 %, further cost savings can be obtained if more unconfirmed malaria cases are tested first and not given ACT if testing negative.
0.00 0.05 0.10 0.15 0.20 0.25
1 2 3 4 5 6 7 8 9 10 11 12
Month of the year
Malaria test positivity rate
[image:5.595.58.540.88.438.2]Fig. 1Range of malaria test positivity by month from 2009 to 2012 at all health facilities in Lusaka, Zambia. There were no differences in malaria test positivity by year
Table 2Results from interrupted time series regression assessing the odds of testing positive for malaria in Lusaka District from
2009 to 2012. Standard errors have been adjusted for correlated data at the clinic level
Factor Odds ratio (95 % confidence interval) p-value
Monthly trend 2009–2010 0.976 (0.949–1.004) 0.092
2011–2012 1.042 (1.005–1.080) 0.026
Season Dry Reference
Wet 2.861 (2.297–3.564) <0.001
Enhanced Vegetation Index 1st tertile Reference
2nd tertile 1.157 (0.779–1.717) 0.454
3rd tertile 0.943 (0.560–1.589) 0.820
[image:5.595.57.539.613.725.2]Between 2009 and 2012, total reported malaria cases fell considerably. The largest decline was seen in the number of clinical malaria cases, those thought to be malaria by the clinical staff but which did not receive a confirmatory malaria test. The decrease in clinical mal-aria cases likely do not represent an actual decrease in true malaria burden, as test positivity actually increased
slightly. Rather, the enhanced surveillance programme likely contributed to increased confidence in the use of parasitological confirmations among patients by clini-cians and increased perception among facility staff that malaria is not a significant problem in the district resulting in much fewer clinical malaria cases being reported.
0.2 0.3 0.4 0.5 0.6 0.7
2010 2011 2012
Proportion
Suspected cases tested
0.8 0.9 1.0
2010 2011 2012
Proportion
Reported cases unconfirmed
0.10 0.15 0.20 0.25 0.30 0.35
2010 2011 2012
Proportion
Outpatients reportedly malaria
0 250 500 750 1000
2010 2011 2012
US Dollars
Facility expenditures on ACTs
a
b
c
d
[image:6.595.61.538.88.432.2]Fig. 2Clockwise from top left:amalaria testing rate,bproportion of reported malaria cases unconfirmed by microscopy or RDT,cproportion of total OPD that was reported as malaria, anddmean cost in ACT courses dispensed at each public clinic within Lusaka District from 2009 to 2012. Price of ACT in USD by pack size: 6′s = $0.36; 12′s = $0.72; 18′s = $1.08; 24′s = $1.30 (Medicine for Malaria Venture, USAID|Deliver, Zambia)
Table 3Results from interrupted time series regression assessing the odds of suspected cases being tested for malaria in Lusaka
District before and after the intervention of enhanced surveillance and feedback loop. Standard errors have been adjusted for correlated data at the clinic level
Factor Odds ratio (95 % confidence interval) p-value
Time period Pre-intervention Reference
Post-intervention 1.543 (0.956–2.491) 0.074
Monthly trend Pre-intervention 1.009 (0.983–1.036) 0.487
Post-intervention 1.048 (1.007–1.091) 0.023
Season Dry Reference
Wet 0.974 (0.845–1.123) 0.708
Total outpatient attendance Per 1,000 0.919 (0.883–0.956) <0.001
[image:6.595.58.539.613.726.2]Lack of diagnostic confirmation of malaria cases re-mains a major issue in Lusaka. In 2013, for example, 68 % of the 58,400 clinical cases reported in Lusaka Dis-trict were reported from just 6 clinics (23 %). Greater outpatient attendance was associated with decreased odds of receiving a malaria diagnostic test and decreased odds that reported malaria was diagnostically confirmed. Among the clinics with persistently high rates of report-ing unconfirmed malaria, the ability of facility staff to provide testing services to the number of patients seen remains a challenge. As the population growth of Lusaka outstrips the growth of more clinics and services, delays in receiving malaria diagnostics may increase. Where clinics struggle to offer testing services, screening at clinic registration, or shifting testing services to commu-nity level may be strategic solutions to improve malaria diagnostic and treatment rates.
Regular discussions with health facility staff during the feedback sessions influenced the perception of the mal-aria burden in their catchments. Prior to the initiation of the programme, health staff would comment on the high levels of malaria seen within their catchments; however, as the programme progressed, clinic staff directly ob-served data showing an increase in diagnostic use was associated with a decrease in unconfirmed reported mal-aria and the number of ACT dispensed. By the end of 2012, many staff recognised that the true burden of
malaria was actually very low. It is worth noting that the laboratory training and mentorship provided likely con-tributed to the success of the feedback sessions, highlight-ing that a multi-partner framework drawhighlight-ing on specialist areas contributes to the success of surveillance pro-grammes. Given this observed change, evidence-driven communication campaigns targeting health worker per-ceptions of malaria burden and the importance of diag-nostic testing may be appropriate in reducing perceived malaria burden in other areas with similar malaria transmission and burden profiles as Lusaka district.
[image:7.595.58.539.123.234.2]Despite testing rates exceeding 60 % following the im-plementation of enhanced surveillance, the proportion of malaria reported that was actually confirmed remained quite low at 24 %. In areas of low transmission such as in Lusaka, Zambia, with test positivity among suspected inci-dent cases < 10 % throughout the year, unconfirmed re-ported malaria cases are not likely to be actual malaria cases. Misdiagnosing these individuals and giving them ACT presents two serious problems. First, in areas of low transmission such as Lusaka, the patient is likely not treated for the illness that prompted them to seek care. As an example of the problem of over prescription of ACT, in an area of Tanzania with a similar malaria test positivity rate as reported in Lusaka, respiratory infections treatable with antibiotics were the most common cause of fever among outpatients seeking care [22] Treating these
Table 4Results from interrupted time series regression assessing the odds of reported malaria cases being confirmed via rapid
diagnostic test or microscopy for malaria in Lusaka District before and after the intervention of enhanced surveillance and feedback loop. Standard errors have been adjusted for correlated data at the clinic level
Factor Odds ratio (95 % confidence interval) p-value
Intervention Pre-intervention Reference
Post-intervention 1.206 (0.367–3.962) 0.748
Monthly trend Pre-intervention 0.987 (0.949–1.027) 0.511
Post-intervention 1.090 (1.036–1.146) 0.002
Season Dry Reference
Wet 2.571 (2.122–3.116) <0.001
Total outpatient attendance Per 1,000 0.919 (0.867–0.975) 0.007
N= 26 facilities and 851,574 reported malaria cases
Table 5Results from interrupted time series regression assessing the monthly log-transformed costs associated with malaria testing
and treatment in Lusaka District before and after the intervention of enhanced surveillance and feedback loop. Standard errors have been adjusted for correlated data at the clinic level
Factor Coefficient (95 % confidence interval) p-value
Intervention Pre-intervention Reference
Post-intervention 1.398 (0.913–1.83) <0.001
Monthly trend Pre-intervention 0.083 (0.057–0.109) <0.001
Post-intervention −0.112 (−0.147–−0.077) <0.001
Season Dry Reference
Wet 0.952 (0.752–1.151) <0.001
[image:7.595.58.538.628.725.2]individuals with an anti-malarial will be ineffective at best, but at worst may in fact increase morbidity and mortality [23]. Second, prescribing, and consuming drugs in the absence of the condition that they treat is a waste of money particularly egregious in resource-deprived set-tings. Understanding the aetiology and clinical diagno-sis of non-malaria fevers is therefore a critical step in further reducing reported malaria and in improving patient care in Lusaka District.
Pressure to give a malaria diagnosis is multifaceted and includes a clinician’s treatment preferences, pressure from patients to receive medicine for an illness, avail-ability of different medications, and the potential severity of missing a malaria infection [24]. Anecdotally, health practitioners in Lusaka District have indicated they are often pressured into prescribing anti-malarials in the ab-sence of, or in spite of a negative diagnostic test result, by their patients. It is possible that overconsumption is a reflection of the paucity of treatments available for
alternative diagnoses (e.g., antibiotics for respiratory in-fections). For example, when patients were provided with test results and alternative treatments in the case of negative malaria tests in Tanzania, patient pressure for anti-malarials reduced greatly [25]. A diagnostic algo-rithm requiring laboratory-confirmation for malaria in-fection before patients receive an anti-malarial has been implemented within Chelstone Clinic in Lusaka, result-ing in a 65 % reduction in ACT courses dispensed be-tween 2011 and 2012. Behaviour change communication campaigns to educate the community and urge patients to insist on receiving a diagnostic confirmation as well as modify the common perception that “fever equals malaria” could potentially help continue to reduce ACT over-consumption, as could behaviour change communi-cation campaigns targeted toward clinicians.
Significant cost savings for the malaria control programme have likely already accrued as a result of the enhanced sur-veillance programme through reduced ACT dispensing.
[image:8.595.55.539.89.446.2]Despite this, the number of ACT courses dispensed con-tinues to be much greater than the number of confirmed malaria cases. Further addressing the barriers to clinical reporting will improve the cost savings at the clinic level as well as at the district and NMCP levels. Additional benefit to the improved surveillance system has been a re-duction in the allocation of other malaria resources to Lusaka District, in favour of more malarious areas as well as targeting of indoor residual spraying resources within Lusaka (2014). Targeting malaria resources based on im-provements in surveillance ensures more efficient use of public and donor resources.
Given the low number of confirmed malaria cases identified, an additional component has been added to the enhanced surveillance programme: a reactive case detection system whereby confirmed cases are followed up to the household for foci detection and containment (Larsen et al. in preparation). This measure has been im-plemented to increase the sensitivity of the surveillance system to detect community-level malaria infections. Al-though Lusaka District has not been declared a malaria-elimination zone within Zambia, travel history, and other data necessary to substantiate malaria elimination are being collected in the hope that this area will soon report zero locally-acquired cases.
Progress towards both malaria control and eventual elimination are underpinned by high quality routine sur-veillance to determine the true malaria burden in an area. Further, in malaria control areas, accurate data are essential to know the overall burden of malaria as well as to identify hotspot areas so intervention resources can be applied wisely. The approach herein may be used in the short term to improve data capture and reporting practices, to increase adherence to best-practice policies, to inform local practitioners on the true burden of mal-aria in their area and to establish a robust foundation for the introduction of other interventions. Although the process of monthly supervision and data collection re-quires additional manpower to accomplish, local data clerks can be trained to systematically collect data, and over time health facilities will become accustomed to having record books available for monthly reviews. Fur-ther, in 2013, MOH clinics within Lusaka District as well as Southern, Central, and Western Province were transi-tioned to a system of weekly mobile-phone reporting of malaria data into the DHIS2, designed to support con-tinued flow of accurate and timely malaria data [26]. Data transmitted include aspects of OPD attendance, clinical, and confirmed malaria case numbers, testing rates (RDT, and microscopy) and ACT consumption. The utilization of this new system has improved the timeliness of the data as well as provided a feedback loop to ensure clinic staff can visualize data trends. Staff at all levels of the health system are now able to login to
the DHIS2 to view a dashboard displaying malaria data, which can highlight areas where specific clinics are achiev-ing success in establishachiev-ing high testachiev-ing rates or reducachiev-ing overconsumption of ACT. Through the dashboard, as-pects that need to be addressed at individual clinics are visualized. Clinic staff can review malaria trends at their clinic, as well as in comparison with other clinics. Malaria data for the entire district, province, and nation can also be reviewed and supervisors at all levels can use this system as a supervisory tool. The rollout of weekly reporting and DHIS2 in Lusaka District was intended, in many ways, to replace the monthly supervision visits con-ducted during the enhanced surveillance system. Initial trends, however, indicate continued supervision at clinic level is necessary, at least in some clinics, to maintain the achievements in quality reporting made through this programme. Continued work to identify best-practice methods for ensuring health staff are reviewing and under-standing data trends, and applying data knowledge to every-day clinical practice are being explored. These may include automated feedback mechanisms through DHIS2 and mobile phone technology to reduce the manpower re-quired for consistent supervision visits. While private clinics were not included in this programme, public-private partnerships could be explored to ensure max-imum data capture and harmonisation of best practices across the entire country.
Conclusions
The enhanced surveillance programme initiated in Lusaka District achieved its objectives of improving case manage-ment and reporting of malaria. Most notably, the malaria testing rate increased substantially despite having further room for improvement. To ensure sustainability, and avoid the creation of a parallel system, key features of the programme, (e.g., feedback loops between clinic, and DHMT, and rapid reporting mechanisms) are now being incorporated into the HMIS via DHIS2. Systems such as the one described here may be worthwhile to maintain until improved data reporting practices take hold to deter-mine the true burden of malaria in an area and to guide decision making on how to allocate limited malaria pre-vention and control resources.
Abbreviations
ACT:Artemisinin Combination Therapy; CI: Cumulative Incidence; DHIS2: District Health Information System 2.0; GRZ: Government of the Republic of Zambia; HMIS: Health Management Information System; MACEPA: Malaria Control and Elimination Partnership in Africa; MIS: Malaria Indicator Survey; MOH: Ministry of Health; NMCP: National Malaria Control Programme; RDT: Rapid Diagnostic Test.
Competing interests
The authors declare that they have no competing interests.
Authors’contributions
oversaw operations. ZC, AW, DJB, KT, AC, and MB reviewed manuscript drafts with DL leading final manuscript preparations. All authors read and approved the final manuscript.
Acknowledgements
Authors are grateful for the involvement of all MOH staff in the rollout of the enhanced surveillance programme. Specific recognition is given to Dr. Sichitamba Chibesa-Wamulume, whose tireless efforts towards the health of her country, including this programme, continue to inspire us all. Support for the enhanced malaria surveillance programme was provided by the Ministry of Health, the President’s Malaria Initiative, the U.S. Agency for International Development, and PATH MACEPA. This publication was made possible through support provided by the President’s Malaria Initiative, U.S. Agency for International Development, under the terms of an Interagency Agreement with CDC. The opinions expressed herein are those of the author (s) and do not necessarily reflect the views of the U.S. Agency for International Development and the Centers for Disease Control and Prevention.
Author details
1Akros, Cresta Golfview Grounds, Great East Road, Unit 5, Lusaka, Zambia. 2Department of Public Health, Food Studies and Nutrition, Syracuse
University, Syracuse, NY, USA.3PATH Malaria Control and Elimination
Partnership in Africa (MACEPA), National Malaria Control Centre, Chainama Hospital College Grounds, Great East Road, Lusaka, Zambia.4Department of
Public Health and Research, National Malaria Control Centre, Ministry of Health, P.O. Box 32509, Lusaka, Zambia.5Lusaka District Health Management
Team, Ministry of Health, Lusaka, Zambia.6Malaria Branch and US President’s
Malaria Initiative, Centers for Disease Control and Prevention, Atlanta, GA, USA.7University of Montana School of Public and Community Health
Sciences, Missoula, MO, USA.
Received: 15 October 2014 Accepted: 20 May 2015
References
1. Rowe AK, Kachur SP, Yoon SS, Lynch M, Slutsker L, Steketee RW. Caution is required when using health facility-based data to evaluate the health impact of malaria control efforts in Africa. Malar J. 2009;8:209.
2. Breman J. The ears of the hippopotamus: manifestations, determinants, and estimates of the malaria burden. Am J Trop Med Hyg. 2001;64:1–11. 3. Agyepong IA, Kangeya-Kayonda J. Providing practical estimates of malaria
burden for health planners in resource-poor countries. Am J Trop Med Hyg. 2004;71:162–7.
4. Cao J, Sturrock HJW, Cotter C, Zhou S, Zhou H, Liu Y, et al. Communicating and monitoring surveillance and response activities for malaria elimination: China’s‘1–3–7’strategy. PLoS Med. 2014;11:e1001642.
5. Hay S, Smith D, Snow R. Measuring malaria endemicity from intense to interrupted transmission. Lancet Infect Dis. 2008;8:369–78.
6. Chilundo B, Sundby J, Aanestad M. Analysing the quality of routine malaria data in Mozambique. Malar J. 2004;3:3.
7. Nsubuga P, Eseko N, Tadesse W, Ndayimirije N, Stella C, McNabb S. Structure and performance of infectious disease surveillance and response, United Republic of Tanzania, 1998. Bull World Health Organ. 2002;80:196–203. 8. Cibulskis RE, Bell D, Christophel E-M, Hii J, Delacollette C, Bakyaita N, et al.
Estimating trends in the burden of malaria at country level. Am J Trop Med Hyg. 2007;77:133–7.
9. de Savigny D, Binka F. Monitoring future impact on malaria burden in Sub-Saharan Africa. Am J Trop Med Hyg. 2004;71:224–31.
10. Yukich JO, Bennett A, Albertini A, Incardona S, Moonga H, Chisha Z, et al. Reductions in artemisinin-based combination therapy consumption after the nationwide scale up of routine malaria rapid diagnostic testing in Zambia. Am J Trop Med Hyg. 2012;87:437–46.
11. Ministry of Health. Assessment of the Health Information System in Zambia. Lusaka: Government of Zambia; 2007.
12. Ministry of Health, National Malaria Control Centre: National Malaria Strategic Plan 2011–2015. Lusaka: Zambia Ministry of Health; 2011. 13. Ministry of Health: Zambia National Malaria Indicator Survey 2006. Lusaka:
Zambia Ministry of Health; 2006.
14. Ministry of Health: Zambia National Malaria Indicator Survey 2008. Lusaka: Zambia Ministry of Health; 2008.
15. Ministry of Health: Zambia National Malaria Indicator Survey 2010. Lusaka: Zambia Ministry of Health; 2010.
16. Ministry of Health: Zambia National Malaria Indicator Survey 2012. Lusaka: Zambia Ministry of Health; 2012.
17. Masaninga F, Chanda E, Chanda-Kapata P, Hamainza B, Masendu HT, Kamuliwo M, et al. Review of the malaria epidemiology and trends in Zambia. Asian Pac J Trop Biomed. 2013;3:89–94.
18. Hay SI, Guerra CA, Tatem AJ, Atkinson PM, Snow RW. Urbanization, malaria transmission and disease burden in Africa. Nat Rev Microbiol. 2005;3:81–90. 19. Tatem AJ, Gething PW, Smith DL, Hay SI. Urbanization and the global
malaria recession. Malar J. 2013;12:133.
20. Hijmans RJ, van Etten J. Geographic analysis and modeling with raster data. 2012.
21. R Development Core Team. R: a language and environment for statistical computing; 2010. http://www.R-project.org/.
22. D’Acremont V, Kaiser L, Genton B. Causes of fever in outpatient Tanzanian children. N Engl J Med. 2014;370:2243–4.
23. Reyburn H, Mbatia R, Drakeley C, Carneiro I, Mwakasungula E, Mwerinde O, et al. Overdiagnosis of malaria in patients with severe febrile illness in Tanzania: a prospective study. BMJ. 2004;329:1212.
24. Chandler CIR, Jones C, Boniface G, Juma K, Reyburn H, Whitty CJM. Guidelines and mindlines: why do clinical staff over-diagnose malaria in Tanzania? A qualitative study. Malar J. 2008;7:53.
25. Chandler CIR, Mwangi R, Mbakilwa H, Olomi R, Whitty CJM, Reyburn H. Malaria overdiagnosis: is patient pressure the problem. Health Policy Plan. 2008;23:170–8.
26. Rapid reporting systems: tracking data to defeat malaria. [http:// www.path.org/publications/files/MCP_macepa_rapid_reporting_fs.pdf].
Submit your next manuscript to BioMed Central and take full advantage of:
• Convenient online submission
• Thorough peer review
• No space constraints or color figure charges
• Immediate publication on acceptance
• Inclusion in PubMed, CAS, Scopus and Google Scholar
• Research which is freely available for redistribution