The reduction of the effect of the Müller–Lyer illusion on
saccade amplitude by classic adaptation
Paul C Knox
Directorate of Orthoptics and Vision Science, University of Liverpool, Brownlow Hill, Liverpool L69 3GB, UK; e-mail:[email protected]
Received 14 June 2010, in revised form 9 August 2010; published online 5 November 2010
Abstract. The effect of Müller–Lyer stimuli on saccade amplitude varies across studies. One methodological difference between studies is stimulus display time; studies with long stimulus display times tend to report smaller effects than studies with short display times. Is it possible that long display times might provide conditions in which saccade adaption takes place? Five adult subjects were exposed to runs of the same illusion-inducing Müller–Lyer stimulus, presented for 1 s, interspersed with probe trials in which a point target was presented for 200 ms. While saccade amplitude was consistently larger with ‘in-configurations’ than with ‘out-configurations’ at the beginning of runs, amplitude declined over runs with the in-configuration. On average, it was constant in out-configuration runs. The net effect was a decline in the apparent effect size (in-amp −out-amp / out-amp) of the Müller–Lyer stimulus. Probe trial saccade amplitude increased in ‘out’ runs and decreased in ‘in’ runs. These effects were not present in control experiments, in which stimulus display time was 200 ms. One explanation for this pattern of results is that long stimulus presentation times allow for the generation of retinal error signals. This in turn leads to saccade adaptation, causing an underestimation of the effect of this type of stimulus on saccade amplitude.
Keywords:saccades, adaptation, Müller–Lyer illusion
1 Introduction
The ‘two visual systems’ hypothesis (TVSH) of Milner and Goodale (1995) proposed a division of labour between the two anatomical cortical subsystems processing visual information in the primate cortex. They suggested that the dorsal subsystem provided analysis necessary for the visual guidance of actions, whereas the ventral subsystem specialised in object perception and recognition. One intriguing line of evidence providing support for the TVSH emerged from experiments in which the effects of visual illusions (which by definition induce misperceptions) were examined to determine whether motor responses to such stimuli exhibited comparable ‘mis-actions’. Some studies reported perception–action dissociations (as the TVSH predicted), while others failed to observe them. There then ensued considerable debate on the extent of dissociations and on the conditions that best promoted the resistance of actions to illusions (Bruno2001; Carey2001; Franz2001; Milner and Dyde2003).
While many illusion experiments involved actions of the hand and arm, some have inves-tigated the effect of illusory stimuli on a different class of motor actions—eye movements, particularly saccadic eye movements (Binsted and Elliot1999; Dassonville et al2004; Wong and Mack1981). Given that saccades are critically dependent on areas classically assigned to the dorsal stream (see Munoz2002), consistent evidence showing that they were influenced by illusions would pose a problem for the TVSH. However, again a contradictory picture emerged, with some studies reporting that saccades were affected by illusions and others reporting that they were substantially immune to the effects of illusions.
is. The size of the perceptual effect is of the order of 20% (Bernardis et al2005; de Grave et al 2006a; McCarley and Grant2008). When we investigated the effect of this type of stimulus on saccade amplitude, we found that primary saccade amplitude to the in-configuration was consistently greater than for a control condition which did not induce a perceptual effect and was consistently smaller than the control condition with the out-configuration (Bernardis et al2005; Knox and Bruno2007). We found that the perceptual and saccade effects were of the same direction and of approximately the same amplitude. While there have been other reports of similar large effects on saccade amplitude (eg de Grave et al2006a), some studies have reported much smaller effects (eg Binsted and Elliot1999).
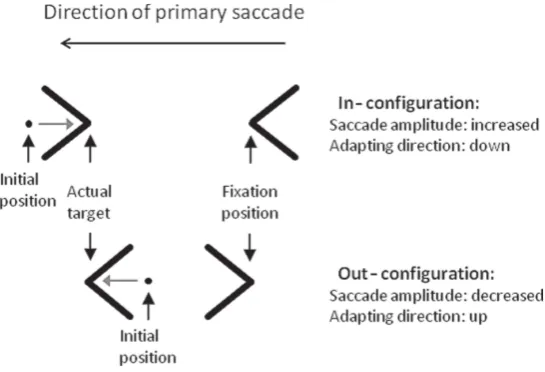
Figure 1.The wings-only version of the Müller–Lyer illusion-inducing stimulus as used in these experiments. Stimuli were organised such that one vertex was positioned at fixation (fixation position), with the configuration being completed by the eccentric vertex (actual target). These examples are leftward stimuli. Subjects were also presented with rightward stimuli. If saccades land long with in-configurations (at the initial position), and the target vertex is still present, a retinal error signal will be generated (initial position−actual position) that will drive adaptation in the direction of a reduction in saccade gain.
Of the various aspects of methodology that differ between saccade studies utilising the family of Müller–Lyer stimuli, one in particular is of interest for present purposes. In a number of studies that have reported large effects on saccade amplitude (Bernardis et al 2005; de Grave et al2006b; Knox and Bruno2007) short stimulus display times (200 ms or less) were used, while in those reporting small effects either display time was much longer or not controlled (Binsted and Elliot1999; McCarley et al2003). If a particular display were to induce (for whatever reason) inaccurate saccades, and when those saccades landed the visual stimulus was still present (as would occur with long stimulus display times), then there is scope for the generation of retinal error signals. The generation of consistent retinal error signals causes saccade adaptation—that is, saccade gain is altered to adjust the saccade landing position (McLaughlin1967; Noto and Robinson2001; Wallman and Fuchs1998). This is an adaptive process in that, in normal circumstances, it leads to the elimination of retinal error signals and the restoration of accurate saccades.
the saccade lands (initial position) and the target position (the vertex) generating a retinal error signal, such that saccade gain might be reduced over trials with in-stimuli and increased with out-stimuli (grey arrows). Thus, in an illusion experiment with a long display time, over a number of trials the apparent effect of the stimulus on saccade amplitude might be reduced. In order to investigate whether such an adaptive process is generated by illusion-inducing stimuli, runs of single Müller–Lyer stimuli (similar to those illustrated infigure 1) were presented to subjects in successive trials. While even in ideal circumstances saccade adaptation is variable both within and between subjects, as is the effect of Müller–Lyer stimuli on saccade amplitude, the hypothesis was that over a run of trials the apparent difference in saccade amplitude to in-configuration and out-configuration stimuli would be reduced.
2 Methods
2.1 Participants
Five healthy adult subjects participated in the experiment. All were naive to the purposes of the experiment, although three had participated in previous oculomotor experiments. Sub-jects provided their informed consent, and the experiments were performed in accordance with the ethical standards laid down in the 1964 Declaration of Helsinki.
2.2 Displays and apparatus
Stimuli were presented on a 21-inch monitor (1024 x 768 spatial resolution, 100 Hz temporal resolution) driven by a VSG2/5 card (Cambridge Research Systems, Rochester, UK), which subjects viewed from 57 cm. Horizontal eye position of the left eye was recorded using a Skalar Iris IR Eye Tracker. Eye-tracker output was sampled at 1 kHz and digitized with 16-bit precision using a CED Power 1401 (Cambridge Electronic Design, Cambridge, UK). A chinrest and cheek pads were used to ensure head stabilisation.
Each subject first completed a run of thirty-two calibration trials in which stimuli (0.3-deg black squares on a light background) were presented six times at each of four positions aligned with the monitor centre, two to the left (5 deg and 10 deg from the centre of the display) and two to the right. Subjects were instructed to accurately fixate each stimulus until it disappeared after 1 s. They were then exposed to runs of 150 trials, which were composed of three distinct trial types. The first twenty trials were preadaptation trials in which, after a variable fixation time (0.5 – 1.5 s), a single point target (a 0.3-deg square) appeared 6 deg to either the left or right of fixation and remained illuminated for 1 s. There then followed the first block of twenty ‘adapting’ trials in which, after a variable fixation time, the same Müller–Lyer stimulus appeared for 1 s organised such that one vertex was placed at fixation with the other positioned 6 deg eccentrically (seefigure 1). The block of adapting trials was followed by six probe trials (three left, three right) in which a single point target was presented at 6 deg for 200 ms. A total of five alternating adapting and probe blocks were presented. In four separate runs, on different days, each subject was exposed to in-configurations and out-configurations, to the left and to the right. Subjects also competed two further control runs with leftward in-configurations and out-configurations. These were identical to the main runs with the exception that in the ‘adapting’ blocks the stimulus display time was reduced to 200 ms.
2.3 Analysis
measurements. Calibration data were used to transform the amplitude data from arbitrary system units into units of degrees of eye rotation. Only saccades with latencies greater than 80 ms from target onset were analysed. Where the response consisted of a sequence of saccades, data from these trials were not included in the analysis unless the first saccade in the sequence was at least 50% of the required amplitude (ie, 3 deg). In this case, the amplitude of that first saccade was included. Some trials were lost due to blinks or unstable fixation. Amplitudes and latencies were collated using Microsoft Excel, and statistical analysis conducted using SPSS.
In order to compare primary saccade amplitudes across runs and subjects, for each subject in each run the saccade amplitude was normalised using the average amplitude observed in the preadaptation trials while preserving trial order. Data were collapsed across direction. For each adapting trial an intersubject mean normalised amplitude was then calculated. From these data, block means were calculated—that is, the mean normalised amplitude over each of the five blocks of twenty adapting trials. Block means were also calculated for each of the five probe blocks in each run. In order to identify any systematic alteration in saccade amplitude as runs progressed, linear regression analysis was used. The size of the effect of the Müller–Lyer stimulus was also calculated using a percent effect measure similar to that used previously (Bernardis et al2005; Knox and Bruno2007):
In-amplitude−Out-amplitude Out-amplitude ×100
3 Results
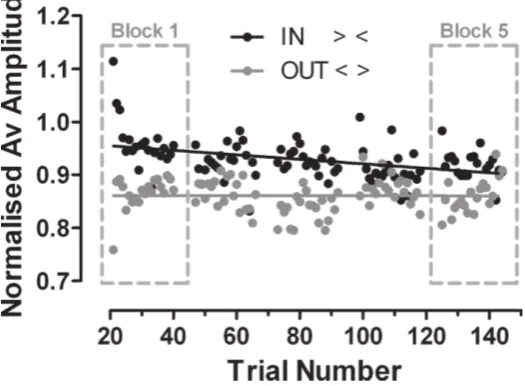
[image:4.595.166.429.504.697.2]As expected, saccade amplitude was larger when subjects were exposed to in-configurations, compared with out-configurations (figure 2). Comparing the block means for the first adapting block, mean (±SD) normalised amplitude was 0.95±0.12 with the in-configuration, compared with 0.87±0.08 for the out-configuration. This difference was statistically signifi-cant (paired t-test,t=2.67,d f =4,p=0.03), and for the first adapting block equates to an effect size of 10%.
However, as can also be seen fromfigure 2, there were systematic changes in saccade amplitude over adapting blocks. The least-squares linear regression lines of amplitude on trial number appeared to converge. In the main this was because the line fitted to the ‘in’ data had a negative slope (significantly nonzero:F1,98=20.02,p<0.001), whereas the line fitted to the ‘out’ data had a slope which was not significantly different to 0 (F<1). A comparison of the two regression lines also demonstrated a statistically significant difference between their slopes (F1,196=11.07,p=0.001).
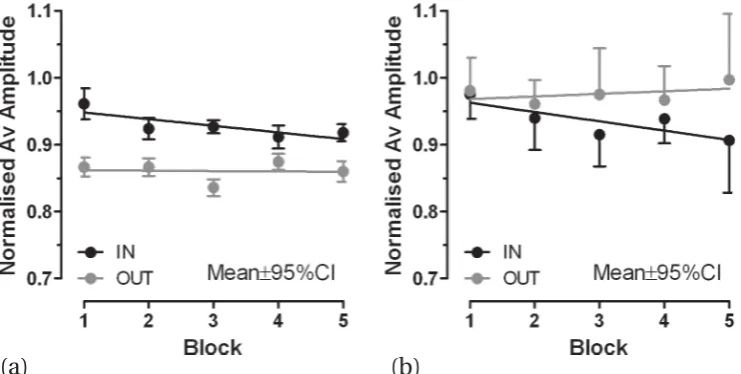
[image:5.595.113.484.340.527.2]The net effect of this convergence was that the apparent effect size of the illusory stimuli on saccade amplitude was reduced. This is further illustrated infigure 3a, where the block means (±95%CI) are shown as well as the regression lines. For block 5 the effect size was 7%, compared with 10% for block 1. The block means for the probe tasks are plotted in figure 3b. Note that in these tasks subjects executed a saccade not to an illusion-inducing stimulus but to a point stimulus presented for 200 ms. In block 1 there was no apparent difference in amplitude between probe tasks embedded in in-runs and out-runs. However, saccade amplitude in probe trials slightly increased for out-runs and decreased for in-runs. A comparison of the slopes of the two regression lines showed that there was a statistically significant difference between their slopes (F1,6 =5.99,p=0.049).
Figure 3.(a) Block means (±95%CI) for the adapting trial data plotted in figure 2. Lines are the regression lines shown in figure 2, calculated from the underlying trial-by-trial data. (b) Blocked means (‘in’−95%CI, ‘out’+95%CI error bars shown to improve clarity) for probe trial data from adapting runs. Note that, while adapting blocks were composed of twenty trials, probe blocks consisted of only six trials.
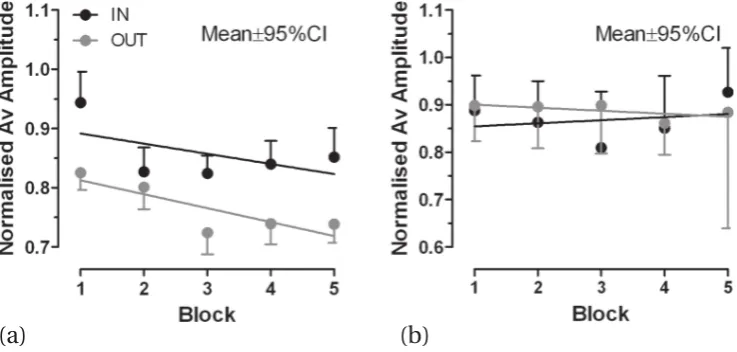
differ from what was observed in the main runs (figure 3b). Now there was no evidence of a change in probe trial amplitude over blocks.
Figure 4.Data from the control experiment (only leftward stimuli used) in which target display time in adapting trials was 200 ms. (a) Block means (in + 95%CI, out−95%CI error bars shown to improve clarity) for the adapting blocks. Lines are the regression lines calculated from the underlying trial-by-trial data. (b) Block means (in + 95%CI, out−95%CI error bars shown to improve clarity) for probe trial data from control runs.
4 Discussion
A number of studies have demonstrated that Müller–Lyer stimuli, both of the type used here [the wings only version (eg Bernardis et al2005; Knox and Bruno2007)] and the Brentano version (eg de Grave et al2006b; Digirolamo et al2008), modify saccade amplitude. Saccades to the in-configuration tend to overshoot the target vertex, whereas saccades to the out-configuration undershoot it. Thus, saccades are affected in the same direction as perception (overestimation of vertex separation with in-configurations and underestimation with out-configurations). Debate has centred around the size of the effect on saccade amplitude and what might influence it (Knox and Bruno2007; McCarley et al2003). The aim of the current experiment was to establish whether a saccade-specific mechanism, saccade adaptation, might explain, in part, the differences between studies. Saccade adaptation might be expected to occur where trial-by-trial retinal errors are produced. Conditions encouraging saccade adaptation (long target display times, single configuration orientation, and amplitude) might lead to small apparent illusion effects being observed, whereas conditions in which adaptation is less likely to occur (short target display times, multiple orientations, and amplitudes) might lead to larger effects.
presentation of single configurations, effect sizes have also tended to be small (eg Binsted and Elliot1999; Tegetmeyer and Wenger2004).
A small effect of the Müller–Lyer stimuli on saccade amplitude necessarily meant that any retinal error signals generated in the current experiments must have also been relatively small. However, the results from both adapting and probe trials suggest that adaptation occurred. With the in-configuration saccade, amplitude was reduced across runs. This is consistent with saccades landing long while the target vertex was still present, generating a retinal error signal that led to the reduction in saccade gain and a decrease in amplitude, as outlined infigure 1. There appeared to be little or no effect on saccade amplitude with the out-configuration. The probe trial data from out-configuration runs did suggest that saccade gain might be slightly increasing. But, again, the effect was smaller than the decrease observed for probe trials from in-configuration runs.
This asymmetry is a well recognised feature of saccade adaptation even in ideal circum-stances. Experimentally, saccade adaptation is typically investigated using a double-step paradigm in which, after a saccade is initiated to a target, the target is moved to a new position (Deubel et al1986; McLaughlin1967). The change in target position is not detected, a retinal error is generated, and adaptation over a number of trials is the result. However, use of a backward step in order to reduce amplitude (‘backward’ adaptation) always proceeds faster and produces larger amplitude changes than using a forward step to increase amplitude [reviewed and discussed in Hopp and Fuchs (2004)]. The asymmetry observed in the current experiment is thus typical of classic saccade adaptation.
The size of the adaptation effect in the current experiment is small. However, this is again consistent with what is known about saccade adaptation. Full adaptation is never observed; up to 60% to 70% adaptation of the step amplitude has been reported for human backward adaptation (Miller et al1981; Semmlow et al1989). Usually much larger target amplitudes are used than in the current experiment, and perhaps more importantly, much larger and more consistent errors of up to 50% of target amplitude are used to induce adaptation. Indeed, error consistency has recently been shown to have an important bearing on adaptation in humans (Havermann and Lappe2010). In the current experiment a smaller, more indirect, and more variable mechanism was being used—the Müller–Lyer stimulus effect. So the small degree of adaptation is not surprising.
When target display time was reduced to 200 ms in the control experiment, there was little evidence of adaptive changes in saccade amplitude. A display time of 200 ms was chosen because it was used in previous experiments in which large illusion effects were observed (Bernardis et al2005; Knox and Bruno2007), and it guarantees that the stimulus will be removed when (inaccurate) saccades land. This means that in the control experiment we expect there to be no generation of retinal error signals and therefore no adaptation. This appears to be the case. Although saccade amplitude declined over runs with both in-configurations and out-configurations, there was little evidence of the convergence in amplitude observed in the main runs. And whereas there did appear to be alterations in saccade gain in the expected direction in probe trials from the main runs, probe trial amplitude in the control runs, while variable, did not appear to be modified. Finally, as with the main experiment, the general size of the effect (7% – 9%) was still smaller than we had observed previously.
2010)]. However, the current results suggest that saccade adaptation can be induced by such stimuli when conditions allow the generation of retinal error signals.
References
Bernardis P, Knox P, Bruno N, 2005 “How does action resist visual illusion? Uncorrected oculomotor information does not account for accurate pointing in peripersonal space”Experimental Brain Research162133–144doi:10.1007/s00221-004-2121-9 J
Binsted G, Elliot D, 1999 “The Muller–Lyer illusion as a perturbation to the saccadic system”Human Movement Science18103–117doi:10.1016/S0167-9457(98)00038-4 J
Bruno N, 2001 “When does action resist visual illusions?”TICS5385–388 J
Carey D P, 2001 “Do action systems resist visual illusions?”TICS5109–113 J
Dassonville P, Bridgeman B, Kaur Bala J, Thiem P, Sampanes A, 2004 “The induced Roelofs ef-fect: two visual systems or the shift of a single reference frame?”Vision Research44 603–611
doi:10.1016/j.visres.2003.10.017 J
de Grave D D J, Franz V H, Gegenfurtner K R, 2006a “The influence of the Brentano illusion on eye and hand movements”Journal of Vision6727–738doi:10.1167/6.7.5 J
de Grave D, Smeets J, Brenner E, 2006b “Why are saccades influenced by the Brentano illusion?”
Experimental Brain Research175177–182doi:10.1007/s00221-006-0536-1 J
Deubel H, Wolf W, Hauske G, 1986 “Adaptive gain control of saccadic eye movements” Human Neurobiology5245–253 J
Digirolamo G J, McCarley J S, Kramer A F, Griffin H J, 2008 “Voluntary and reflexive eye movements to illusory lengths”Visual Cognition1668–89doi:10.1080/13506280701339160 J
Franz V H, 2001 “Action does not resist visual illusions”TICS5457–459 J
Gilster R, Kuhtz-Buschbeck J, 2010 “The Müller–Lyer illusion: investigation of a center of gravity effect on the amplitudes of saccades”Journal of Vision101–33doi:10.1167/10.1.11 J
Havermann K, Lappe M, 2010 “The influence of the consistency of postsaccadic visual errors on saccadic adaptation”Journal of Neurophysiology1033302–3310doi:10.1152/jn.00970.2009 J
Hopp J J, Fuchs A F, 2004 “The characteristics and neuronal substrate of saccadic eye movement plasticity”Progress in Neurobiology7227–53doi:10.1016/j.pneurobio.2003.12.002 J
Knox P, Bruno N, 2007 “When does action resist visual illusion? The effect of Müller–Lyer stimuli on reflexive and voluntary saccades”Experimental Brain Research181277–287 doi:10.1007/s00221-007-0927-y J
McCarley J, Grant C, 2008 “State-trace analysis of the effects of a visual illusion on sac-cade amplitudes and perceptual judgments” Psychonomic Bulletin & Review 15 1008–1014
doi:10.3758/PBR.15.5.1008 J
McCarley J, Kramer A, DiGirolamo G, 2003 “Differential effects of the Muller-Lyer illusion on reflexive and voluntary saccades”Journal of Vision3751–760doi:10.1167/3.11.9 J
McLaughlin S, 1967 “Parametric adjustment in saccadic eye movements”Perception & Psychophysics 2359–362 J
Miller J M, Anstis T, Templeton W B, 1981 “Saccadic plasticity: Parametric adaptive control by retinal feedback” Journal of Experimental Psychology Human Perception & Performance 7356–366
doi:10.1037/0096-1523.7.2.356 J
Milner A D, Goodale M A, 1995The visual brain in action(Oxford: Oxford University Press) J
Milner D, Dyde R, 2003 “Why do some perceptual illusions affect visually guided action, when others don't?”Trends in Cognitive Sciences710–11doi:10.1016/S1364-6613(02)00004-9 J
Munoz D P, 2002 “Saccadic eye movements: overview of neural circuitry progress”Brain Research 14089 –96 J
Noto C T, Robinson F R, 2001 “Visual error is the stimulus for saccade gain adaptation”Cognitive Brain Research12301–305doi:10.1016/S0926-6410(01)00062-3 J
Semmlow L, Gauthier G, Vercher J-L, 1989 “Mechanisms of short-term saccadic adaptation”Journal of Experimental Psychology Human Perception & Performance15 249–258 doi:10.1037/0096-1523.15.2.249 J
Tegetmeyer H, Wenger A, 2004 “Influence of visual perception on spatial coding of saccadic eye movements and fixation”Neuro-Ophthalmology28197–204doi:10.1080/01658100490887931 J
Wallman J, Fuchs A F, 1998 “Saccadic gain modification: visual error drives motor adaptation”
Journal of Neurophysiology802405–2416 J
Wong E, Mack A, 1981 “Saccadic programming and perceived location”Perception & Psychophysics 48123–131 J
Copyright©2010 P C Knox