Predicting and modifying response to
neoadjuvant therapy in colorectal cancer
This thesis is submitted in accordance with the
requirements of the University of Liverpool for the
degree of Doctor in Philosophy
By
Paul Anthony Sutton
i Dedication
ii Declaration
The work presented in this thesis was carried out in the Institute of Translational Medicine, University of Liverpool and was undertaken while working as a research fellow at the Liverpool Cancer Research (UK) Centre. The material contained within this thesis has not been, nor is currently being presented wholly, or in part, for any other degree or
qualification.
I declare that all the work presented in this thesis has been carried out by me except where indicated below:
Cation exchange prior to iTRAQ analysis was performed by Mrs Jane Hamlett iTRAQ mass spectrometry was performed by Dr Roz Jenkins
Assessment of radiological response was performed by Dr G Abbott
Histopathological assessment of tumour response was performed by Dr M Terlizzo and Dr T Andrews
Exome sequencing was performed at Genotypic Technology
iii Acknowledgments
I am indebted to the many people who have helped me over the last few years. First and foremost my supervisors: Professor Dan Palmer, Dr Chris Goldring, Mr Hassan Malik and Mr Dale Vimalachandran. Thank you for your endless support, enthusiasm and patience as I attempted to make the transition from clinician to scientist.
I’d also like to thank my ‘room-mate’, Dr Neil Kitteringham, who provided endless advice and guidance as well as acting as a sounding board and telling me when I was wrong. I feel extremely lucky to have been trained by you.
One of the most challenging aspects of this work was the bioinformatics analysis, for which I am grateful for the time and assistance of Dr Puthen V Jithesh.
I am also grateful to all the staff in the Medical Research Council Centre for Drug Safety Science who assisted me in the acquisition of laboratory technique, in particular Dr Cliff Rowe and Dr Jo Henry.
The work presented in this thesis required the establishment of a regional network of colorectal surgeons to facilitate the recruitment of patients and collection of clinical samples. As such I am grateful to the following collaborators for their help and support:
Trust Principal Investigator
Royal Liverpool and Broadgreen Mr Paul Rooney
Aintree University Hospital Mr Hassan Malik
Countess of Chester Hospital Mr Dale Vimalachandran
Arrowe Park Hospital Mr Ciaran Walsh
Clatterbridge Centre for Oncology Professor Dan Palmer Mid Cheshire Hospital (Leighton) Mrs Caroline Bruce
St Helens and Knowsley Hospital Mr Ajai Samad
Liverpool Heart and Chest Hospital Mr Michael Shackcloth
iv
East Cheshire Hospital Mr Usman Khan
Royal Bolton Hospital Mr David Smith
North Wales Health Board Dr Simon Gollins
Warrington and Halton Hospital Mr Mark Tighe
My fellow surgical trainees have also made the research process much easier, and I wish to thank Mr Rob Jones, Mr Jonathan Evans, Mr Derek McWhirter, Mr David Bowden and Mr Declan Dunne.
I am grateful to Professor John Neoptolemos both for his mentorship, and for affording me this opportunity.
v Contents
Dedication i
Declaration ii
Acknowledgements iii
Contents v
Abstract vii
List of Tables viii
List of Figures xv
Abbreviations xxi
Chapter 1 – General Introduction 1
1.1 Epidemiology of colorectal cancer 2
1.2 Risk factors for colorectal cancer 3
1.3 Genetics of colorectal cancer 3
1.4 Staging of colorectal cancer 9
1.5 Treatment of colorectal cancer with surgery 18
1.6 Treatment of colorectal cancer with radiotherapy 24 1.7 Chemotherapeutic agents used in colorectal cancer 29 1.8 Treatment of colorectal cancer with chemotherapy 35
1.9 Asssessment of response to chemoradiotherapy 43
1.10 Predictive and prognostic markers in colorectal cancer 49
1.11 Summary 58
1.12 Aims, hypotheses and study plan 59
Chapter 2 - Evaluation of a tissue stabilisation gel (AllprotectTM)
to facilitate clinical sampling for translational research in surgical trials 63
2.1 Introduction 64
2.2 Methods 66
2.3 Results 71
2.4 Discussion 81
Chapter 3 - Exome sequencing of synchronously resected primary colorectal tumours and colorectal liver metastases to inform
oncosurgical management 86
3.1 Introduction 87
3.2 Methods 91
3.3 Results 96
vi
Chapter 4 - A global proteomic assessment of patient matched primary
and metastatic colorectal tumours 126
4.1 Introduction 127
4.2 Methods 131
4.3 Results 137
4.4 Discussion 168
Chapter 5 - A global proteomic assessment of serial rectal tumour biopsies 177
5.1 Introduction 178
5.2 Methods 180
5.3 Results 184
5.4 Discussion 203
Chapter 6 – Targeted analysis of candidate biomarkers in the primary tumour for predicting response to neoadjuvant chemotherapy in
colorectal liver metastases 208
6.1 Introduction 209
6.2 Methods 212
6.3 Results 226
6.4 Discussion 251
Chapter 7 – Concluding Discussion 261
7.1 Summary of aims and experimental design 262
7.2 Summary of results 263
7.3 Advances in the literature 267
7.4 Study limitations and further work 269
7.5 Review of hypotheses 270
7.6 Conclusions 271
Bibliography 273
Appendix 1 - Lists of single nucleotide variants from exome sequencing 299
Appendix 2 - Genetic variants in colorectal cancer identified by next
generation sequencing studies 329
Appendix 3 - Proteomic comparison of metastatic tumour and normal
adjacent liver parenchyma 337
Appendix 4 - Proteomic comparison of responders and non-responders
in the primary tumour 353
vii Abstract
Background Colorectal cancer is the fourth commonest cancer in the UK, and the second commonest cause of cancer-related death. A knowledge of the biology of colorectal liver metastases would be invaluable to inform clinical decision making; however, deriving this information from the metastatic lesions is not feasible until after resection. We aimed to use proteomic and genomic analysis to establish the degree of biological similarity across disease sites and identify biomarkers in the primary tumour which predict response to neoadjuvant chemotherapy in liver metastases. An identical approach was also used to identify predictors of response to neoadjuvant chemoradiotherapy in rectal cancer. Methods Fresh tissue from both primary colorectal tumour and liver metastases from 16 patients was subjected to proteomic analysis using isobaric tagging for relative
quantification (iTRAQ). Data were analysed with Protein Pilot (Ab Sciex, Framingham, MA, USA), with stratification of patients into those showing low or high response to
chemotherapy permitting the identification of potential predictive biomarkers. These markers were subsequently investigated by immunohistochemistry on a tissue microarray of 56 patients, in parallel with a series of in vitro studies to investigate the concordance between primary and metastatic tumours of those proteins relevant to the activation and metabolism of 5-FU, irinotecan and oxaliplatin. The therapeutic potential of the identified biomarkers was also investigated by dosing SW480 cells with irinotecan/5FU with or without inhibition (using siRNA or a known competitive inhibitor) of the proteins of interest. Four of the 16 patients studied were resected synchronously, and tissue from these was also used for exome sequencing using the Ion Proton platform. Diagnostic, post-treatment and resection biopsies from 8 patients with rectal cancer were again subjected to iTRAQ with stratification into low or high response to neoadjuvant chemoradiotherapy to investigate potential response biomarkers.
Findings We identified 5766 discrete proteins, of which 2.54% were differentially expressed between primary and metastatic tumours. There were 170 potential response biomarkers in the primary tumour and 27 in the metastases. Two proteins were common to both tissue types and showed consistent dysregulation, including NQO1. Immunostaining of NQ01 in metastases revealed lower expression in patients responding to chemotherapy (p=0.041), with a significant correlation between primary and metastatic disease sites (r=0.44,
p=0.001). Knockdown of NQO1 followed by treatment with irinotecan and 5FU reduced the IC50 from 100.1µM to 49.8µM and from 200.1µM to 25.0µM respectively. Pre-treating cells with dicoumarol prior to incubation in irinotecan and 5FU reduced the IC50 from 100.0µM to 50.0µM and from 183.7µM to 49.9µM respectively. Exome sequencing identified 585 non-synonymous missense SNVs of which 215 (36.8%) were unique to the primary tumour, 226 (38.6%) unique to the metastasis and 81 (13.8%) present in patient matched pairs. Aberrations in the ErbB pathway were identified in paired samples (ratio 0.07, p=5.87x10⁻⁷),
which were validated by Sanger sequencing along with a potential response biomarker in the CDAN1 gene. Changes to the phenotype of the rectal tumour with chemoradiotherapy were modest, although it is clear that base excision repair (and in particular PARP1) remains of interest, and that acid ceramidase is a potential response biomarker and novel
radiosensitiser.
viii List of Tables
Table Legend Page
1.1 Percentage of cases and 5 year relative survival (%) by Dukes' stage at diagnosis for colorectal cancer patients diagnosed 1996-2002 in England. (Reproduced without permission from Cancer Research (UK)).
2
1.2 Genetics of inherited colorectal tumour syndromes. (Reproduced without permission from Fearon, 2011).
4 1.3 Summary of evidence highlighting complications from percutaneous needle
biopsy of colorectal liver metastases. (Reproduced without permission from Cresswell, Welsh and Rees, 2009).
13
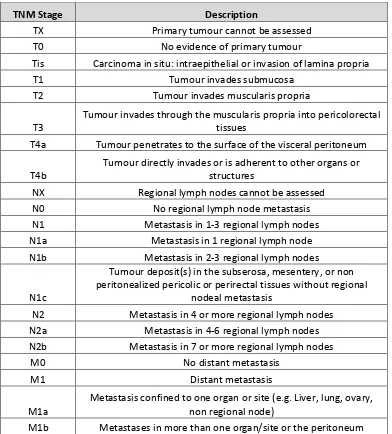
1.4 UICC/AJCC TNM staging of colorectal cancer; 7th edition (2010). Available
online at https://cancerstaging.org/references-ools/quickreferences/Pages/default.aspx
15
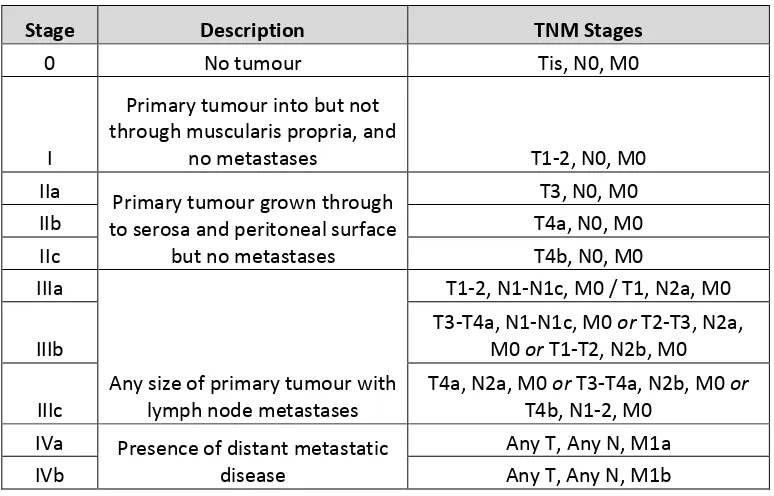
1.5 UICC/AJCC stage groupings for colorectal cancer; 7th edition (2010).
Available online at https://cancerstaging.org/references-ools/quickreferences/Pages/default.aspx.
16
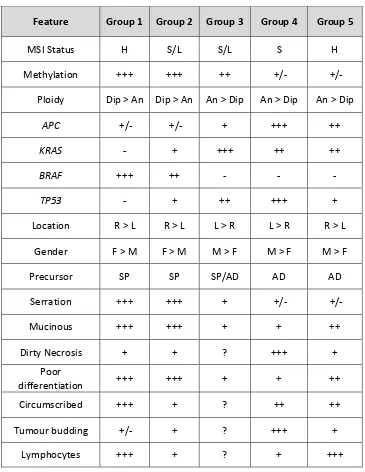
1.6 The Jass classification combines a number of patient, histopathological and genetic factors to allocate tumours to a group (1-5). MSI, microsatellite instability; H, high; S, stable; L, low; Dip, diploid; An, aneuploid; Serration, serrated morphology; SP, serrated polyp; AD, adenoma; Circumscribed, circumscribed invasive margin. Reproduced without permission from Jass, 2007.
17
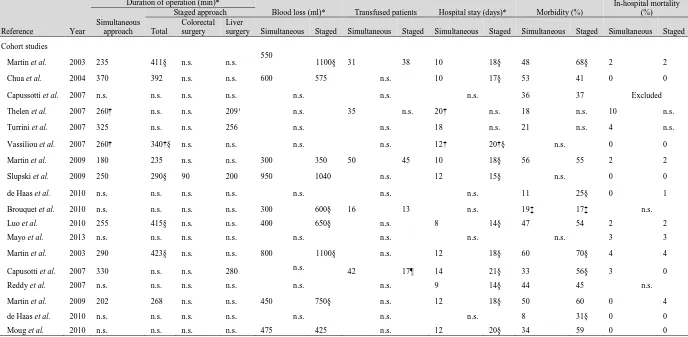
1.7 Summary of recent evidence pertaining to the synchronous management of liver limited metastatic colorectal cancer. Reproduced with permission from Lykoudis et al (2014). References: Martin et al; J Am Coll Surg (2003); 197; 233-241, Chua et al; Dis Colon Rectum (2004); 47; 1310-1316,
Capussotti et al; Ann Surg Oncol (2007); 14; 195-201, Capussotti et al, Ann Surg Oncol (2007); 14; 1143-1150, Reddy et al; Ann Surg Oncol (2007); 14; 3481-3491, Thelen et al; Int J Colorectal Dis (2007); 14; 3481-3491, Turrini et al; Eur J Surg Oncol (2007); 33; 735-740, Vassiliou et al; World J
Gastroenterol (2007); 13; 1431-1434, Martin et al; J Am Coll Surg (2009); 208; 842-850, Slupski et al; Can J Surg (2009); 52; E241-E244, Brouquet et al, J Am Coll Surg (2010); 210; 934-941, de Haas et al; Br J Surg (2010); 97; 1279-1289, Luo et al; J Gastrointest Surg (2010); 14; 1974-1980, Moug et al; Eur J Surg Oncol (2010); 36; 365-370, Mayo et al; J Am Coll Surg (2013); 216; 707-716.
23
1.8 The tumour regression grade proposed by Dworak, Keilholz and Hoffmann (1997) extends from 0-4 and includes an assessment of tumour mass as well as the degree of fibrosis and/or vasculopathy. Reproduced without permission from Santos et al, 2014.
46
1.9 The Basingstoke Prognostic Index allocates a score (out of 30) based on a number of clinicopathological features. Validated for use in both the pre- and post-operative situations, the score correlates well with outcome.
51
1.10 Prognostic biomarkers identified for colorectal cancer. The table
demonstrates the frequency with which these biomarkers are identified, the evidence for its correlation with prognosis and its uptake into routine clinical practice. Reproduced without permission from Pritchard and Grady, 2011.
55
1.11 Predictive biomarkers identified for colorectal cancer. The table
demonstrates the frequency with which these biomarkers are identified,
ix
the evidence for its correlation with response to treatment and its uptake into routine clinical practice. EGFR, epidermal growth factor receptor; 5-FU, 5- fluorouracil; LOH, loss of heterozygosity. Reproduced without
permission from Pritchard and Grady, 2011.
2.1 Representative results following DNA extraction from patient 2 (primary tumour). Comparable quality control indices are seen highlighting the suitability of extracted DNA for downstream qPCR analysis. Comparable results following KRAS genotyping are seen: the patient is KRAS mutant at codon 12 but wild type at codons 13 and 61.
73
3.1 Demographic and clinical features of the four patients from whom tumours were sequenced. IrMdG – Irinotecan and modified de Gramont
(5-fluoruracil and folinic acid).
96
3.2 Quality control data from samples undergoing exome sequencing with Ion Proton. Sample ID column identifies samples as follows: SO_2510 relates to project id; 1-4 relate to patient number; A-D relate to tissue type (A – colonic mucosa, B – primary tumour, C – liver parenchyma, D – liver metastasis). All quality control variables and yield were good, with the exception of the colonic mucosa from patient 4. DNA was suboptimal but still adequate for sequencing.
97
3.3 Total number of raw reads through Ion Proton exome sequencing. 98 3.4 Sequencing statistics for all samples. Sample ID (column 1) 1-4 relates to
patient number, and A-D tissue type (A: normal mucosa, B: colorectal primary tumour, C: normal liver parenchyma, D: liver metastasis). The report attests to a high number of reads successfully on target, a 1x coverage of 96.58 – 98.07% and 20x coverage of 67.61 – 88.33% of the targeted exome.
99
3.5 Total number of high quality variants identified through Ion Proton exome sequencing.
100 3.6 Total number of somatic, non-synonymous, missense, biologically
deleterious SNVs identified in each of the tumour samples.
101 3.7 Pathway analysis for SNVs unique to the primary tumours. P-value is
adjusted using Benjamini-Hochberg correction. Ratio identifies the number of focus genes identified (numerator) in the pathway (denominator).
101
3.8 Network analysis for SNVs unique to the primary tumours. The score is derived from a p-value and indicates the probability of the focus genes in a network being found together due to random chance. Focus molecules is the total number of SNVs of interest identified in the respective network.
103
3.9 Pathway analysis for SNVs unique to the metastatic tumours. P-value is adjusted using Benjamini-Hochberg correction. Ratio identifies the number of focus genes identified (numerator) in the pathway (denominator).
103
3.10 Network analysis for SNVs unique to the metastatic tumours. The score is derived from a p-value and indicates the probability of the focus genes in a network being found together due to random chance. Focus molecules is the total number of SNVs of interest identified in the respective network.
105
3.11 Pathway analysis for SNVs present in at least one primary and metastatic tumour pertaining to the same patient. P-value is adjusted using
Benjamini-Hochberg correction. Ratio identifies the number of focus genes identified (numerator) in the pathway (denominator).
106
3.12 Network analysis for SNVs present in at least one primary and metastatic tumour pertaining to the same patient. The score is derived from a p-value and indicates the probability of the focus genes in a network being found
x
together due to random chance. Focus molecules is the total number of SNVs of interest identified in the respective network.
3.13 Pathway analysis for SNVs unique to the responding tumours. P-value is adjusted using Benjamini-Hochberg correction. Ratio identifies the number of focus genes identified (numerator) in the pathway (denominator)
109
3.14 Network analysis for SNVs unique to the responding tumours. The score is derived from a p-value and indicates the probability of the focus genes in a network being found together due to random chance. Focus molecules is the total number of SNVs of interest identified in the respective network.
110
3.15 Pathway analysis for SNVs unique to the non-responding tumours. P-value is adjusted using Benjamini-Hochberg correction. Ratio identifies the number of focus genes identified (numerator) in the pathway (denominator).
111
3.16 Network analysis for SNVs unique to the non-responding tumours. The score is derived from a p-value and indicates the probability of the focus genes in a network being found together due to random chance. Focus molecules is the total number of SNVs of interest identified in the respective network.
113
3.17 Those SNVs identified for validation with Sanger sequencing. 114 3.18 Summary of the Sanger sequencing for 12 SNVs of interest in 8 samples
(matched primary and metastatic tumours from 4 patients). The fields displayed in red highlight the location of SNVs identified through Ion Proton sequencing, with the content of the fields representing the identified base(s) on Sanger sequencing. Those marked undetermined failed due to inability to detect the amplicon.
115
3.19 Summary of next generation sequencing papers published on colorectal cancer.
120 3.20 Some of the ErbB inhibitors currently in clinical use (only ones approved by
the Federal Drug Administration are shown). Adapted from Roskoski, 2004. 122 4.1 Clinical, demographic and disease characteristics of the 16 patients
recruited to this study. Eleven patients underwent neoadjuvant
chemotherapy, the remainder proceeding straight to surgery. Six patients were simultaneously resected. There was considerable variation in location of the primary tumour, disease stage and grade as well as metastatic burden.
139
4.2 Details of neoadjuvant chemotherapy agents and response evaluation. Five patients were chemonaive and 11 underwent neoadjuvant treatment. One of these patients failed to undergo resection of the liver metastasis. Response evaluation data is therefore available for 10 patients, 5 of which had a tumour regression grade of 1-2 (responders) with the remaining 5 having a tumour regression grade of 3-4 (non-responders).
140
4.3 Those proteins differentially expressed between the primary tumour and normal colorectal mucosa. 25 proteins were identified, 6 of which were upregulated (positive values for fold change) and 19 downregulated (negative values for fold change).
142
4.4 Pathway analysis for proteins both upregulated and downregulated in the primary tumour when compared to normal adjacent colorectal mucosa. P-value is adjusted using Benjamini-Hochberg correction. Ratio identifies the number of focus molecules identified (numerator) in the pathway
(denominator).
143
xi
primary tumour when compared to normal adjacent colorectal mucosa. The score is derived from a p-value and indicates the probability of the focus molecules in a network being found together due to random chance. Focus molecules is the total number of proteins of interest identified in the respective network.
4.6 Those proteins differentially expressed between the metastatic tumour and normal colorectal mucosa. 53 proteins were identified, 13 of which were upregulated (positive values for fold change) and 40 downregulated (negative values for fold change).
147
4.7 Pathway analysis for proteins both upregulated and downregulated in the metastatic tumour when compared to normal adjacent colorectal mucosa. P-value is adjusted using Benjamini-Hochberg correction. Ratio identifies the number of focus molecules identified (numerator) in the pathway (denominator).
147
4.8 Network analysis for proteins both upregulated and downregulated in the metastatic tumour when compared to normal adjacent colorectal mucosa. The score is derived from a p-value and indicates the probability of the focus molecules in a network being found together due to random chance. Focus molecules is the total number of proteins of interest identified in the respective network.
149
4.9 Pathway analysis for proteins both upregulated and downregulated in the metastatic tumour when compared to normal adjacent colorectal mucosa. P-value is adjusted using Benjamini-Hochberg correction. Ratio identifies the number of focus molecules identified (numerator) in the pathway (denominator).
150
4.10 Network analysis for proteins both upregulated and downregulated in the metastatic tumour when compared to normal adjacent liver parenchyma. The score is derived from a p-value and indicates the probability of the focus molecules in a network being found together due to random chance. Focus molecules is the total number of proteins of interest identified in the respective network.
154
4.11 Those proteins differentially expressed between the metastatic tumour and the primary tumour. 67 proteins were identified, 58 of which were upregulated (positive values for fold change) and 9 downregulated (negative values for fold change).
156
4.12 Pathway analysis for proteins both upregulated and downregulated in the metastatic tumour when compared to the primary tumour. P-value is adjusted using Benjamini-Hochberg correction. Ratio identifies the number of focus molecules identified (numerator) in the pathway (denominator).
157
4.13 Network analysis for proteins both upregulated and downregulated in the metastatic tumour when compared to the primary tumour. The score is derived from a p-value and indicates the probability of the focus molecules in a network being found together due to random chance. Focus molecules is the total number of proteins of interest identified in the respective network.
158
4.14 Pathway analysis for proteins both upregulated and downregulated in the primary tumours of the responders compared to the primary tumours of the non responders. P-value is adjusted using Benjamini-Hochberg correction. Ratio identifies the number of focus molecules identified (numerator) in the pathway (denominator).
159
xii
primary tumours of the responders compared to the primary tumours of the non responders. The score is derived from a p-value and indicates the probability of the focus molecules in a network being found together due to random chance. Focus molecules is the total number of proteins of interest identified in the respective network
4.16 Those proteins differentially expressed between the metastatic tumours of the responders and non-responders. 27 proteins were identified, 17 of which were upregulated (positive values for fold change) and 10 downregulated (negative values for fold change).
163
4.17 Pathway analysis for proteins both upregulated and downregulated in the metastatic tumours of the responders compared to the metastatic tumours of the non responders. P-value is adjusted using Benjamini-Hochberg correction. Ratio identifies the number of focus molecules identified (numerator) in the pathway (denominator).
164
4.18 Network analysis for proteins both upregulated and downregulated in the metastatic tumours of the responders compared to the metastatic tumours of the non responders. The score is derived from a p-value and indicates the probability of the focus molecules in a network being found together due to random chance. Focus molecules is the total number of proteins of interest identified in the respective network.
165
4.19 Summary of predictive biomarkers common to both primary and metastatic tumours.
167 4.20 Summary proteomic data for the 2-group comparisons showing the total
number of dysregulated proteins as well as those up/downregulated.
168 5.1 Response evaluation for patients having serial rectal cancer biopsies. The
percentage viable tumour is displayed along with corresponding tumour regression grade (TRG). Those patients with TRG 1-2 were considered responders (patients 1, 2, 4 and 6) and patients with TRG 3-4 were considered non-responders (patients 3, 5, 7 and 8).
185
5.2 Clinical and demographic data for patients having serial rectal cancer biopsies. 8 patients were studied, all of which were male ranging in age from 50-78 and Dukes’ stage B-D. Two different neoadjuvant
chemotherapeutic regimens were used alongside a number of different surgical interventions for formal resection of the rectal tumour
184
5.3 Those proteins differentially expressed between rectal tumours post chemoradiotherapy and diagnostic samples. 18 proteins were identified, 2 of which were downregulated (negative values for fold change) and 16 upregulated (positive values for fold change).
187
5.4 Pathway analysis for proteins both upregulated and downregulated in the rectal tumours post chemoradiotherapy compared to the diagnostic samples. P-value is adjusted using Benjamini-Hochberg correction. Ratio identifies the number of focus molecules identified (numerator) in the pathway (denominator).
188
5.5 Network analysis for proteins both upregulated and downregulated in the rectal tumours post chemoradiotherapy compared to the diagnostic samples. The score is derived from a p-value and indicates the probability of the focus molecules in a network being found together due to random chance. Focus molecules is the total number of proteins of interest identified in the respective network.
189
5.6 Those proteins differentially expressed between rectal tumours at
xiii
proteins were identified, 30 of which were downregulated (negative values for fold change) and 9 upregulated (positive values for fold change). 5.7 Pathway analysis for proteins both upregulated and downregulated in the
rectal tumours at resection compared to immediately following completion of chemoradiotherapy. P-value is adjusted using Benjamini-Hochberg correction. Ratio identifies the number of focus molecules identified (numerator) in the pathway (denominator).
192
5.8 Network analysis for proteins both upregulated and downregulated in the rectal tumours at resection compared to immediately following completion of chemoradiotherapy. The score is derived from a p-value and indicates the probability of the focus molecules in a network being found together due to random chance. Focus molecules is the total number of proteins of interest identified in the respective network.
193
5.9 Those proteins differentially expressed between rectal tumours at resection and at diagnosis. 29 proteins were identified, 10 of which were downregulated (negative values for fold change) and 19 upregulated (positive values for fold change).
195
5.10 Pathway analysis for proteins both upregulated and downregulated in the rectal tumours at resection compared to at diagnosis. P-value is adjusted using Benjamini-Hochberg correction. Ratio identifies the number of focus molecules identified (numerator) in the pathway (denominator).
195
5.11 Network analysis for proteins both upregulated and downregulated in the rectal tumours at resection compared to at diagnosis. The score is derived from a p-value and indicates the probability of the focus molecules in a network being found together due to random chance. Focus molecules is the total number of proteins of interest identified in the respective network.
198
5.12 Those proteins differentially expressed between the primary tumours of the responders and non-responders. 8 proteins were identified, 3 of which were downregulated (negative values for fold change) and 5 upregulated (positive values for fold change).
199
5.13 Pathway analysis for proteins both upregulated and downregulated in the primary tumours of the responders compared to the primary tumours of the non-responders. P-value is adjusted using Benjamini-Hochberg correction. Ratio identifies the number of focus molecules identified (numerator) in the pathway (denominator).
200
5.14 Network analysis for proteins both upregulated and downregulated in the primary tumours of the responders compared to the primary tumours of the non-responders. The score is derived from a p-value and indicates the probability of the focus molecules in a network being found together due to random chance. Focus molecules is the total number of proteins of interest identified in the respective network.
202
5.15 Summary proteomic data for the 2-group comparisons showing the total number of dysregulated proteins as well as those up/downregulated.
203 6.1 Antibody incubation conditions for the proteins of interest with respect to
the activation and metabolism of chemotherapeutics.
213 6.2 Preparation of standard controls for mass spectrometry analysis of
irinotecan conversion to SN-38 by human CES1/CES2.
214 6.3 Median densitometry values for thymidylate synthase (TS),
dihydropyrimidine dehydrogenase (DPYD) and orotate
xiv
and metastatic tumours. Correlation co-efficients (with Spearman’s rank test) showed positive correlations although these did not reach statistical significance.
6.4 Median densitometry values for carboxylesterase 1 (CES1), carboxylesterase 2 (CES2), topoisomerase I (TOP I), UDP
glucuronosyltransferase 1A1 (UGT1A1) and cytochrome P450 3A4 (CYP3A4) expression in patient matched primary and metastatic tumours.
Correlation co-efficients (with Spearman’s rank test) showed positive correlations, reaching statistical significance in the case of TOP I.
232
6.5 SN38 production in patient matched primary tumour, liver metastasis and liver parenchyma. Of the 12 patients studied there were significant
differences between tissue types (by ANOVA) in all except two (highlighted in red). When specifically comparing the primary and metastatic tumours, significant differences (by student’s paired t-test) were seen in all except four (also highlighted in red).
235
6.6 KRAS (codon 12, 13 and 61), BRAF (codon 600 and 601) and microsatellite instability analysis for 16 patients undergoing resection at both sites for liver limited stage IV colorectal cancer. Five patients had KRAS codon 12 mutation, one patient had BRAF 600/601 mutation and one patient was MSI-Low.
237
6.7 Key clinical and pathological variables in the chemo-naive, responders and non-responders. Continuous data was assessed for significance using ANOVA* and categorical data using the X2 test#. Only T stage was
considerably different between groups, with a greater proportion of T4 tumours in the chemo-naive group.
239
6.8 NQO1 expression in the responders and non-responders grouped by percentage of positively stained cells. No statistically significant difference was observed in the primary tumours (p=0.470) however in the
metastases, NQO1 staining is considerably higher in the non-responders compared to the responders (p=0.041, X2 test).
xv List of Figures
Figure Legend Page
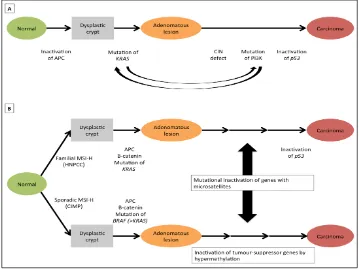
1.1 Suggested genetic model for colorectal cancer. In (a) a number of hereditary and sporadic mutations drive the transformation of normal epithelia to an adenomatous lesion and latterly carcinoma. In (b) an inherited or acquired defect in DNA mismatch repair (MMR) function is the initiator for carcinogenesis. (Adapted from Fearon, 2011).
9
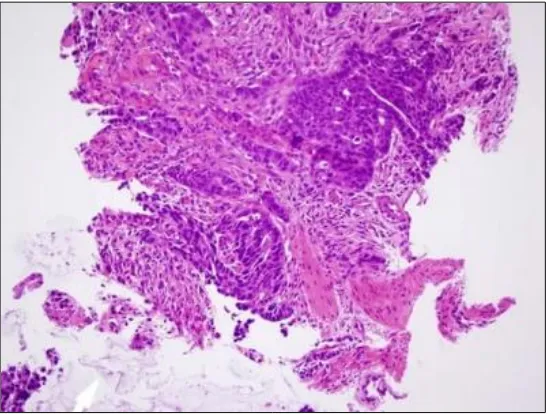
1.2 Invasive colonic adenocarcinoma penetrating the muscularis mucosa; stained with haematoxylin and eosin. Photomicrograph taken at x200 magnification.
12
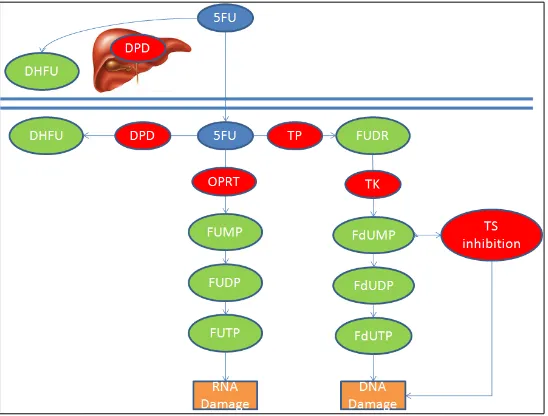
1.3 5-Fluorouracil metabolism – 5-fluorouracil (F-FU) is converted to three main metabolites: fluorodeoxyuridine monophosphate (F-dUMP), fluorodeoxyuridine triphosphate (FUTP) and fluorouridine triphosphate (FUTP). The main mechanism of 5-FU activation is conversion to
fluorouridine monophosphate (FUMP) by orotate
phosphoribosyltransferase (OPRT). FUMP is then phosphorylated to fluorouridine disphoaphate (FUDP) and again to fluorouridine triphosphate (FUTP). Alternatively, thymidine phosphorylase (TP) can activate 5-FU by catalysing the conversion of 5-FU to fluorodeoxyuridine (FUDR) which is then phosphorylated by thymidine kinase (TK) to FdUMP. FdUMP can be phosphorylated to fluorodeoxyuridine diphosphate (FdUDP) and again to fluorodeoxyuridine triphosphate (FdUTP). 80% of 5-FU is catabolised in the liver by dihydropyrimidine dehydrogenase (DPYD). Adapated from Longley, Harkin and Johnston, 2003.
31
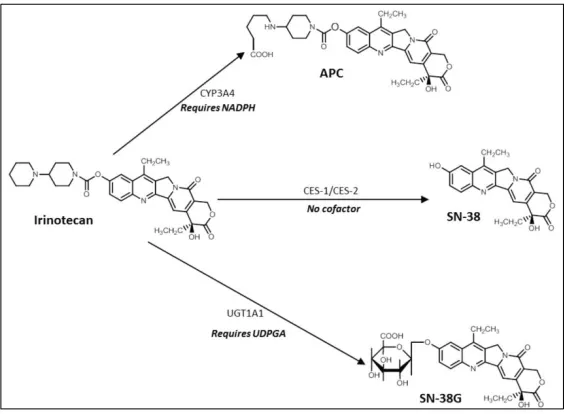
1.4 The metabolism of irinotecan (CPT-11). Irinotecan is converted to the active metabolite SN38 by carboxylesterase (CE), as well as to two other inactive metabolites (NPC and APC) by CYP3A4. NPC can subsequently be converted by SN-38 by CE. Inactivation to SN38-G is predominantly
controlled by UGT1A1, however the inactive metabolite can be re-activated to SN38 by β-glucuronidation. Adapted from Mathijssen et al, 2001.
33
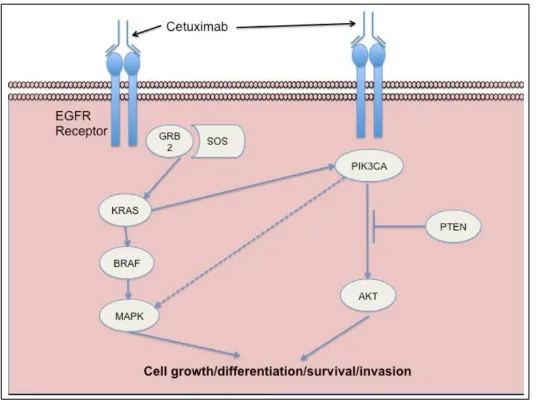
1.5 Binding of a ligand (EGF, TGFα) to EGFR stimulates receptor dimerisation, tyrosine kinase activation, EGFR autophosphorylation and ultimately initiates signal transduction cascades involved in cell proliferation and survival. Inhibition of EGFR by the monoclonal antibody cetuximab inhibits these downstream events. Adapted from Kirkpatrick, Graham and Muhsin, 2004.
35
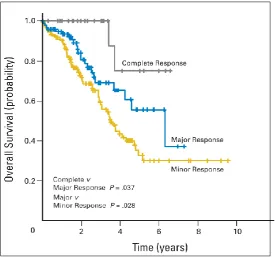
1.6
Kaplan-Meir survival curves of patients with colorectal liver metastases treated with neoadjuvant chemotherapy, with greatest survival in those with complete response (a) followed by major response (b) and minor response (c). Reproduced with permission from Blazer et al, 2008.
48
1.7 The Cancer Research (UK) roadmap to the discovery, development and validation of a clinically useful biomarker. Available online at
http://www.cancerresearchuk.org.
53
2.1 A schematic outline of the stability study. The available tissue was divided into 10 fragments, 5 of which were stabilised immediately in one of the storage conditions shown and the remaining 5 in a similar manner but at the end of the procedure. The study was designed to ask two specific questions: can sampling wait until the end of the procedure, and what is the optimal storage condition?
67
xvi
into 10 fragments, one of which was immediately snap frozen in liquid nitrogen and transferred to a -80oC freezer (control sample) and one was
archived in AllprotectTM for each of the time points shown in the figure.
2.3 Representative micrographs of H&E stained sections of colorectal liver metastases showing a) tissue snap frozen in liquid nitrogen and b) tissue stabilised in AllprotectTM. Both are clearly identifiable as adenocarcinoma,
although contain a degree of clear cell change/vacuolation (X). Histological appearances did not change significantly with the length of the time the sample was exposed to AllprotectTM. Micrographs were taken at 200x
magnification.
71
2.4 Cycle threshold (Ct) values for miR-122 in the colorectal liver metastasis from patient 1. All samples are comparable irrespective of the method of tissue stabilisation used, and whether the samples were stabilised immediately following specimen extraction (samples 1-5) or following a delay of 1 hour (samples 6-10). ANOVA with post-hoc Dunnett’s test shows that no samples are statistically significant from the current gold standard (sample 1) i.e. tissue snap frozen in liquid nitrogen.
74
2.5 Western blot and corresponding densitometry of HMGB1 expression in primary colorectal cancer samples from patient 1. All samples are comparable irrespective of the method of tissue stabilisation used, and whether the samples were stabilised immediately following specimen extraction (samples 1-5) or following a delay of 1 hour (samples 6-10). ANOVA with post-hoc Dunnett’s test shows that no samples are statistically significant from the current gold standard (sample 1) i.e. tissue snap frozen in liquid nitrogen.
75
2.6 Western blot and corresponding densitometry of CES1 expression in colorectal liver metastasis samples from patient 2. All samples are comparable irrespective of the method of tissue stabilisation used, and whether the samples were stabilised immediately following specimen extraction (samples 1-5) or following a delay of 1 hour (samples 6-10). ANOVA with post-hoc Dunnett’s test shows that no samples are statistically significant from the current gold standard (sample 1) i.e. tissue snap frozen in liquid nitrogen.
76
2.7 Tissue homogenate was incubated with irinotecan and the production of SN-38 (active metabolite) quantified by liquid-chromatography mass-spectrometry. Data shown is from patient 3 (primary colorectal tumour). All samples are comparable irrespective of the method of tissue
stabilisation used, and whether the samples were stabilised immediately following specimen extraction (samples 1-5) or following a delay of 1 hour (samples 6-10). ANOVA with post-hoc Dunnett’s test shows that no samples are statistically significant from the current gold standard (sample 1) i.e. tissue snap frozen in liquid nitrogen.
77
2.8 Immunohistochemistry for HMGB1 in samples from patient 3 (primary colorectal tumour): a) Negative control b) Snap frozen in liquid nitrogen c) AllprotectTM at room temperature d) AllprotectTM at 8oC. All sections were
scored 3 for coverage (51-74%) and 3 for intensity (moderate). Haemotoxylin counterstain, x400 magnification.
78
2.9 Cycle threshold (Ct) values for miR122 in the liver metastasis from patient 4. Ct values increase with time archived in AllprotectTM, and by 2 weeks
there is a statistically significantly difference from the current ‘gold standard’, i.e. tissue snap frozen in liquid nitrogen (0).
xvii
2.10 Western blot and corresponding densitometry of HMGB1 expression in primary colorectal cancer samples (patient 1) archived in AllprotectTM . The
densitometric panels demonstrate the sharp reduction in protein abundance which occurs between 1 and 3 weeks, by which time it is statistically significantly different from the current ‘gold standard’, i.e. tissue snap frozen in liquid nitrogen (0).
80
3.1 The sequencing by synthesis of the Ion Proton platform. Sequencing is performed on a semiconductor chip containing small beads with clonally amplified template DNA. DNA polymerase is added with sequentially unmodified A, C, G or T dNTPs which are incorporated if complementary, releasing a hydrogen ion which is results in decreased pH that triggers an ion sensor in the chip. If the nucleotide is not complementary, no reaction takes place within that well. The unmodified dNTPs are then flushed out of the system and the next added. Figure taken from the European
Bioinformatic Institute (with permission)
http://www.ebi.ac.uk/training/online/course/ebi-next-generation- sequencing-practical-course/what-next-generation-dna-sequencing/ion-torre.
89
3.2 Bioinformatics analysis workflow for exome sequencing of synchronously resected primary colorectal tumours and colorectal liver metastases.
94 3.3 The ErbB signalling pathway was identified as the most statistically
significant pathway arising from analysis of the SNVs present in at least one primary and metastatic tumour pertaining to the same patient. The focus genes in which the SNVs have arisen are highlighted in purple.
107
4.1 Samples are reduced and undergo a tryptic digest before being tagged with an isotope labelled molecule. These tags all have the same molecular weight although the reporter and balance moieties vary. After a cation exchange cleanup step the samples undergo nanoLC-MS/MS. The reporter and balance moieties are cleaved from each other and from the peptide to which they are bound, the ratio of which helps determine relative
abundance. The peptide is also cleaved into fragment ions used to identify the protein.
129
4.2 Bioinformatics analysis workflow for global proteomic assessment of patient matched primary and metastatic colorectal tumours.
136
4.3 Venn diagram of predictive biomarkers identified in the primary tumour (170), metastatic tumour (27) and common to both (5).
166 5.1 Samples are reduced and undergo a tryptic digest before being tagged with
an isotope labelled molecule. These tags all have the same molecular weight although the reporter and balance moieties vary. After a cation exchange cleanup step the samples undergo nanoLC-MS/MS. The reporter and balance moieties are cleaved from each other and from the peptide to which they are bound, the ratio of which helps determine relative
abundance. The peptide is also cleaved into fragment ions used to identify the protein.
179
5.2 Bioinformatics analysis workflow for global proteomic assessment of serial rectal tumour biopsies.
183 5.3 The base excision repair (BER) signalling pathway was identified as being
highly significant, with this data set suggesting downregulation induced by chemoradiotherapy. Only one of the 12 focus molecules was identified – PARP1 (highlighted in purple).
196
xviii
significantly downregulated pathway in the diagnostic samples of those primary tumours responding to chemoradiotherapy. Only 1 of the 6 focus molecules was identified – acid ceramidase (highlighted in purple). 6.1 Antibody optimisation of NQO1 demonstrating the optimal concentration
of antibody (1/1000) in the positive controls (left) and negative controls (right) of colonic mucosa (A) and breast cancer (B).
217
6.2 Images from a randomly selected core produced by Tissue Studio v.2.0 (Definiens AG, Munich, Germany), an immunohistochemical scoring package. The stained core as it appears under the light microscope is shown in (A), with the brown regions representing antibody binding and oxidation of DAB by horseradish peroxidase. Cellular identification and localisation is shown in (B), with the nuclei appearing blue and cytoplasm green. The degree of antibody staining is shown in (C) and can be seen to similarly correspond with the appearances on the micrograph (A). Areas shaded white have no antibody staining, yellow have weak antibody binding, orange have moderate antibody staining and brown have intense antibody staining (all considered positive).
218
6.3 Morphology of the SW480 cell line used for this investigation. Micrograph taken at x400 magnification.
219 6.4 Western blot for NQO1 in transfected S480 cells. From the left: DMSO
treated cells were used as a control, and the transfection process (scrambled siRNA) had no effect on NQO1 expression. All 4 siRNAs (A-D) offered good knockdown of NQO1 at both concentrations. The optimum knockdown was achieved with siRNA-A at a concentration of 2.5pM.
220
6.5 Wells highlighted in red were transfected with siRNA to knockdown NQO1 and then incubated with irinotecan or 5FU over a range of concentrations. Wells highlighted in blue were transfected with a scrambled siRNA and then similarly treated. Wells highlighted in green were incubated in 0.5% DMSO (vehicle control) and wells highlighted in yellow were incubated in media only.
221
6.6 Wells highlighted in red were transfected with siRNA to knockdown NQO1, pre-treated with dicoumarol and then incubated with the irinotecan or 5FU over a range of concentrations. Wells highlighted in green were transfected but not pre-treated with dicoumarol and wells highlighted in blue were not transfected nor pre-treated. Wells highlighted in yellow were transfected with scrambled siRNA and then pre-treated with 0.5% NaOH and incubated in 0.5% DMSO, and those highlighted in purple were incubated in 0.5% DMSO only.
223
6.7 Wells highlighted in red were pre-treated with dicoumarol and then incubated with irinotecan or 5FU over a range of concentrations. Wells highlighted in blue were not pre-treated but treated with chemotherapy only. Wells highlighted in green were pre-treated with 0.5% NaOH and then incubated in 0.5% DMSO (vehicle control) and wells highlighted in yellow were not pre-treated but incubated in 0.5% DMSO only.
224
6.8 Western blots for thymidylate synthase (TS) in patient matched colonic mucosa (C), primary tumour (P), metastatic tumour (M) and liver parenchyma (L).
226
6.9 Western blots for dihydropyrimidine dehydrogenage (DPYD) in patient matched colonic mucosa (C), primary tumour (P), metastatic tumour (M) and liver parenchyma (L).
227
xix
matched colonic mucosa (C), primary tumour (P), metastatic tumour (M) and liver parenchyma (L).
6.11 Western blots for human carboxylesterase 1 (CES1) in patient matched colonic mucosa (C), primary tumour (P), metastatic tumour (M) and liver parenchyma (L).
229
6.12 Western blots for human carboxylesterase 2 (CES2) in patient matched colonic mucosa (C), primary tumour (P), metastatic tumour (M) and liver parenchyma (L).
229
6.13 Western blots for human topoisomerase I (TOP I) in patient matched colonic mucosa (C), primary tumour (P), metastatic tumour (M) and liver parenchyma (L).
230
6.14 Western blots for UDP glucuronosyltransferase 1A1 (UGT1A1) in patient matched colonic mucosa (C), primary tumour (P), metastatic tumour (M) and liver parenchyma (L).
230
6.15 Western blots for cytochrome P450 3A4 (CYP3A4) in patient matched colonic mucosa (C), primary tumour (P), metastatic tumour (M) and liver parenchyma (L).
231
6.16 Western blots for DNA polymerase β (DNA POL β) in patient matched colonic mucosa (C), primary tumour (P), metastatic tumour (M) and liver parenchyma (L).
233
6.17 CES1/CES2 activity was measured by SN38 production in patient matched primary tumour, liver metastasis and liver parenchyma. Mean (SD) data are presented for each tissue type for the patients studied.
234
6.18 Mean, SD and 95% confidence interval for SN-38 production in the primary tumours, liver metastases and liver parenchyma. Analysis with ANOVA showed significant differences between groups (p=0.001).
234
6.19 Comparison of protein quantification by western blotting (densitometry iu) and iTRAQ (abundance) for NQO1 demonstrates a high statistically
significant relationship (r=0.59; p=0.003).
238
6.20 Correlation between the percentage of cells staining positively for NQO1 in the primary tumour and metastatic tumour. Using Spearman’s rank
correlation coefficient, r=0.44 (95% CI 0.20 – 0.64, p=0.001).
240
6.21 Dose response analysis for irinotecan in the SW480 cell line. Cells were incubated for 72 hours and cell viability assessed using the MTS assay and presented as a mean (95% CI) percentage of the control (0.5% DMSO). The IC50 is 90.2µM.
241
6.22 Dose response analysis for 5-FU in the SW480 cell line. Cells were
incubated for 72 hours and cell viability assessed using the MTS assay and presented as a mean (95% CI) percentage of the control (0.5% DMSO). The IC50 is 202.2µM.
242
6.23 The effect of incubation with irinotecan on NQO1 expression was minimal. No samples were significantly different from the control value (0.5% DMSO).
243
6.24 Dose response analysis for irinotecan in the SW480 cell line with and without knockdown of NQO1 by siRNA transfection. Cells were incubated for 72 hours and cell viability assessed using the MTS assay and presented as a mean (95% CI) percentage of the control (0.5% DMSO). The IC50 is 100.1µM with the scrambled siRNA transfection, and 49.8µM following NQO1 knockdown. Statistical significance was achieved as follows: *p<0.05, **p<0.01, ***p<0.001.
244
xx
knockdown of NQO1 by siRNA transfection. Cells were incubated for 72 hours and cell viability assessed using the MTS assay and presented as a mean (95% CI) percentage of the control (0.5% DMSO). The IC50 is 200.1µM with the scrambled siRNA transfection, and 25.0µM following NQO1 knockdown. Statistical significance was achieved as follows: *p<0.05, **p<0.01, ***p<0.001.
6.26 Dose response analysis for dicoumarol in the SW480 cell line. Cells were incubated for 4 hours and cell viability assessed using the MTS assay and presented as a mean (95% CI) percentage of the control (media only).
246
6.27 The effect of pre-treating cells with dicoumarol prior to incubation with 100µM irinotecan. Cell viability is expressed as a percentage of control (0.5% NaOH only followed by irinotecan). The maximum effect was achieved at a dicoumarol dose of 100µM.
247
6.28 Dose response analysis for irinotecan in the SW480 cell line firstly showing the effect of NQO1 knockdown by siRNA transfection, and secondly the absence of any additional biological effect following dicoumarol pre-treatment in those cells not expressing NQO1. Cells were incubated for 72 hours and cell viability assessed using the MTS assay and presented as a mean (95% CI) percentage of the control (scrambled siRNA transfection, pre-treatment with 0.5% NaOH and incubation in 0.5% DMSO).
248
6.29 Dose response analysis for irinotecan in the SW480 cell line with and without pre-treatment with dicoumarol. Cells were incubated for 72 hours and cell viability assessed using the MTS assay and presented as a mean (95% CI) percentage of the control (0.5% NaOH followed by 0.5% DMSO). The IC50 is 100.0µM for irinotecan alone, and 50.0µM following NQO1 inhibition with dicoumarol. Statistical significance was achieved as follows: *p<0.05, **p<0.01, ***p<0.001.
250
6.30 Dose response analysis for 5-FU in the SW480 cell line with and without pre-treatment with dicoumarol. Cells were incubated for 72 hours and cell viability assessed using the MTS assay and presented as a mean (95% CI) percentage of the control (0.5% NaOH followed by 0.5% DMSO). The IC50 is 183.7µM for 5-FU alone, and 49.9µM following NQO1 inhibition with dicoumarol. Statistical significance was achieved as follows: *p<0.05, **p<0.01, ***p<0.001.
250
6.31 Nrf2 is bound to Keap1 until pathway activation causes its stabilisation. Nrf2 subsequently translocates to the nucleus where it dimerises with a number of transcription factors and the heterodimer binds to the antioxidant response elements of a number of genes thus activating transcription. Adapted from Bataille and Manautou (2012).
xxi Abbreviations
5-FU 5-flourouracil ACN acetonitrile ACTB β-actin
AJCC American Joint Committee on Cancer ANOVA analysis of variance
APC adenomatous polyposis coli APE1 AP endonuclease 1
APER abdomino-perineal excision of rectum ARE anti-oxidant response element ASCO American Society of Clinical Oncology Asf1 anti-silencing function 1
BER base excision repair
BETA bevacizumab expanded access trial
bFOL bolus fluorouracil and low-dose leucovorin with oxaliplatin BOXER bevacizumab, oxaliplatin, xeloda in unresectable liver metastases
bp base pairs
BRiTE Bevacizumab Regimens: Investigation of Treatment Effects and Safety BSA bovine serum albumin
CALGB Cancer and Leukemia Group B CapeOXc apecitabine with oxaliplatin CDAN1 codanin 1
CEA carcinoembryonic antigen CENPE centromere protein E CES1 carboxylesterase 1 CES2 carboxylesterase 2
ChIP chromatin-immunoprecipitation CI confidence interval
CIMP CpG island methylator phenotype CIN chromosomal instability
CLASSIC Conventional versus Laparoscopic-Assisted Surgery in Colorectal Cancer CoLOR Colon cancer Laparoscopic or Open Resection
xxii CRM circumferential resection margin
CRT chemoradiotherapy
CRUK Cancer Research United Kingdom
CT computed tomography
Ct cycle threshold
CYP3A4 cytochrome P450 3A4
DAB diaminobenzidine tetrahydrochloride DACH diaminocychlohexane
dbSNP database single nucleotide polymorphisms DCC deleted in colorectal carcinoma
DHFU dihydrofluorouracil DILI drug induced liver injury DMSO dimethyl sulfoxide DNA deoxyribonucleic acid DNAPOL β DNA polymerase β dNTP deoxynucleotide
DPYD dihydropyrimidine dehydrogenase dUTP deoxyuridine triphosphate
EGF epidermal growth factor
EGFR endothelial growth factor receptor ELISA enzyme-linked immunosorbent assay
EORTC European Organisation for Research and Treatment of cancer EPIC European Prospective Investigation into Cancer and Nutrition ErbB erythroblastic leukemia viral oncogene
ERK extracellular signal-regulated kinases FAP familial adenomatous polyposis FDA Food and drug administration FDG fluorodeoxyglucose
FdUDP fluorodeoxyuridine diphosphate FdUMP luorodeoxyuridine monophosphate FdUTP fluorodeoxyuridine triphosphate FFPE formalin-fixed and paraffin-embedded FOLFIRI folinic acid, fluorouracil and irinotecan
xxiii FRL future remnant liver
FUDP fluorouridinedisphoaphate FUTP fluorouridine triphosphate H&E haematoxylin and eosin HMGB1 high-mobility group protein B1
HNPCC hereditary nonpolyposis colorectal cancer HPLC high pressure liquid chromatography HPRT1 hypoxanthine phosphoribosyltransferase
HR hazard ratio
IC50 half maximal inhibitory concentration Indels insertions and deletions
IORT intra-operative radiotherapy IQR interquartile range
IRAS Integrated Research Application System IrMdG Irinotecan and modified de Gramont iTRAQ isobaric tagging for relative quantification KEAP1 Kelch-like ECH-associated protein 1 KRAS Kirsten rat sarcoma
LC-MS/MS liquid chromatography-mass spectrometry/mass spectrometry LOH loss of heterozygosity
Mad2 mitotic arrest deficient 2
MAGIC Medical Research Council Adjuvant Gastric Infusional Chemotherapy MAPK mitogen-activated protein kinase
miRNA micro ribonucleic acid MMR mismatch repair genes MMTS methylmethanethiosulfate
MOSAIC Multicenter Study of Ox/ 5FU-LV in the adjuvant treatment of colon cancer MRC Medical Research Council
MRI magnetic resonance imaging MRM multiple reaction monitoring mRNA messenger ribonucleic acid MSH2 MutS protein homolog MSI microsatellite instability
MTOR mammalian target of rapamycin
xxiv MWA microwave ablation
N/A not applicable NaOH sodium hydroxide NCI National Cancer Institute NER nucleotide-excision repair NGS next generation sequencing
NICE National Institute for Health and Care Excellence NIH National Institute Health
NQO1 NAD(P)H dehydrogenase [quinone 1] NRAS neuroblastoma RAS viral oncogene homolog Nrf2 nuclear factor (erythroid-derived 2)
OPRT orotate phosphoribosyl transferase
OPUS oxaliplatin and cetuximab in first line treatment of metastatic colon cancer PAGE polyacrylamide gel electrophoresis
PARP1 poly(ADP-ribose) polymerase PCR polymerase chain reaction PET positron emission topography
PETACC-3 Pan-European Trials in Alimentary Cancer PI3K phosphatidylinositol-4,5-bisphosphate 3-kinase
PIK3CA phosphatidylinositol-4,5-bisphosphate 3-kinase, catalytic subunit alpha PMS2 postmeiotic segregation increased 2
PulMICC Pulmonary Metastasectomy in Colorectal Cancer QC quality control
QUASAR Quick and Simple and Reliable R&D Research and Development RAF rapidly accelerated fibrosarcoma
RAS rat sarcoma
RCRG Rectal Cancer Regression Grade REC Research Ethics Committee
RECIST Response Evaluation Criteria in Solid Tumours RFA radiofrequency ablation
RIN ribonucleic acid integrity number RIPA radioimmunoprecipitation assay RNA ribonucleic acid
xxv
SCPRT short-course pre-operative radiotherapy SD standard deviation
SDS sodium dodecyl sulphate shRNA short hairpin ribonucleic acid siRNA small interfering ribonucleic acid SN-38 7-Ethyl-10-hydroxy-camptothecin SNV single nucleotide variant
TBST tris buffered saline with tween
TCEP Tris (2-carboxyethyl) phosphine hydrochloride TEAB triethylammonium bicarbonate
TFA trifluoroacetic acid
TGFα transforming growth factor α TK thymidine kinase
TMA tissue micro-array TME total mesorectal excision TNM tumour node metastasis TOP I topoisomerase I
TP thymidine phosphorylase TP53 tumour protein p53 TRG tumour regression grade TS thymidylate synthase
UGT1A1 UDP glucuronyltransferase 1A1 UICC Union for International Cancer Control
UK United Kingdom
UP uridinephosphorylase
VEGF vascular endothelial growth factor
vs versus
WRT with respect to
WT Wild type
1 Chapter 1
2 1.1 Epidemiology of colorectal cancer
The 2011 dataset published by Cancer Research (UK) declares colorectal cancer (CRC) as the fourth commonest cancer in the United Kingdom, with around 41600 people diagnosed in 2011 alone. There is a slight male preponderance for the disease, and it is the third commonest cancer in both men (after prostate and lung), and women (after breast and lung). 95% of cases occur in those over the age of 50, the incidence of which has increased by 6% over the last decade. These figures are representative of disease burden worldwide, with 447 000 new cases diagnosed in Europe and 1.36 million worldwide in 2012.
(http://www.cancerresearchuk.org/cancer-info/cancerstats/types/bowel/).
Whilst the fourth commonest cancer, colorectal cancer is the second commonest cause of cancer related death in the UK. The death rate remains high despite a two-fold increase in five year survival over the past 40 years. The UK bowel cancer screening programme has been gradually rolled out since 2006, however it is as yet unclear the effect this will have on survival rates.
Dukes Stage at
Diagnosis Percentage of Cases Five-Year Survival
A 8.7% 93.2%
B 24.2% 77.0%
C 23.6% 47.7%
D 9.2% 6.6%
Unknown 34.3% 35.4%
Table 1.1 - Percentage of cases and 5 year relative survival (%) by Dukes' stage at diagnosis for colorectal cancer patients diagnosed 1996-2002 in England. (Reproduced
without permission from Cancer Research (UK)).
The best known predictor of survival is disease stage, with over 93% of patients with Dukes A disease surviving 5 years compared to less than 7% of those with Dukes D disease (Table 1.1). On separating the disease into tumours of the colon and rectum, survival is
3
54.4% and 55.1%. In those with rectal cancer 1-year survival for men and women is 78.8% and 78.8% respectively, and 5-year survival 54.6% and 57.5%.
1.2 Risk factors for colorectal cancer
A number of dietary and lifestyle factors have been linked to the development of colorectal cancer, including diets rich in unsaturated fats and red meat, excess alcohol and a
sedentary lifestyle (Potter, 1999; Slattery et al, 2000; Huxley et al 2009). A number of other risk factors have been studied, and a recent review attempted to describe the complex interplay between energy intake, hormone levels, inflammation and gut flora which may lead to colorectal cancer (Slattery and Fitzpatrick, 2009). Smoking is also associated with an increased risk of colorectal cancer (Colangelo et al, 2004) as is a preceding diagnosis of inflammatory bowel disease (Choiand Zelig, 1994). Isolated risk factors however have been difficult to define, confounded by the fact that the majority of tumours arise in individuals with poorly defined risk profiles.
1.3 Genetics of colorectal cancer
There are a number of identified gene defects known to predispose to colorectal cancer, as well as a number of somatic mutations that are present in sporadic tumours. These
4
Syndrome Common Features Gene defect(s)
FAP
Multiple adenomatous polyps (>100) and carcinomas of the colon and
rectum; duodenal polyps and carcinomas; fundic gland polyps in the
stomach; congenital hypertrophy of the retinal pigment epithelium
APC (>90%)
Gardner syndrome Same as FAP; also, desmoid tumors
and mandibular osteomas APC
Turcot's syndrome
Polyposis and colorectal cancer with brain tumors (medulloblastomas); colorectal cancer and brain tumors
(glioblastoma) APC MLH1, PMS2 Attenuated adenomatous polyposis coli
Fewer than 100 polyps, although marked variation in polyp number (from ~5 to > 1,000 polyps) observed
in mutation carriers within a single family
APC (precominantly 5' mutations)
Hereditary nonpolyposis colorectal cancer
Colorectal cancer without extensive polyposis; other cancers include endometrial, ovarian and stomach cancer, and occasionally urothelial, hepatobiliary, and brain tumors
MSH2 MLH1 PMS2 GTBP, MSH6 Peutz-Jeghers syndrome
Hamartomatous polyps throughout the GI tract; mucocutaneous pigmentation; increased risk of GI and
non-GI cancers
LKB1, STK11 (30-70%)
Cowden disease
Multiple hamartomas involving breast, thyroid, skin, central nervous system and GI tract; increased risk of breast, uterus and thyroid cancers; risk of GI
cancer unclear
PTEN (85%)
Juvenile polyposis syndrome
Multiple hemartomatous/juvinile polyps with predominance in colon
and stomach: variable increase in colorectal and stomach cancer risk;
facial changes
DPC4 (15 %) BMPRIa (25 %)
PTEN (5 %)
MYH - associated polyposis
Mutiple adenomatous GI polyps,
5
polyps often have somatic KRAS
mutations
Table 1.2 – Genetics of inherited colorectal tumour syndromes. (Reproduced without permission from Fearon, 2011).
Most tumours arise within dysplastic polyps, and therefore an understanding of the
adenoma-carcinoma sequence is crucial. Most polyps are hyperplastic and less than 5mm in diameter, however it is the larger adenomas which have been shown to possess malignant potential (Jass, 2007). An adenoma is a benign lesion of glandular epithelium with a prevalence of approximately 25% by age 50 and 50% by age 70 (Rex et al, 1993). Only a small number of polyps progress to malignancy, often over a period of years to decades; polyp surveillance studies have shown that a 1cm polyp has a 10-15% chance of becoming malignant within 10 years (Stryker et al, 1987). Adenoma-carcinoma progression was first described by Vogelstein in 1990 as a series of genetic alterations responsible for sporadic CRC, beginning with mutation in the adenomatous polyposis coli (APC) gene followed by mutations in the KRAS and TP53 genes. These mutations are positively selected for during carcinogenesis and are intrinsically involved in DNA repair, cell adhesion and proliferation (Wood et al, 2007).
1.3.1 Adenomatous polyposis coli
The APC tumour suppressor gene encodes for a protein known to regulate cell-adhesion, migration and apoptosis (Fearonand Vogelstein, 1990), and is the genetically defective gene in FAP as well as some of the less common inherited cancer syndromes. The defect is present in over 75% of colorectal cancers, and is widely believed to be an early step in sporadic carcinogenesis due to its reported presence across the adenoma-carcinoma sequence, including microscopic adenomas with a small number of dysplastic glands (Kinzlerand Vogelstein, 1996).
6
1.3.2 KRAS/BRAF
The RAS family of proteins (KRAS, HRAS and NRAS) are G-proteins which predominantly fulfil the roles of molecular switches. KRAS is a proto-oncogene which, following activation through the endothelial growth factor receptor (EGFR) pathway, triggers downstream signalling through the PI3K/AKT/MTOR and RAF/MEK/ERK pathways resulting in cellular proliferation (Fearon, 2011). Up to 40% of colorectal tumours have a mutated version of the KRAS gene, most commonly in codons 12 with smaller subsets affecting codon 13 and rarely codon 61 (Downward, 2003). The mutation is also found in a number of flat colonic epithelial lesions without dysplasia, questioning its role in early carcinogenesis (Pretlowand Pretlow, 2005). However disruption of mutant KRAS in advanced CRC has demonstrated that inactivation inhibits tumour growth both in vitro and in animal studies, highlighting its role in disease progression (Shirasawa et al, 1993).
BRAF is a downstream target of KRAS, exerting its effect through the MEK/ERK pathways. Mutated in approximately 5-10% of colorectal cancers, BRAF mutation appears to be independent of KRAS mutation, however mutation in either can result in pathway upregulation and activation of relevant downstream transcription factors such as myc (Rajagopalan et al, 2002).
1.3.3 TP53
TP53 (p53) is a tumour suppressor gene implicated in a wide range of malignancies, most likely due to its significant role as a regulator of cell-cycle checkpoints, genomic stability, apoptosis and angiogenesis (Vousdenand Prives, 2009). Under conditions of DNA damage resulting from cellular stress p53 activates DNA repair proteins, arrests growth by holding the cell cycle at the G1/S regulation point and initiates apoptosis. Over 50% of all tumours have ineffective p53 (Hollstein et al, 1991), thought to be a combination of loss of
heterogenezity (LOH) of one allelele of 17p and somatic mutation in the other (Fearonand Vogelstein, 1990). This pattern is not observed in most adenomas, highlighting this
mutation as a significant event in the transition from adenoma to carcinoma (Baker et al, 1990).
7
Whilst germline mutations account for a relatively small proportion of tumours they offer a unique opportunity to understand the genetic instability which contributes to the
development of CRC. Mismatch repair genes (MMR), for example MLH1, MSH2, MSH6 and
PMS2, are responsible for correcting base mismatches and short insertions or deletions which normally occur during DNA replication (Gradyand Carethers, 2008). Where these genes are defective, DNA sequences are not faithfully replicated and microsatellites are created - short sections of repeating DNA 1-6 base pairs long.
Germ-line mutations in MMR genes are present in only 2-4% of CRC patients, however 15% of sporadic colorectal cancers exhibit microsatellite instability (MSI). A key mechanism for this is thought to be hypermethylation of the promoter of MLH1 resulting in a loss of function (Aaltonen et al, 1993). MSI tumours exhibit a specific phenotype; they tend to be poorly differentiated right colonic tumours with high mucinogens and tumour related lymphyocytes and are less likely to metastasise than microsatellite stable (MSS) tumours (Buecher et al, 2013). These pathological features confer a survival advantage, despite a reported resistance to fluorouracil based chemotherapeutic regimens (Ribic et al, 2003). Tumours with MSI can be sub-classifed as MSI-Low or MSI-High by the presence of less than or more than 30% unstable loci in a panel of 5-10 points respectively (Boland et al, 1998). The distinction of MSI-High/Low is associated with further variations in tumour phenotype and disease characteristics.
1.3.5 Chromosomal instability (CIN)
The chromosomal instability (CIN) phenotype is observed in approximately 70%–85% of CRC. It is widely accepted that most MSS tumours follow the CIN mechanism of
tumourigenesis, however the MSI and CIN phenotypes are not mutually exclusive (Lengauer, Kinzler and Vogelstein, 1997).
The cause of chromosomal instability is not known, although it is believed to be due to defects in genes which regulate formation of the mitotic spindle and alignment and segregation of chromosomes at mitosis (Grady, 2004). A small number of specific defects have been suggested, including alterations in Mad2, BubR1, Bub3 and CENPE proteins as well as LOH in chromosome 18q containing the tumour suppressor genes SMAD2, SMAD4,
8
is more heterogenous than the relationship between MMR genes and microsatellite instability (Alberici and Fodde, 2006).
1.3.6 CpG island methylator phenotype (CIMP)
DNA methylation is thought to serve the biological function of silencing repetitive elements of the genome (Yoder et al, 1997), and the significance of hypermethylation resulting in loss of function of MLH1 has already been discussed. The majority of C-phosphate-G sites have been lost from the human genome during evolution, however hypermethylation of any residual islands, defined as methylation of at least 3 loci from a panel of 5 gene-associated CpG islands, results in the silencing of tumour suppressor or other tumour related genes and ultimately carcinogenesis (Carragher et al, 2010). The CPG island methylator phenotype (CIMP) represents a further subset of colorectal cancers with a particular molecular and biological profile. Specifically these tumours have a higher incidence of concurrent mutations in KRAS/BRAF but wild type TP53, and are more frequently proximal tumours with mucinous and poorly differentiated histopathological features most often presenting in older female patients (Issa, 2004). Similarly to MSI, CIMP status of the tumour has been used to infer potential response to chemotherapeutics (Shiovitz et al, 2014).
1.3.7 Summary of colorectal cancer genetics