ON FATIGUE CRACK CLOSURE
D.K. Rehbein, D.J. Barnard and O. Buck Ames Laboratory - USDOE
Materials Science and Engineering Department Iowa State University
Ames, Iowa 50011
INTRODUCTION
The growth of a fatigue crack is modified by the development of contacts between the crack faces l ,2, creating shielding and thus
canceling a portion of the applied load. These contacts develop through a number of mechanisms, including plastic deformation, sliding of the faces with respect to each other and the creation and collection of debris such as oxide particles 3 . Compressive stresses are created on either side of the partially contacting crack faces resulting in opening loads that must be overcome in order to apply a driving force to the crack tip for growth. In this way, the crack tip is shielded from a portion of the applied load, thus creating the need for modificationl of the applied stress intensity range from ~K = KImax - KImin to 6K = KImax - KIsh. Determination of the contact size and density in the region of closure from ultrasonic transmission and diffraction experiments4 has allowed estimation of the magnitude of KIsh on a crack grown under constant 6K conditions. The calculation has since 5 been extended to fatigue cracks grown with a tensile overload block. The calculation was also successful in predicting the growth rate of the crack after
reinitiation had occurred. This paper reports the results of attempts to define the amount of retardation remaining before reinitiation of crack growth in terms of the parameters used by the distributed spring model.
ULTRASONIC EXPERIMENTS AND MODELING
The experimental configuration for the ultrasonic interrogation of the fatigue cracks under consideration is shown in Fig. 1. The fatigue crack in a modified compact tension specimen is illuminated by a
normally incident longitudinal wave focussed in the plane of the crack. The longitudinal wave transmitted is detected by a receiver placed coaxially on the opposite side of the sample. The frequency spectrum of this received signal is deconvolved with that observed in a reference experiment where the beam is transmitted through the uncracked ligament. In this way, most of the influence of the measurement system and
TRA SMIT
x
RECEIVE THROUGH TRANSM lSSIO
o
FATIGUE CHACKo
RECEIVE TIP DIFFRACTED
Fig 1 Arrangement for measurement of acoustic response of fatigue crack.
The plane of a partially contacting fatigue crack is viewed as consisting of contacting asperities separated by crack-like voids which act as scatterers of an elastic wave. This scattering can be modeled based on the electromechanical reciprocity theorem6 applied to the conditions of normal incidence and utilizing7 an averaged crack opening displacement which describes the contact at the crack surface in terms of a spring constant ~ which is inversely related to the crack opening
displacement.
This development has been used to obtain descriptions of through transmission results from a variety of samples 8 - ll . Fig. 2 presents a comparison between experimental through transmission results (left) and model predictions (right) for a fatigue crack grown under constant 6K
conditions. For this case, ~ is described using an exponentially decaying function,
(1) ,
in the closure zone near the crack tip where ~O is the spring constant
at the crack tip and ~ describes the decay of the spring constant in the crack tip closure region.
[image:2.442.123.319.32.303.2]6 MHz 6 MHz
E- 1.0 10 MHz E- 1.0 - - - 10 MHz
Z Z
I'< I'<
J
G
~ 0.8
r;:
0.8'""'
'""'
>"l >"l
0 0
U U
Z 0.6 Z 0.6
0 0
(jj (jj
UJ (fj
:2
0.4S1
0.4UJ (fj
Z
z
-<: -<:
~ ~
E- 0.2 E- 0.2
0.0 0.0
-
,12 14 16 16 20 22 12 14 16 16 20 22
DISTANCE ALONG CRACK, mm DISTANCE ALONG CRACK, mm Fig 2 Experimental acoustic response (left) and distributed spring
model prediction (right) of crack grown with constant t.\K.
This decrease results in the beam impinging on the crack tip sooner for low frequencies than for high frequencies as the beam approaches the crack from the uncracked ligament causing the low frequency transmission response to decrease first. When the beam is centered on the tip of an ideal crack, the transmission response from all frequencies will be identical and equal to 50% transmission since the effective beam centers are coincident. A portion of the low frequency spot also stays in the uncracked ligament longer for the lower frequency, resulting in a higher transmission response at that position.
Changes from this ideal behavior due to crack closure are apparent in Fig 2, causing the position of the "crossover" in the frequency response to occur at a transmission coefficient of greater than 0.5 and making an accurate determination of the position of the crack tip more difficult. Further changes in this behavior have been observed for the case of a crack currently in the retarded condition12 and are important for detection of the "tight" crack formed during tensile overloading.
CHANGES IN ACOUSTIC RESPONSE DURING RETARDATION
[image:3.442.44.395.35.233.2]1.1 1.0
T 0.9 R A 0.8
N 0.7
S 0.6
M 0.5
I S 0.4 S 0.3
I 0.2
0 0.1
N
C 1.0
0 0.9
E 0.8
F F 0.7
I 0.6
C 0.5
I 0.4
E 0.3
N 0.2
T
0.1 0.0
DISTANCE ALONG CRACK, ARBITRARY UNITS Fig 3 Acoustic response of overloaded crack at intervals
during retardation period.
The results show the appearance of a trend in the frequency response as cycling occurs through the retardation period. Immediately after the overload application and after 8,000 cycles of subsequent cycling, no "cross-over" of the data at the various frequencies is seen as would be expected. Beginning with the data at 25,000 cycles, a "cross-over" in the 4 and 6 MHz data is observed with the cross-over appearing to move to lower values of the transmission magnitude as additional cycling is accomplished. Only at the highest number of cycles, 85,000, does the 10 MHz data begin to approach the expected behavior.
It is speculated that the section of tightly closed crack created during the overload application has altered the frequency response from that normally observed. The method by which this alteration occurs is not clear at this time. It can also be observed that the curves appear to become steeper as additional fatigue cycles are applied. This steepening is difficult to quantify from the experimental results but will be discussed further in a later section.
CRACK TIP POSITION DETERMINATION
Determination of the position of the crack tip can be achieved by a number of experimental methods, i.e. optical measurements, clip gauge opening, strain gauge measurements, etc. Each of these measurements contains some degree of error due to the curvature of the crack front as the crack changes from the plane stress regions on the edges of the compact tension specimen to the plane strain region in the center. The ultrasonic response of the crack conceptually should provide the most accurate determination of the crack tip position since the focussed beam is entirely within the plane strain region and should detect the
[image:4.442.86.362.39.267.2]
E-z
~
U
~~ ~
0
U
Z 0 {jj
if)
52
if)
Z ...: P:::
E-"
' ,z
, 'l
~
0.8
U
0.8"
FREQUENCY ~ FREQUENCY 't~,
:
~
I ",
- 4 MHZ ~ - 4 MHZ ~,
0 ,
0.6
-
-
6 MHZ U 0.6-
-
6 MHZI
- - - 10 MHZ Z - - - 10 MHZ,
0
I
TIP POSITION (jj TIP POSITION
0.4 if) 0.4
I
- OPTIC
,
52
- OPTICif)
CUP GAUGE Z CUP GAUG~
-
-
...:
--
I,...
P:::
0.2 SPRING E- 0.2 SPRING I ,
- - - MODEL - - - MODEL
FRACTURE FRACTURE
SURFACE SURFACE
0.0 0.0
800 840 880 920 960 1000 900 940 980 1020 1060
DISTANCE, INCH X 1000 DISTANCE, INCH X 1000
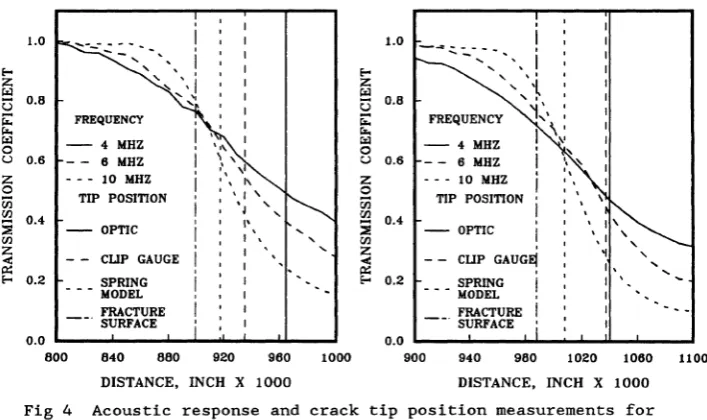
Fig 4 Acoustic response and crack tip position measurements for
cracks grown with constant
~K....
1100
The distributed spring model as described earlier must have a value
for the crack tip position in order for Eq
(1) to be used. It is
possible using iterative computing techniques to obtain a best-fit set
of values for the crack tip position and
~Oand
p
by comparison with the
experimental data. Two examples of determination of the crack tip
position by this method are shown in Fig 4. Also included for comparison
are measurements of the crack tip position by optical measurement, clip
gauge opening and fractography after destruction of the sample.
The crack tip positions as determined by the spring model were
established using a non-linear regression technique comparing the
experimental response and the model predictions from a large set of
input values of the crack tip position and
~Oand
p.
It is seen from Fig
4 that for each of the cracks shown, the model determination of the
crack tip position yielded a more accurate position than either the
optical or clip gauge opening measurements thus validating that the
distributed spring model is capable of an accurate prediction of the
crack tip position.
OVERLOAD CRACK ANALYSIS
The iterative procedure used earlier for determination of the crack
tip position was also applied to estimate the best values for the crack
tip position as well as
~Oand
p
for the acoustic response curves shown
in Fig 3. In addition, the computations were done on a second set of
response curves that were obtained with the sample under a static load
of 65% of the Kmax that was used during the growth of the original
crack. This static load was intended to fully open the crack so that the
amount of apparent crack extension due to opening of the tightly closed
section of the crack could be determined. The results of these
[image:5.442.44.398.34.244.2]TABLE 1. Values of crack tip position, ~O and
P
for overloaded crack at various fatigue intervals for overload crack in 2024-T35l AI.FATIGUE CYCLES RELATIVE TO OVERLOAD BLOCK
-0 +0 8000 25000 45000 65000 85000
DIFFERENCE IN CRACK TIP
POSITIONS (cm)
0.08 -0.04 -0.04 -0.03 0.01 0.16 0.09
~o
(dynejcm2)
WW HIGH LOAD LOAD 7XlO13 4XlO14 2XlO14 3XlO14 2XlO14 5XlO14 3XlO14 7XlO14 7XlO14 5XlO14 3XlO14 6XlO14 2XlO14 2XlO14
LOW HIGH LOAD LOAD 8 40 16 34 16 30 18 38 24 30 20 32 26 30
The difference in the crack tip positions shows a rather confusing set of data. If indeed the higher static load opened the crack to approximate an ideal crack, then this difference should have been a positive number throughout as it was for the acoustic response data taken just before the overload (-0). Instead the differences for the responses early in the retardation period show negative values with essentially no difference at 45,000 cycles. It is possible that these results are within the computational uncertainty of the technique based on the inescapable experimental error. The opinion of the authors is that the only significant differences are those shown just before the overload and those for 65,000 and 85,000 cycles. At these last two fatigue intervals, the difference is approximating the length of tightly closed crack created during the overload. It is possible for the
responses early in the retardation that the calculation yields the position of the original crack tip that has been blunted by the overload application in accordance with earlier speculation12 .
The ~O values shown do not exhibit a consistent trend at either
static load setting except that the values appear to peak at 45,000 cycles for both static load settings. The computational uncertainty of these values is unknown at present, precluding any conclusions at this time from this apparent trend.
The one consistent trend shown is in the values for the exponential decay constant,
P,
at the lower static load setting. These values show almost a monotonic increase from just after the overload (+0) to 85,000 cycles. This trend agrees with the earlier observati@n that the response curves in Fig 3 appeared to steepen as additional fatigue was applied during the retardation period. Unfortunately, this specimen became corroded before reinitiation of the crack occurred. In order for growth to reoccur, the values for ~O andp
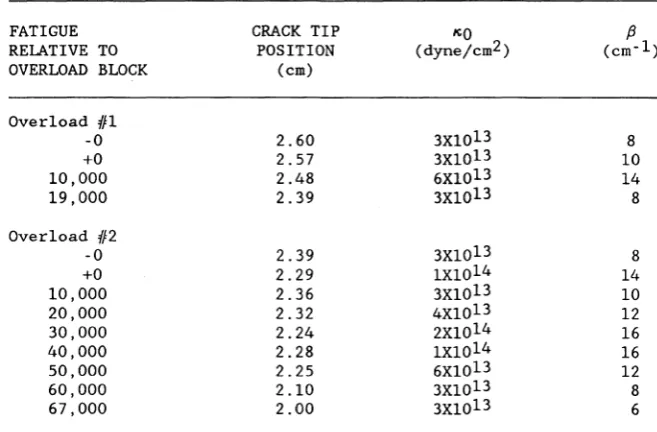
should return to values close to those just before the overload.various fatigue intervals for overload crack in 1100 Al.
FATIGUE CRACK TIP 11:0
f3
RELATIVE TO POSITION (dyne/cm2) (cm- l )
OVERLOAD BLOCK (cm)
Overload
Ifl
-0 2.60 3X10¹³ 8
+0 2.57 3X10¹³ 10
10,000 2.48 6X10¹³ 14
19,000 2.39 3X10¹³ 8
Overload 112
-0 2.39 3X10¹³ 8
+0 2.29 lX1014 14
10,000 2.36 3X10¹³ 10
20,000 2.32 4X10¹³ 12
30,000 2.24 2X10¹⁴ 16
40,000 2.28 lX1014 16
50,000 2.25 6X10¹³ 12
60,000 2.10 3X10¹³ 8
67,000 2.00 3XlO13 6
followed by a 5 cycle overload at twice the ~K used for crack growth. The crack reinitiated growth between the overloads. Results of the calculation of the relevant parameters from the spring model are shown in Table 2.
Anomalies continue to exist in the calculated crack tip position and the value for the spring constant at the crack tip, 11:0. In general, the trend in the value for
f3
discussed for the 2024-T351 sample is also present in this sample with exceptions noted in the calculated values at fatigue intervals shortly after application of the second overload. As before, these exceptions may be due to experimental error, computational error or a combination thereof. Additional computation power is being obtained in order to expand the possible range of input values for the tip position, 11:0 andf3
in order to refine the calculated values. Additional investigations to broaden the scope of the work to other microstructures in aluminum and for verification of the results shown are underway at the present. It is clear, however, from these results that if the closure state of a crack is known prior to the application of an overload, changes in that closure state and the resultant growth state due to load excursions can be detected.SUMMARY
[image:7.442.54.383.64.280.2]