by
IMRON HUSIN
Thesis submitted in partial fulfilment of the Degree of
Master of Arts in Demography at the Australian National University
ACKNOWLEDGEMENTS
This study was conducted after the author completed the one year course work of M.A. Program in Demography at the Australian National University. The major data were provided by the Department of Demography from its computer tapes on the 1971 Population Census of Indonesia.
It is a pleasure to acknowledge those who have had a part
in its completion. Financial support was received from the Population
Council. I am particularly grateful to Dr S.K. Jain, my thesis super
visor, for his patience and encouragement which made the task of this
study a smooth one. Thanks to Dr P.F. McDonald and Dr Terry Hull,
whose perceptive comments contributed significantly to the quality of this work.
I would like also to thank Dr D.W. Lucas for his help and
supervision during his period of co-ordinatorship. I wish to thank
Ms T. Sherlaimoff, Mr and Mrs P.A. Meyer for their contribution to
the English correction. My thanks are also due to Mrs Pat Ashman,
the secretary of the M.A. Program, for her assistance throughout.
Of course, I am responsible for the weaknesses that remain in this work.
ABSTRACT
The regional disparities within a country are one of the
main causes of internal migration. At the same time, it has been
recognised that the movement of people plays an important role in the
development process of the nation as a whole. In Indonesia, regional
differences as well as the importance of internal migration are among many reasons for the government to carry out the movement of people from Java to the outer islands under colonisation and then transmigra
tion schemes. This study attempts to observe the facts related to the
voluntary (unguided) movement on the one hand, and the extensive implementation of the guided movement by the government on the other. Some of the effects of migration on the receiving area (South Sumatra province) are also presented.
Migration to South Sumatra has mostly been directed and concentrated in only two major areas, i.e. the rural areas of OKU
(Ogan Komering Ulu) regency and Palembang municipality. The movement
to OKU regency cannot be separated from the colonisation and later the transmigration schemes, and was mainly the result of these two programs. At the present time, the rural to rural movement which is undertaken by the government in moving these people, is directed toward the purpose of rural development in the receiving areas, in addition to improving
the living standard of the transmigrants. The movement to Palembang
(urban area) broadly reflects the spatial incidence of economic development. The status of Palembang as an industrial city, capital city and the centre of activities could be the major attraction for
of migrants to South Sumatra to prefer living in urban areas, particularly in Palembang.
This study revealed that, at the present time, the trans migration contributed a low proportion of the total inmigrants annually.
This proposition was based on two facts: firstly, about fifty per cent
of the migrants in this province arrived within the last ten years pre ceding the 1971 census, the period in which transmigration was decreased
in number; secondly, a high percentage of migrants in the non
transmigrant areas lived in the urban areas. The impact of these
findings is that the voluntary (unguided) movement occurred extensively towards the centre of economic activities.
In conformity with migration theory, this study found that the distance factor influenced the volume of migration - either
guided or unguided movement. Economic motives emerged as the main
reason for people to move or be moved.
Analysis of characteristics of the migrants found that most migrants came from Java, particularly those who settled in the
rural areas. Most migrants were young in age and possibly had already
a relatively large family size when they moved. Although it is recog
nised that migrants had a very low level of education, in general, however, the educational level of the migrants was rather high com pared with the population as a whole, both in urban and rural areas.
The findings on migration to Palembang and OKU indicated that migrants, whether residing in the rural or urban areas, had an
CONTENTS
Page
ACKNOWLEDGEMENTS ii
ABSTRACT iii
LIST OF TABLES ix
LIST OF FIGURES xii
GLOSSARY xiii
CHAPTER
1 INTRODUCTION 1
1.1 Basic Concepts and Definitions 6
1.2 Interest in the Study 8
1.3 Objectives 10
1.4 Source of Data 10
1.5 Outline of the Thesis 10
2 DEVELOPMENT PLANNING AND INTERNAL MIGRATION
IN INDONESIA 12
2.1 Regional Development 12
2.1.1 Area and Population
Distribution Differences 13
2.1.2 Financial Resources of Provinces 15
2.1.3 Production 18
2.1.4 Regional Development Policy 21
2.2 Internal Migration in Indonesia 24
2.2.1 Population Mobility 25
2.2.2 Inter-Regional Migration 27
2.2.3 Transmigration 35
Summary 37
3 ESTIMATION OF MIGRATION TO SOUTH SUMATRA 40
3.1 Features of Migration to South Sumatra
Before the 1971 Census 41
3.2 Migration to South Sumatra Province
3.3 D e m o g r a p h i c a n d S o c i o - E c o n o m i c
C h a r a c t e r i s t i c s o f E v e r - M i g r a t e d P e o p l e 44 3 . 3 . 1 A r e a D i s t r i b u t i o n 45 3 . 3 . 2 A g e a n d S e x D i s t r i b u t i o n 48 3 . 3 . 3 P r o v i n c e o f O r i g i n a n d P a t t e r n
o f M o v e m e n t 53
3 . 3 . 4 D u r a t i o n o f R e s i d e n c e 60 3 . 3 . 5 M a r i t a l S t a t u s a n d H o u s e h o l d
S t r u c t u r e 61
3 . 3 . 6 E d u c a t i o n a l A t t a i n m e n t 63 3 . 3 . 7 C a t e g o r y o f L i v i n g U n i t 65
3 . 3 . 8 L a b o u r F o r c e 6 6
3 . 3 . 9 O c c u p a t i o n 70
3 . 3 . 1 0 I n d u s t r y 74
3.4 L i f e - T i m e M i g r a t i o n 76
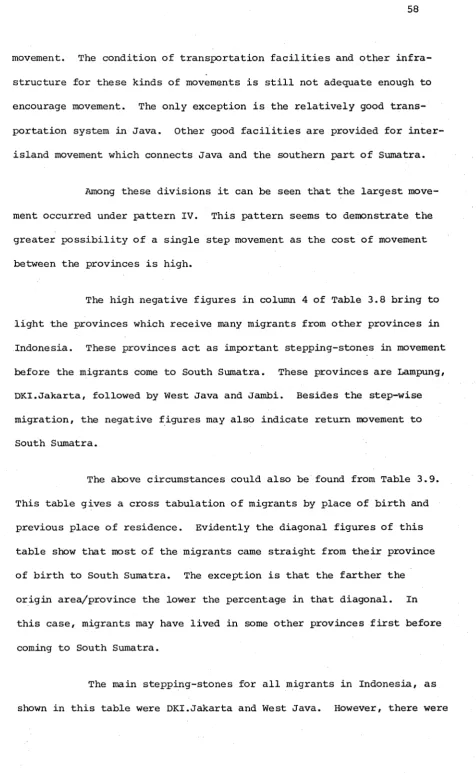
3.5 M i g r a t i o n f r o m P l a c e o f P r e v i o u s R e s i d e n c e 77
3.6 R e t u r n M i g r a t i o n 78
3.7 R e c e n t M i g r a t i o n 79
S u m m a r y 84
T R A N S M I G R A T I O N T O S O U T H S U M A T R A 88
4 . 1 T r a n s m i g r a t i o n as a P a r t o f I n m i g r a t i o n 88 4.2 I m p l e m e n t a t i o n a n d A r e a s o f
R e s e t t l e m e n t 89
4 . 3 C l a s s i f i c a t i o n o f T r a n s m i g r a n t s 93 4 . 4 V o l u m e o f T r a n s m i g r a n t s , O r i g i n a n d
D e s t i n a t i o n A r e a s 96
4 . 5 C h a r a c t e r i s t i c s o f T r a n s m i g r a n t s 99 4 . 5 . 1 S o u r c e s o f D a t a o n T r a n s m i g r a n t
C h a r a c t e r i s t i c s 1 0 1
4 . 5 . 2 A g e D i s t r i b u t i o n 101 4 . 5 . 3 A v e r a g e H o u s e h o l d S i z e 1 0 2
4 . 5 . 4 E d u c a t i o n 1 0 3
4 . 5 . 5 E c o n o m i c C o n d i t i o n a n d A c t i v i t i e s
a t t h e A r e a s o f O r i g i n 1 0 3 4 . 5 . 6 E c o n o m i c C o n d i t i o n a n d A c t i v i t i e s
a t t h e D e s t i n a t i o n A r e a 105
5 THE SIGNIFICANCE AND CHARACTERISTICS OF MIGRANTS IN PALEMBANG MUNICIPALITY AND OGAN KOMERING ULU REGENCY(OKU) AS MAJOR
CONCENTRATION AREAS 108
5.1 Volume of Inmigrants 109
5.2 Age and Sex Structure 112
5.3 Education 114
5.4 Migrant Activities 119
5.5 Migrant Involvement in Industry 124
5.6 Occupation and Educational Background 127
5.7 Province of Origin 132
5.8 Motivation for Migration and Migrant
Improvement at Destination Area 136
5.8.1 Motivation for Migration 137
5.8.2 Improved Standard of Living 138
Summary 139
6 IMPLICATIONS OF THE STUDY 144
6.1 Labour Force Supply and Economic
Contribution of Migrants 144
6.2 Transmigration and Voluntary Migration 146
6.3 Population Growth Rate 147
6.4 Migration Stream 151
6.5 Trends in Migrant Destination and
Economic Development in South Sumatra 151
REFERENCES 156
LIST OF TABLES
Table Title Page
2.1 Population by Place of Residence and Place
of Birth, 1971 31
2.2 Number of Migrants from Java/Bali Between
1905 and 1974, Based on the Colonisation and
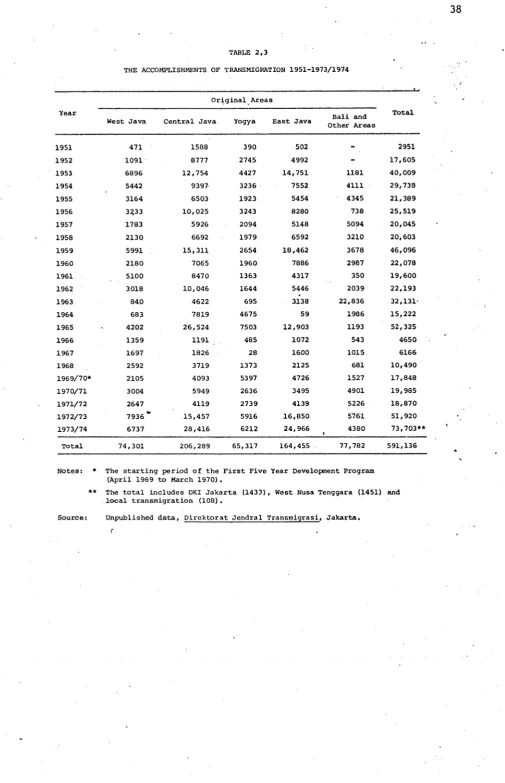
Transmigration Schemes 36
2.3 The Accomplishments of Transmigration
1951-1973/1974 38
3.1 Number of Migrants in South Sumatra from
Java and Madura, 1930 42
3.2 Number of Persons in South Sumatra Born
in Java and Madura, 1930 43
3.3 Distribution of Ever-Migrated People by
Regency and Municipality in South Sumatra,
1971 45
3.4 Migrant Population in Each Regency/Municipality,
1971 49
3.5 Percentage Distribution of Ever-Migrated
People by Broad Age Groups in Each Regency/
Municipality, 1971 50
3.6 Sex-Ratio of Ever-Migrated People and of the
Total Population According to Five Year Age
Groups in South Sumatra, 1971 51
3.7 Percentage Distribution by Age and Sex of
Migrants (0 to 8 Years Residence) in South
Sumatra 52
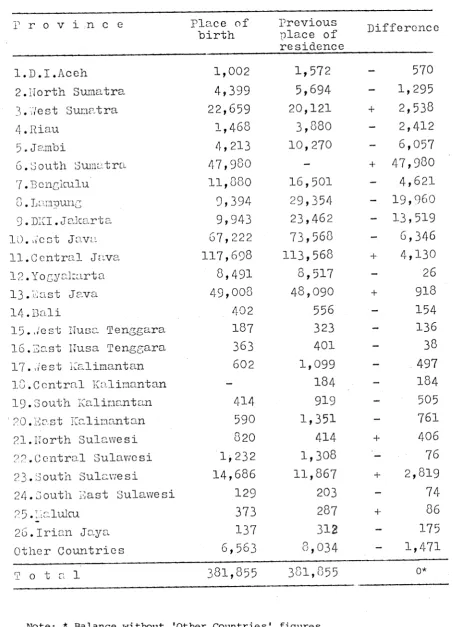
3.8 Ever-Migrated People in South Sumatra by Place
of Birth and by Previous Place of Residence,
1971 54
3.9 Percentage Distribution of Ever-Migrated
People in South Sumatra by Province of Birth
and Previous Place of Residence, 1971 59
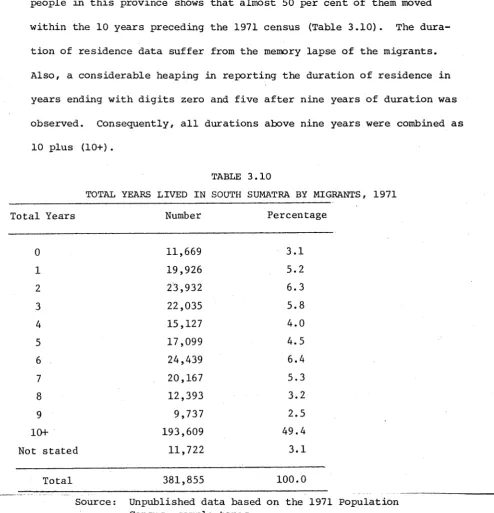
3.10 Total Years Lived in South Sumatra by
Migrants, 1971 60
3.11 Distribution of the Head of Household of
Migrants According to the Number of
T a b l e T i t l e P a g e
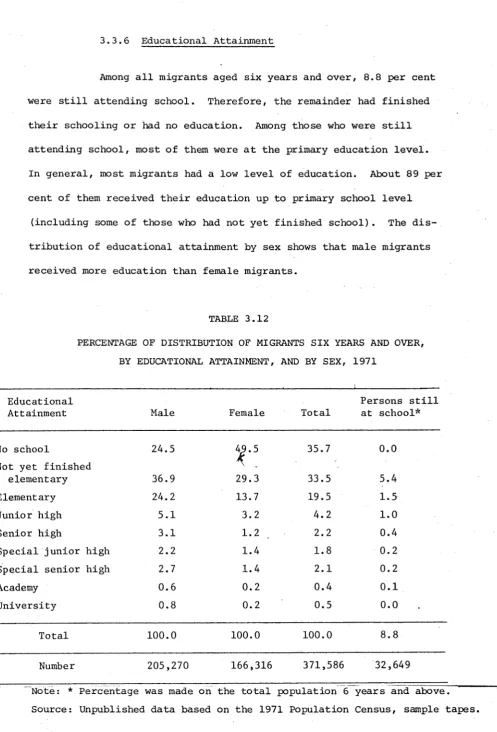
3 . 1 2 P e r c e n t a g e D i s t r i b u t i o n o f M i g r a n t s S i x Y e a r s a n d O v e r , b y E d u c a t i o n a l A t t a i n m e n t s ,
a n d b y S e x , 197 1 63
3 . 1 3 P e r c e n t a g e D i s t r i b u t i o n o f M i g r a n t s b y Age
a n d E d u c a t i o n a l A t t a i n m e n t , 1 9 7 1 64
3 . 1 4 C a t e g o r y o f L i v i n g U n i t o f M i g r a n t s , by
N um ber o f H o u s e h o l d s , 1971 66
3 . 1 5 L a b o u r F o r c e P a r t i c i p a t i o n R a t e s o f M i g r a n t s a n d o f t h e T o t a l P o p u l a t i o n o f S o u t h S u m a t r a ,
1 9 7 1 (One Week R e f e r e n c e P e r i o d ) 68
3 . 1 6 D i s t r i b u t i o n o f E c o n o m i c a l l y A c t i v e M i g r a n t s (Age 10 Y e a r s a n d A bove) b y E m p lo y m e n t S t a t u s ,
1 9 7 1 (One Week R e f e r e n c e P e r i o d ) 70
3 . 1 7 D i s t r i b u t i o n o f E c o n o m i c a l l y A c t i v e M i g r a n t s
b y O c c u p a t i o n , 197 1 71
3 . 1 8 D i s t r i b u t i o n o f E c o n o m i c a l l y A c t i v e M i g r a n t s
b y I n d u s t r y , 197 1 75
3 . 1 9 P e r c e n t a g e D i s t r i b u t i o n o f R e t u r n M i g r a n t s by
Age a n d S e x , 197 1 79
3 . 2 0 D u r a t i o n o f R e s i d e n c e o f R e t u r n M i g r a n t s , 1 9 7 1 8 0
3 . 2 1 P e r c e n t a g e D i s t r i b u t i o n o f R e t u r n M i g r a n t s by
P r e v i o u s P l a c e o f R e s i d e n c e , 197 1 80
3 . 2 2 P e r c e n t a g e D i s t r i b u t i o n o f R e t u r n M i g r a n t s by
R e g e n c y a n d M u n i c i p a l i t y , 197 1 81
3 . 2 3 M i g r a t i o n To a n d F rom S o u t h S u m a t r a B e t w e e n
1 9 6 6 - 1 9 7 1 83
4 . 1 T r a n s m i g r a t i o n A r e a s i n S o u t h S u m a t r a 91
4 . 2 T r a n s m i g r a t i o n t o S o u t h S u m a t r a b y A r e a s o f
O r i g i n 98
4 . 3 A v e r a g e S i z e o f T r a n s m i g r a n t H o u s e h o l d s M oving
t o S o u t h S u m a t r a D u r i n g t h e P E L IT A -I P e r i o d 102
4 . 4 T he M ain O c c u p a t i o n o f T r a n s m i g r a n t s B e f o r e
Table Title Page
5.1 Percentage Distribution of Migrants in
Palembang and OKU by Total Years Lived in
South Sumatra, 1971 111
5.2 Percentage Distribution of Migrants (0-8 Years
Residence) in Palembang and OKU by Sex and
Broad Age Groups, 1971 113
5.3 Dependency Ratios of Migrant Communities and
of the Total Population of South Sumatra, 1971 115
5.4 Percentage Distribution of Migrant Educational
Attainment in Palembang and OKU, by Sex, 1971 116
5.5 Percentage Distribution of Migrants 10 Years
and Above by Age and Educational Attainment,
in Palembang and OKU, 1971 117
5.6 Labour Force Participation Rates of Migrants
in Palembang and OKU, and of the Urban and Rural Populations of South Sumatra, 1971
(One Week Reference Period) 120
5.7 Percentage Distribution of Economically Active
Migrants and of Urban and Rural Population of South Sumatra, by Employment Status, 1971
(One Week Reference Period) 122
5.8 Percentage Distribution of Migrants Aged
10 Years and Above in Palembang and OKU by
Activity, 1971 (One Week Reference Period) 123
5.9 The Ratio of the Economically Active Migrants
to the Economically Active Population in
Palembang and OKU by Industry, 1971 126
5.10 Percentage Distribution of Economically Active
Migrants, by Occupation and Educational
Attainment, in Palembang and OKU, 1971 128
5.11 The Main Areas of Origin of Migrants in
Palembang and OKU According to Occupational
Status, 1971 131
5.12 Distribution of Migrants by Place of Birth
and Previous Place of Residence, in
LIST OF FIGURES
Figure Title Page
1 Java Born Population in Outer-Islands,
1930, 1961 and 1971 Censuses 32
2 Inter-Islands Migration, Based on Birth
Place Data, 1971 34
3 Percentage of Net Life-Time Migration,
by Province, 1971 34a
4 The Density of Population in South Sumatra, 47
by Region, 1971
5 Pattern of Migration to South Sumatra
(Based on Table 3.8, Column 4) 56
6 Flows of Movement to South Sumatra
(Based on the Previous Place of Residence 57
Data, 1971)
7 Labour Force Participation Rates of Migrants
and of the Total Population of South Sumatra,
1971 69
8 The Distribution of Migrant Population and
the Transmigrant Settlement Areas in South
BAPPENAS BIES BPS becak Dirjen Transmigrasi DKI.Jakarta FEUI IIK IPEDA Kecamatan Kewedanaan LEKNAS LIOT MURA MUBA Outer-islands OKU OKI PUSRI PERTAMINA PN.TIMAH PN.TABA PELITA PPN RAPBD
G L O S S A R Y
Badan Perencanaan Pembangunan Nasional (National Planning Body)
Bulletin of Indonesian Economic Studies Biro Pusat Statistik (Central Bureau of Statistics/CBS)
Unmotorised tricycle vehicle Direktorat Jendral Transmigrasi
(Directorate General of Transmigration)
Daerah Khusus Ibukota Jakarta (Greater Jakarta) Fakultas Ekonomi Universitas Indonesia (Faculty of Economics, University of Indonesia
Institute Ilmu Keuangan (Institute of Finance) Iuran Pembangunan Daerah
(Regional Development Contribution) Sub district
Sub division
Lembaga Penelitian Ekonomi dan Kemasyarakatan
(National Institute of Economic and Social Research) Lematang Ilir Ogan Tengah
Musi Rawas Musi Banyu Asin
This term is used for islands other than Java Ogan Komering Ulu
Ogan Komering Ilir
Pupuk Sriwijaya (Sriwijaya Fertiliser Plant) Perusahaan Pertambangan Minyak Nasional
(National Oil-mining Company) National Tin-mining Company
Perusahaan Negara Tambang Arang Bukit Asam (National Bukit Asam Coal-mining Company)
Pembangunan Lima Tahun (Five Year Development), REPELITA (Five Year Development Plan)
Program Perencanaan Nasional (National Planning Program)
S P P - A D O S u m b a n g a n P e n g g a n t i - A l o k a s i D e v i s a O t o m a t i s ( C o m p e n s a t i o n A i d o f t h e A u t o m a t i c F o r e i g n E x c h a n g e A l l o c a t i o n S y s t e m )
S U S E N A S S u r v e y S o s i a l d a n E k o n o m i N a s i o n a l ( N a t i o n a l S o c i a l a n d E c o n o m i c S u r v e y ) S S C D P S o u t h S u m a t r a C o - o p e r a t i v e D e v e l o p m e n t
CHAPTER 1
I N T R O D U C T I O N
The theory and analysis of regional growth has invited
much attention among scientists since the late 1920s: formerly, the
focus was mainly on national studies. Regional problems that came
later led to extensive reverberations on the development of regional growth theory, especially in the last decade. Among these problems were urbanisation, inter-regional migration, depressed regions and
different economic opportunities among regions. Inter-regional migra
tion, as one aspect that has much influence on regional growth, aroused interest among economists and other social scientists in
their discussions. However, they failed to produce clear and unambig uous results (Richardson, 1973; 1-6 and 89).
The importance of inter-regional migration as Richardson cited can be seen from its role as an adjustment process, followed by
equilibrating effects in the inter-regional economic growth. The
region which has high population pressure on limited land and wide spread disguised unemployment in the rural agricultural sector, does
not stimulate national economic development. It even brings about
economic and social problems in the area concerned. Labour has low
productivity and eventually has low income. Therefore, the regional
economy as a whole cannot be raised. The reallocation of manpower or
Economists have contributed a great deal to the study of
migration. Generally, most attention is paid to the determinants of
labour mobility. In connection with this field, Shaw, in his review,
has categorised the course of studies into four classifications, i.e. (1) in relation to the impact or role of inmigration or outmigration
on the economic adjustment of origin and destination areas; (2)
regarding the performance of migration as a mechanism for the effective
allocation of an economy's labour force; (3) concerning labour force
migration within a push-pull framework; (4) returns to labour force
migration as a form of investment (Shaw, 1975; 53-56).
In the first category, the most significant contribution was made by Lee et al. (1957) , Kuznets et al. (1960) , and Eldridge et al. (1964) in their study of the 'Population Redistribution and
Economic Growth, United States: 1870-1950' (three volumes). This
study regards migration as a factor and consequence of the modernisa
tion and growth of an economy. Kuznets, for example, says:
'...The rapidity and magnitude of the differential impacts that accompany modern economic growth are such that the vital processes of birth and death can play but a minor role in adjusting the distri bution of population to economic opportunities in different parts of the country ... In consequence,
it is migration that must provide the main
mechanism of adjustment, and it is migration that must account for most of the population redistribu
tion that can be viewed as an effect of economic growth ...'
(Kuznets and Thomas in Lee et al., 1957; 2)
d e v e l o p m e n t . F i r s t l y , t h e r e w i l l be a n i n c r e a s e i n t h e incom e p e r
c a p i t a ; t h e p o p u l a t i o n w i l l grow r a p i d l y ; a n d , f i n a l l y , t h e r a p i d
g r o w t h i n in com e p e r c a p i t a w i l l be a c c o m p a n ie d b y s h i f t s i n t h e p r o
d u c t i v e r e s o u r c e s o f t h e economy (K u z n e ts a n d Thomas, 1 9 5 7 ; 1 9 6 - 2 1 1 ) .
I n t h e s e c o n d t y p e , m i g r a t i o n i s v ie w e d a s a m ec h a n is m f o r
t h e r e d i s t r i b u t i o n o f t h e e c o n o m y 's human r e s o u r c e s . L a b o u r i s r e g a r d e d
a s a f a c t o r o f p r o d u c t i o n , t h e r e f o r e a n e f f i c i e n t a l l o c a t i o n o f t h i s
f a c t o r o f p r o d u c t i o n among t h e r e s o u r c e s w o u ld g i v e t h e g r e a t e s t r e t u r n .
S t u d i e s o n m i g r a t i o n a s a n a l l o c a t i v e m ec h a n is m w e r e c o n d u c t e d , f o r
i n s t a n c e , b y T a r v e r (1965) a n d H a r r i s a n d T o d a r o ( 1 9 7 0 ) . O l s s o n ( 1 9 6 5 ) ,
i n t h i s c a s e , h a s p r o v i d e d a n i n t e r e s t i n g d i s c u s s i o n o f m i c r o a n d m a c r o
m i g r a t i o n t h e o r y an d f i n d i n g s i n r e l a t i o n t o f o r m u l a t i n g a s t r a t e g y f o r
t h e i n d u c e m e n t o f r e s e t t l e m e n t m i g r a t i o n .
The t h i r d c l a s s i f i c a t i o n i n t e r p r e t e d i n t e r - r e g i o n a l m i g r a
t i o n a s a f u n c t i o n o f m a n ' s r e s p o n s e t o u n f a v o u r a b l e e c o n o m ic c o n d i t i o n s ,
u n p r o f i t a b l e l a n d t e n u r e s y s t e m s ( p u s h f a c t o r ) , a n d a l s o m a n 's r e s p o n s e
t o t h e p u l l f a c t o r s i n r e l a t i o n t o t h e e c o n o m ic o p p o r t u n i t i e s i n o t h e r
p l a c e s , a m e n i t i e s , e t c . One s u c h s t u d y was done by Rutman (1970) i n
W e st V i r g i n i a .
The l a s t t y p e d e f i n e d m i g r a t i o n i n t e r m s o f g e n e r a l i n v e s t
m en t t h e o r y . S j a a s t a d v i e w s t h e p r o b l e m o f m i g r a t i o n a s o ne o f
r e s o u r c e a l l o c a t i o n , t h e r e f o r e t r e a t i n g l a b o u r m i g r a t i o n a s a human
i n v e s t m e n t w h i c h s p e n d s c o s t s a n d g e t s r e t u r n s . He a l s o e m p h a s i s e d
i t a s t h e m ain c o n c l u s i o n o f h i s p a p e r a s f o l l o w s ( S j a a s t a d , 1 9 62 ; 9 2 ) :
What are the more specific reasons for inter-regional
migration? There is no simple answer to this question. In general,
however, inter-area migration occurs chiefly as a result of 'different economic opportunities in the areas affected', or 'from areas of
inferior economic opportunity to areas of superior economic opportunity'
(United Nations, 1953; 106). Regarding the availability of land and
labour, migrants tend to move from areas of labour surplus to those
with labour shortage (Richardson, 1974; 90). This proposition seems
to point out the significance of labour movement as one of the ways out of regional inequality.
Helleiner, in his study on Nigeria, also gave special
attention to the labour function. In his conclusion he found that
spatial re-allocation from labour surplus areas to land surplus areas could solve the prevailing factor imbalances (G.K. Helleiner in
Soon Lee Ying, 1974; 11).
Finally, it is interesting to quote the earlier theory
of migration. The theory was written by Ravenstein and formulated
as the 'laws of migration'. These were derived from his empirical
study of British migration between 1871 and 1881. Some of his laws
and conclusions are as follows (Ravenstein, 1885 and 1889; 167-226 and 241-301):
(1) '... the great body of our migrants only proceed a
short distance, ... setting in the direction of the great centres of commerce and industry which absorb the migrants.'
(2) The process of migration absorption would go by
f i l l e d u p by m i g r a n t s fro m r e m o t e a r e a s . ' M i g r a n t s e n u m e r a t e d i n a
c e n t r e o f a b s o r p t i o n w i l l . . . grow l e s s ( a s t h e d i s t a n c e fro m t h e
c e n t r e i n c r e a s e s ) . '
(3) 'E a c h c u r r e n t o f m i g r a t i o n p r o d u c e s a c o m p e n s a t i o n
c o u n t e r - c u r r e n t . '
(4) ' M i g r a n t s p r o c e e d i n g l o n g d i s t a n c e s g e n e r a l l y go by
p r e f e r e n c e t o o n e o f t h e g r e a t c e n t r e s o f commerce o r i n d u s t r y . '
(5) The u r b a n d w e l l e r s a r e l e s s m i g r a t o r y t h a n t h o s e
fro m t h e r u r a l a r e a s .
(6) F e m a l e s a p p e a r t o p r e d o m i n a t e among s h o r t - j o u r n e y
m i g r a n t s .
(7) M i g r a t i o n i n c r e a s e s f o l l o w i n g t h e im p ro v e m e n t o f
t e c h n o l o g y .
(8) Econom ic m o t i v e d o m i n a t e s i n t h e d e c i s i o n t o move . . .
' I do n o t q u e s t i o n f o r a moment t h a t t h e p r i n c i p a l , t h o u g h n o t t h e
o n l y c a u s e o f m i g r a t i o n , h a s t o b e s o u g h t f o r i n o n e p a r t o f t h e
c o u n t r y , w h i l s t t h e r e e x i s t e l s e w h e r e u n d e r d e v e l o p e d r e s o u r c e s w h i c h
h o l d o u t g r e a t e r p r o m i s e f o r r e m u n e r a t i v e l a b o u r . I t i s o b v i o u s
t h a t t h i s i s n o t t h e o n l y c a u s e . Bad o r o p p r e s s i v e l a w s , h e a v y t a x a
t i o n , an u n a t t r a c t i v e c l i m a t e , u n c o n g e n i a l s o c i a l s u r r o u n d i n g s , a n d
e v e n c o m p u l s i o n ( s l a v e t r a d e , t r a n s p o r t a t i o n ) , a l l h a v e p r o d u c e d a n d
a r e s t i l l p r o d u c i n g c u r r e n t s o f m i g r a t i o n , b u t n o n e o f t h e s e c u r r e n t s
c a n com p a re i n volu m e w i t h t h a t w h i c h a r i s e s fro m t h e d e s i r e i n h e r e n t
From Ravenstein's Migration Laws there are some conclusions
to be drawn. It is clear that the decision to move is not only
caused by the over-population in some parts of the country, but also
by the economic motives of the migrants. The latter even dominates
the reason for moving. The influence of the Industrial Revolution on
population movement was felt during the period to which Ravenstein
referred. The rapid growth of industries in urban centres created
many opportunities and attracted people from rural areas. They left
their way of life as landless farmers and tried to better themselves
in the towns. Therefore, according to Ravenstein, 'migration means
life and progress: a sedentary population stagnation' (1889; 288). Another important conclusion of this theory is the relationship
between migration and distance. In the simplest sense it seems that
people tend to move to a neighbouring area and those who move to a distant region prefer to stay in the centre of economic activities.
1.1 Basic Concept and Definitions
The concepts of migration used in the Indonesian censuses were similar to those suggested by the United Nations (1970; 3-4). The internal migration data in a census can be obtained by asking
questions concerning the movement of people. Usually, the questions
relate to the place of birth, place of last residence, duration of residence in the place of enumeration, and the place of residence on a specific date before the census.
In Indonesian censuses these types of questions have been
on internal migration was obtained from questions which asked people about their province of birth, whether or not they had ever lived in another province, province of previous residence, and total years lived in the present province (Cho, 1976; 86). A province as an administrative or political unit was the basis of migration tabula
tion in the census. This concept of migration ignores a considerable
part of movement which involves the activities of daily life such as commuting to and from the place of work, visiting, shopping, and
travelling. It was also excluding the movement within a province.
Thus, in the Indonesian context (census tabulation) a person who changed his place of residence from one province to another was
defined as a migrant. The definition includes those who intended to
stay permanently in the new province and those who had travelled to and settled in another province for more than six months.
Some other concepts of migration used in this study are given below with their definitions:
Life-time migrant: a person whose area of residence at
the census or survey date differs from his area of birth. The number
of persons in this group is commonly referred to as 'life-time
migration'. However, this number gives a gross understatement of
the amount of migration that has occurred during the life-time of the living population as well as the number of persons who have
migrated. It does not include all moves that occurred between depart
ure from the area of birth and arrival in the area of residence. It
Return migrant (life-time return migrant): those persons who have returned to their areas of birth after having migrated at
least once in their life-time.
Ever-migrated people: the number of life-time migrants
including the life-time return migrants.
Migrants by previous place of residence: similar to the
'ever-migrated people' (life-time migrants plus return migrants), that is, all persons who have ever lived outside their area of birth (United Nations, 1970; 18).
Recent migrants: those who moved during the last five
years preceeding the census.
1.2 Interest in the Study
The pattern of population settlement in Indonesia reflects
its economic and social development. Uneven distribution of population
and differences in regional economic potential are the main predeter
mining factors of internal migration. Internal migration in Indonesia
is low when compared with developed countries. Alden Speare indicated
that the life-time inter-provincial migration in Indonesia, according to the 1971 census, was only 4.8 per cent of the population. Although one should not compare the United States with Indonesia in this matter, the corresponding figure for the United States is at least 20 per cent in each census for the past 100 years (Lembaga Demografi, June 1975; 66).
as well as in the process of achieving an interdependent national
economic system. The high population density of Java has worried
the government since the Dutch period. The effort to move people from
Java to the outer islands, begun in 1905, is still going on. In some
parts it is considered the most important program in solving the popu lation and economic problems of both the originating and the receiving
areas. In the framework of the national economic system, regions
should not have wide disparities (PPN.FEUI-BAPPENAS, 1973). While
some bordering regions have similar types of economic activities,
others are quite different. In other words, regions are to be linked
by economic activity chains and the development process is supposed
to create an interdependent economic system. There is no region which
will grow independently although each region has its own unique
characteristics. In terms of development, each region should provide
economic support to other regions.
The prevailing process of internal migration, whether it is categorised as unguided or guided (transmigration), eventually affects the receiving areas: North Sumatra, Lampung and South Sumatra pro vinces (the last two formerly being one province) have been the largest receiving areas respectively. Migrants comprise more than 50 per cent
of Lampung's total population. South Sumatra is not as extreme as
Lampung but in the future it will receive many transmigrants. Conse
quently, there are two points which should be considered: (1) the
1.3 Objectives
The purpose of this study is to see how internal migration to South Sumatra has affected the regional development of the province. Specifically, the study will:
(1) examine the characteristics of migrants in South Sumatra;
(2) distinguish guided migration (transmigration) from unguided migration;
(3) determine the influence of migration on population growth and distribution;
(4) determine the migrant's contribution to the economic activity of the province.
1.4 Sources of Data
The main data source for this study is the 1971 Population
Census of Indonesia. The data on transmigration between 1929 and 1976
were obtained from the South Sumatra Transmigration Office, and unpub lished data from the Directorate General of Transmigration have also
been used. Some additional supporting data are taken from surveys
which were conducted by the Faculty of Economics, University of
Sriwijaya, LEKNAS, the Directorate General of Transmigration, and the University of Bonn.
1.5 Outline of the Thesis
In the following chapter (Chapter 2), consideration will be given to the general problem of regional inequalities and the
Chapter 3 will examine the number of immigrants to South
Sumatra province. The emphasis will be on the 1971 Population Census
data. The demographic and economic characteristics of these migrants,
including their distribution, will also be discussed in this chapter.
Chapter 4 will examine the implementation of transmigration to South Sumatra separately. The characteristics of the transmigrants
will be described in this chapter. As a part of immigration, this
chapter could form a supplement to Chapter 3 and also to Chapter 5.
In Chapter 5, discussion will be focussed on immigrants in OKU regency and Palembang municipality as the largest receiving
areas. The significance of immigrants in these two areas will be
discussed. Some important characteristics and conditions of immigrants
will also be reviewed.
CHAPTER 2
DEVELOPMENT PLANNING AND INTERNAL MIGRATION IN INDONESIA
Thic chapter presents a background of the provincial
situation, both demographically and economically. Included is a dis
cussion on internal migration in Indonesia, and a short feature on
the implementation of colonisation and transmigration by the government.
2.1 Regional Development
Indonesia, as the fifth most populous country in the world,
has a large physical size consisting of thousands of islands. It is
inhabited by many different kinds of people. They are different in
race, language, custom, culture, and religion. These scattered islands
are separated from each other by straits and seas. Some islands are
connected by a relatively good system of transportation and communica
tion, especially between the big islands. Others still have poor
systems and are isolated and backward. This is because geographically
these islands are scattered and are difficult to reach. Also, the transportation system is a problem on land because of the scarcity of
roads and railways. However, since the First Five Year Development
Program of 1969/70 - 1973/74, these conditions have been continually improving.
terms, each island or more specifically each province is different in
size, in natural resources and in quality of soil. Consequently, the
growth of the regions varies and this is reflected in the rate of change
in economic magnitude and living conditions. Three groups of regional
differences have been recognised in Indonesia: differences in general
aspects such as differences in area, population, and regional government
finance; differences in production; and differences in trade/export
(Hariri Hady, 1970; 1-21). These regional differences are described
below.
2.1.1 Area and Population Distribution Differences
The area distribution as shown in Appendix A.l, demonstrates
the difference in size among provinces. They range from 19,023 km12 to
2
421,981 km , excluding some small and special regions such as DKI
Jakarta, Bali, and Yogyakarta. The division into provinces is based
on political considerations rather than economic conditions. Therefore, some provinces have difficulties in managing their land areas due to
their size, shape, or occurrence of natural barriers. It is very diffi
cult to prepare a regional economic plan, as most of the peripheral
areas have the same economic system as the neighbouring provinces. For
instance, some regions such as West Kalimantan, East Kalimantan,
Central Kalimantan and Irian Jaya have an insufficient system of trans
portation and communication. In addition, these regions contain such
natural barriers as large swamp lands, mountainous regions and tropical
jungles. Certainly these larger regions face tremendous problems in
the administration of their areas. Similarly, the same problems are
found in the provinces that consist of many widely scattered small islands such as Maluku and the Nusa Tenggara provinces.
Concerning the differences in population size and density,
Indonesia faces two kinds of problems. Firstly, the problem of over
population includes all provinces in Java, Bali and Lombok. Secondly,
the problem of under-population faces the rest of the country. The
latter areas consist of about 90 per cent of the country's total land
area. The results cause some obstacles and unfavourable conditions
in regional development. Provinces in Java are economically more
advanced as compared with the outer regions. Moreover, these regions
can provide cheap labour and large marketing areas. In contrast, most
other parts of Indonesia, where population density is relatively low, are experiencing unattractive conditions in terms of economic develop
ment. The scarcity of labour and lack of marketing areas are the
main problems in stimulating the growth of economic activities.
In the case of South Sumatra, this province could be categorised as one of the largest area provinces in Indonesia
2
(103,688 km ). It is the fifth after Irian Jaya, East Kalimantan,
Central Kalimantan, and West Kalimantan. Relative to its number of
people, however, South Sumatra is one of the provinces with a lower 2
population density (33/km ). This province consists of mountainous
and hilly areas to the east. Some islands lie in the eastern part,
2.1.2 Financial Resources of Provinces
Provincial financial resources are very important for the continuation of regional development, especially in developing and
maintaining many social and economic overhead facilities. The lack of
financial sources often not only limits the development plan, but also
restrains the opportunity to choose among certain projects. Conse
quently, the projects or activities are not properly implemented and the target is achieved only to the extent that finances are available.
There are two groups of provincial financial resources, namely revenue from the central government and revenue from local
sources. In fact, provinces are not able to raise their own local
sources and this is partly because of lack of capability of local
administrators. There are numerous big government enterprises/
industries operating in each province. However, their contribution
to supporting the provincial revenue is not large enough. The big
taxes such as income-tax, company-tax, and property-tax belong to the
central government. Therefore, the greater part of the regional
budget depends upon aid from the central government.
Before the initiation of the Second Five Year Development Plan, provincial budgets were highly dependent upon two main sources of finance. These were the Central Government Subsidy and the
Compensation Aid of the Automatic Foreign Exchange Allocation System
(SPP-ADO) = Sumbangan Pengganti Alokasi Devisa Otomatis). Under this
system, provinces received their SPP-ADO from ten per cent of the
export value originating from their own region. Definitely, this
On an average, both sources contributed about 90 per cent of the regional budget. But for most of the provinces, the central
government subsidy constituted at least 80 per cent of their budgets, except in DKI-Jakarta, North Sumatra and South Sumatra, where it was only about 30 per cent to 40 per cent.
To get a clearer idea of the provincial budget system, the following example will show the details of the regional revenue.
The RAPBD (Regional Budget) of South Sumatra province for the period of 1971/1972 was as follows:
Revenue from the Central Government: 1. Central Government Subsidy
2. SPP-ADO
3. Regional Development Contribution (IPEDA)
4. Licence Fee/Royalty 5. Kerosene Sold
6. Petrol Opcenten (Surtax) 7. Copra Rehabilitation 8. Rice Sold Premium
9. Cess (Tax on the exports of the main agricultural product,
i.e. pepper, coffee, rubber)
Total (I)
Rp.1,846,366,400 (28.3%) - 3,844,607,000 (59.0%) 35,000,000 (0.5%) 96,000,000 (1.5%) 12,000,000 (0.2%)
_
Rp.5,833,973,400 (89.5%)
Revenue from Local Sources: 1. Taxes
2. Retribution
Government Development Agencies Revenue (Pendapatan Dinas2) Others
Balance of the 1970/1971 Budget
- Rp.684,534,000*
Total (II) = Rp. 684,534,000 (10.5%)
Total (I) + (II) = Rp.6,518,507,400 (100%) (IIK, Laporan Survey 1971-1972; 97-107)
The above example explains the situation of the regional
budget. The contents are almost- the same in other provinces. The
variation occurs only in the amounts of money in each budget item. Clearly, the central government subsidy and the SPP-ADO contributed a high portion of the provincial revenue.
There are two other programs that are funded by the central
government under the Rural Public Works Programs. These programs
allocate central government funds directly to the regencies/munici palities on a per capita basis (Rp.400 per capita in 1975/76). Also they allocate money to villages throughout Indonesia for development projects (Rp.300,000 per village in 1975/76 (see Supplement of
President's Speech, August 1976)). To some extent, these programs tend to promote inter-provincial disparities.
Since the initiation of the Second Five Year Development Program (1974/75-1978/79), the SPP-ADO has been changed to Province
Development Aid (Bantuan Pembangunan Daerah Tingkat I). The reason
behind this move was to minimise the regional differences in financial
problems. The aid was now based on the length of the provincial
roads, the cultivated agricultural areas, and it also took into con
sideration the regional conditions. The minimal amount of this aid
was 500 million rupiah. The poor regions could therefore solve some of their financial problems in the development program.
From Appendix A.2 the variation in SPP-ADO amounts received by each province can be seen before it was changed to Province
Development Aid. Simultaneously, it shows the natural richness of
highest receivers of ADO-SPP. In other words, these two areas had the
highest export values originating from each of them. It is worth
noting however, that the combined Province Development Aid and the central government subsidy still dominated the budget in each province.
2.1.3 Production
In the manufacturing and industrial sectors, most of the investment took place in the provinces of Java, and was mainly concen trated in Jakarta, Surabaya, and surrounding areas. This is reasonable because these areas provided all of those strategic facilities needed
for industry. In the areas outside Java the growth in manufacturing
has taken place to a lesser extent in the southern and northern parts of Sumatra and the southern parts of Sulawesi, concentrated mainly in Medan, Palembang and Ujung Pandang respectively (Ibrahim, 1973; 1-11).
In the agricultural sector, especially in the traditional export commodities such as copra, rubber, palm oil and coffee, the
annual rate of growth is low. Although these products contribute a
substantial percentage of national exports, the growth in these commo dities is not rapid enough to create any significant income for the
people in the producing regions. Growth occurred rapidly in forestry
and fisheries and in oil-mining. These sectors indeed, could stimu late the general improvement of the region.
Rice is the most important produce in Indonesia. Social
and political conditions may be affected if the production, the price,
or import of rice are disturbed. So far, all provinces in Indonesia
in fact, is related to the lack of transportation for redistributing
the product from the surplus provinces. The level of rice production
in Indonesia as a whole is not yet satisfactory. Although Java's total land area is relatively small, the large rice farming area is
in Java. Out of total harvested areas in Indonesia in 1973, about
54 per cent were in Java and this produced 61 per cent of the Paddy's production for the country. This fact is due to the ecological
differences between Java and the majority of the outer-island areas. As Geertz wrote in his book, 'the flourishing of wet rice agriculture in Java has generally been explained by the happy combination of fire
(volcanic activities), water (rivers), earth (well-drainaged land)
and air'. He also emphasised that the nicely appropriate landscapes
for wet-rice cultivation do not exist in almost all parts of the outer-islands (Geertz, 1963; 38-39).
Manufacturing and agricultural products are produced in
the Java region in large portions. However, the wealth of the people
is contrary to this. The regional income survey that was conducted
by the team from the Faculty of Economics, University of Indonesia (FEUI, 1974; Tables 2A.1 and 2A.5) showed that the per capita Gross Regional Domestic Product of this region was relatively less than that for regions outside of Java (except DKI-Jakarta) with lower than the average income per capita of Indonesia both in 1968 and 1972,
(see Appendix A.3).^ The GRDP in some provinces outside Java is
1 The discussion on the regional income disparities has also been
done by Esmara (BIES, March 1975, vol.XI, no.l). The other side
higher not only because of richness of their resources - the high con centration of people in Java is also responsible for this disproportion.
Some figures, which are demonstrated in Appendices A.2 and A.3, have put South Sumatra among the richest areas in Indonesia, in
terms of its resources. It contributes an important source of national
income to the country from many big government industries which operate in this province, e.g. oil-mining and refinery, the fertiliser industry and other petro-chemical industries, tin-mining, coal-mining and many
other big and medium industries. Export of these products brings in
much income for the government. Some other major export commodities
originating from this province are rubber, coffee, pepper, timber and so on.
In analysing the economic condition of the population in South Sumatra as a whole, one should not base one's views on these illustrations. There are two things which should be taken into con
sideration: i.e. that almost all of the income from the government
industries goes to the central government; and the fact that Palembang
city is the centre of the majority of industries in this province. Therefore, the benefits obtained from big industries are not directly enjoyed by a large proportion of the population, particularly those
who live in rural areas. Ironically, despite all these features and
2.1.4 Regional Development Policy
The objectives and directions of national development have been decreed in the State Main Policies (Garis-Garis Besar Haluan Negara) . It is emphasised that the aim of Indonesian development is social justice and prosperity in the communities (Masyarakat Adil-Makmur) (REPELITA II, Book I; 1). Therefore, the three development objectives derived from this major principle mentioned in each develop ment plan a r e :
(1) political integration and stability (2) the maximisation of economic growth (3) the reduction of regional disparities.
There are other objectives such as employment maximisation and equitable income distribution in addition to the three mentioned above.
Regional disparities in Indonesia already mentioned are strongly felt in the economic sectors. The differences in income, regional potential, manpower and infrastructure'1' are the most prominent disparities. These differences are also felt in the social sector in areas such as education, health, culture and religion. The regional development seminar conducted by PPN (National Planning Program) pointed out the most important key to solving the problem of regional disparities in Indonesia was infrastructure.
1 Infrastructure-structure of component parts, or a system as backing for development purposes (for example, communication, transportation, irrigation, electricity, hospitals, schools).
It is hoped that by providing economic and social infra structure needed by the regions, the effort of regional development
can be carried out properly. It is also expected that the balance
in economic development will eventually be concomitant with the move ment of regional potential (such as products and manpower) (PPN, 1973;
274-276). The growth and development of such rich regions outside of
Java will invite people to move there, especially if the transportation systems to those regions are good and easy and also not too costly. The potential resources that have never been exploited will attract people to obtain better jobs and improve their standard of living. Therefore, the need to subsidise migrants will no longer be necessary
since they themselves can choose to which particular region they intend
to g o . Certainly this situation could save some of the government
budget that is already spent on transmigration schemes. The fast
growth of economic and social conditions in the outer islands will also reduce the considerably large numbers of people migrating to Java. Logically, the images which outer-islands people have that Java can provide everything if they can only go there, will gradually disappear.
In South Sumatra, the development of infrastructure since independence to the late 1960s, particularly the transportation net work, was very slow and almost experienced no development at all. Palembang was possibly the only area which did benefit somewhat from
progress during this period. Since the PELITA-I was commenced (1969/70),
the social and economic development of South Sumatra, especially in
urban areas, have shown much improvement. The development of trans
In regional development strategy, the region should be
looked at from two sides: from its most beneficial function in the
national development context, and from the individual economic structure
of each region in the range of sectors of activity. From the first
instance arises the importance of regionalisation arrangements. For
example, South Sumatra, Bengkulu and Jambi provinces are geographically
and economically interconnected with each other. Therefore, in making
a development strategy for these areas, they should be viewed as one
region. In the second framework, each region will have a different
strategy and will be developed according to the characteristics of
that particular region. Some areas are dominated by agricultural,
manufacturing, mining or social services sectors. Then the development
plan should be based on the primarily dominant sector in each province.
In the national development strategy level which was pro posed by BAPPENAS (National Planning Body), 'Palembang area' is one
of the ten growth centres. This area covers South Sumatra province,
Bengkulu province, Jambi Province (except Kerinci regency) and the
North Lampung regency as hinterland of the Palembang area. In order
to carry out development in South Sumatra province itself, the local
government has divided the area into six development units. This
division is based on the characteristics of the area concerned, and also takes into consideration the three major transportation systems
-river, railway and road. These units of development are (Pemerintah
Daerah Propinsi Sumatera Selatan, 1973; 38-40):
2. Sekayu development unit, with Sekayu (regency capital) as its centre;
3. Lubuk Linggau development unit, with Lubuk Linggau (regency capital) as the centre;
4. Lahat development unit (covers Semendo area), with Lahat (regency capital) as the centre;
5. Baturaja development unit, with Baturaja (regency capital) as its centre;
6. Bangka-Belitung development unit, with Pangkal Pinang municipality as the centre.
It should be noted that these proposed divisions (for the PELITA-II) are not the same as the administrative divisions in this
province. This plan is supposed to be a guide for the government in
carrying out the development tasks.
2.2 Internal Migration in Indonesia
Internal migration in Indonesia has two facets. The first
purpose of this study, however, is mainly to discuss the province to province movement (inter-regional movement).
In measuring migration in Indonesia, one has to face the
difficulties of collecting comparable data. The 1930, 1961 and 1971
censuses have collected migration data. Data on migration in the 1930
census were extremely good, but they are not completely comparable with the data in the recent censuses (1961 and 1971), especially with regard to the changes in area. Actually, the 1961 and 1971 censuses should enable competent people to produce migration data in more detail. Unfortunately, the 1961 census was not fully processed due to the
political, economic, and administrative problems of that period (Cho,
1976; 77). In addition, some survey results that are relevant to
migration can be matched in order to get relatively good migration
data. The importance of data is not only for presenting the migration
facts, but also for the purpose of future perspective in the develop ment process.
2.2.1 Population Mobility
It has been mentioned before that the life-time inter provincial migration in Indonesia was only 4.8 per cent of the popula
tion in 1971. This figure shows that the volume of migration is
relatively small. Therefore one can conclude that Indonesia has a
highly immobile population. The same observation can be arrived at
by tracing back to the earliest data. The 1930 census data revealed
a movement of 5.63 per cent (3,332,508) of the population to different
population born in the same residency. Therefore, only 1.0 per cent
of them had moved to other residencies (McNicoll, 1968; 40). It is
worth noting that these figures are rather high because residency
administrative areas in 1930 were smaller compared with provinces. At
present almost all provinces consist of at least two residency areas.
The stability of the population is also supported by the Labour Force Sample Surveys that were conducted by the Department of
Labour in 1957 and 1958 (in McNicoll, 1968). The 1958 survey showed
that 3.5 per cent of the urban population in Java had moved to other
villages over the previous year. The corresponding case in rural
areas was only 1.3 per cent. It should be remembered that this survey
did not take into account outmigration from rural areas both to the cities and to the outer-islands, so it had only recorded the movement within rural areas in Java.
The National Sample Survey that was conducted in 1964/1965 showed a broader picture concerning the mobility of the population. The results were broken down into Java and outer-islands regions.
It showed that the movement of people to urban areas in Java was higher
than to urban areas in the outer-islands. The proportion of the popu
lation who were migrants in urban Java was 3.0 per cent and 12.1 per cent using one year and five year reference periods respectively. However, migrants represented a higher proportion of the population in the rural areas in the outer-islands than they did in rural Java
(see Appendix A.4).
In the 1961 census, the stability of population became
of people who were born outside each province. The percentages of the rural population that were born outside West Java, Central Java,
Jogyakarta and East Java were 1.2 per cent, 0.9 per cent, 1.7 per cent
and 0.7 per cent respectively. It also showed that the percentage of
people who were born in the outer-islands and living in rural Java was
very low. On an average, it was only 0.1 per cent of the rural popula
tion of each province in Java. In Java urban populations, for every
ten people who moved to urban areas, about two people came from the
outer-islands. The remainder came from other provinces within Java.
In the outer-islands, the figures for rural areas were almost the same
as those in Java with the exception of Sumatra. Sumatra's rural popu
lation had a higher percentage of people who were born in Java (9.5
per cent). Certainly this is strongly related to the implementation
of the transmigration program which has moved a large number of people to this region.
2.2.2 Inter-regional Migration
Possibly the most important factor in presenting inter regional migration patterns in Indonesia is to distinguish the pro vinces/regions according to whether they have been receiving areas or
sending areas. In view of the high population density in Java, the
conclusion is that, in general, Java is mainly an area of origin and
the outer-islands are the receiving areas. Although this statement