METHODS FOR THE SIMULTANEOUS ESTIMATION OF
TENELIGLIPTIN HYDROBROMIDE HYDRATE AND
GLIMEPIRIDE IN BULK AND TABLET DOSAGE FORM
A Dissertation Submitted to
THE TAMIL NADU DR. M.G.R. MEDICAL UNIVERSITY CHENNAI-600032
In partial fulfillment of the requirement for the award of the Degree of
MASTER OF PHARMACY
in
PHARMACEUTICAL ANALYSIS
OCTOBER-2018Submitted by
N. Abinaya
(Reg. No. 261630751)
Under the Guidance of
Mr. I. Ponnilavarasan, M.Pharm, (Ph.D),
Asst. Professor, Department of Pharmaceutical Analysis.
DEPARTMENT OF PHARMACEUTICAL ANALYSIS KMCH COLLEGE OF PHARMACY,
KMCH College of Pharmacy, Kovai Estate, Kalapatti Road, Coimbatore - 641 048. Tamil Nadu
CERTIFICATE
This is to certify that the dissertation work entitled “DEVELOPMENT AND VALIDATION OF RP-HPLC AND HPTLC METHODS FOR THE SIMULTANEOUS ESTIMATION OF TENELIGLIPTIN HYDROBROMIDE HYDRATE AND GLIMEPIRIDE IN BULK AND TABLET DOSAGE FORM” was carried out by Ms. N. Abinaya (Reg. No. 261630751). The work mentioned in the dissertation was carried out at the Department of Pharmaceutical Analysis, KMCH College of Pharmacy, Coimbatore, Tamilnadu, under the guidance of Mr. I. Ponnilavarasan, M.Pharm, (Ph.D), for the partial fulfillment for the degree of Master of Pharmacy during the academic year 2017-2018 and is forwarded to the Tamilnadu Dr.M.G.R.Medical University, Chennai.
Date: Signature
Place: Coimbatore Prof. Dr. A. RAJASEKARAN, M.Pharm., Ph.D.
Mr. I. Ponnilavarasan, M.Pharm, (Ph.D),
Asst. Professor, Dept. of Pharmaceutical analysis, KMCH College of Pharmacy,Kovai Estate, Kalapatti Road, Coimbatore -641 048. Tamil Nadu
CERTIFICATE
This is to certify that the dissertation work entitled “DEVELOPMENT AND VALIDATION OF RP-HPLC AND HPTLC METHODS FOR THE SIMULTANEOUS ESTIMATION OF TENELIGLIPTIN HYDROBROMIDE HYDRATE AND GLIMEPIRIDE IN BULK AND TABLET DOSAGE FORM” is a bonafide work carried out by Ms. N. Abinaya (Reg. No. 261630751). The work mentioned in the dissertation was carried out at the Department of Pharmaceutical Analysis, KMCH College of Pharmacy, Coimbatore, Tamil Nadu, under my supervision and guidance during the academic year 2017-2018.
This research work either in part or full does not constitute any of any thesis / dissertation.
Date: Signature
Place: Coimbatore Mr. I. Ponnilavarasan, M.Pharm, (Ph.D)
DECLARATION
I do here by declare that to the best of my knowledge and belief ,the dissertation work entitled “DEVELOPMENT AND VALIDATION OF RP-HPLC AND HPTLC METHODS FOR THE SIMULTANEOUS ESTIMATION OF TENELIGLIPTIN HYDROBROMIDE HYDRATE AND GLIMEPIRIDE IN BULK AND TABLET DOSAGE FORM” submitted to the Tamil Nadu Dr. M.G.R. Medical university , Chennai, in the partial fulfillment for the Degree of Master of Pharmacy in Pharmaceutical Analysis, was carried out at Department of Pharmaceutical Analysis, KMCH College of Pharmacy, Coimbatore under the guidance of Mr. I. Ponnilavarasan, M.Pharm, (Ph.D) during the academic year 2017-2018.
Date: Signature
Place: Coimbatore N. Abinaya (Reg. No.261630751)
EVALUATION CERTIFICATE
This is to certify that the work embodied in the thesis entitled “DEVELOPMENT AND VALIDATION OF RP-HPLC AND HPTLC
METHODS FOR THE SIMULTANEOUS ESTIMATION OF
TENELIGLIPTIN HYDROBROMIDE HYDRATE AND GLIMEPIRIDE IN BULK AND TABLET DOSAGE FORM” submitted by Ms. N. Abinaya (Reg. No:261630751) to the Tamil Nadu Dr. M.G.R. Medical university, Chennai, in the partial fulfillment for the Degree of Master of Pharmacy in Pharmaceutical Analysis, is a bonafide research work carried out by the candidate during the academic year 2017-2018 at KMCH College of Pharmacy, Coimbatore, Tamilnadu and the same was evaluated by us.
Examination Center: K.M.C.H College of Pharmacy, Coimbatore
Date:
Internal Examiner External Examiner
Dept. of Pharm. Analysis, K.M.C.H College Of Pharmacy
ABBREVIATIONS
HPTLC
High performance thin layer chromatography
HPLC
High Performance Liquid Chromatography
UV
Ultra violet
IP
Indian Pharmacopoeia
USP
United States Pharmacopoeia
M.W.
Molecular weight
BA
Bioavailability
e.g.
Example
i.e.
That is
%
Percentage
PDA
Photo Diode Array
mg
Milligram
ACN Acetonitrile
MET Methanol
ng
Nanogram
g
gram
µg
Microgram
ml
Milliliter
w/w
Weight by weight
v/v
Volume by volume
µg/ml
Microgram per milliliter
ng/spot
Nanogram per spot
RSD
Relative standard deviation
SD Standard deviation
LOD Limit of detection
LOQ Limit of quantification
pH
Hydrogen ion concentration
°C
Degree Celsius
t
Time
Dept. of Pharm. Analysis, K.M.C.H College Of Pharmacy
h
Hours
R
tRetention time
Abs.
Absorbance
Conc.
Concentration
Fig.
Figure
NaOH Sodium hydroxide
HCl Hydrochloric acid
H2O2 Hydrogen peroxide
NMT Not more than
Dept. of Pharm. Analysis, K.M.C.H college of pharmacy
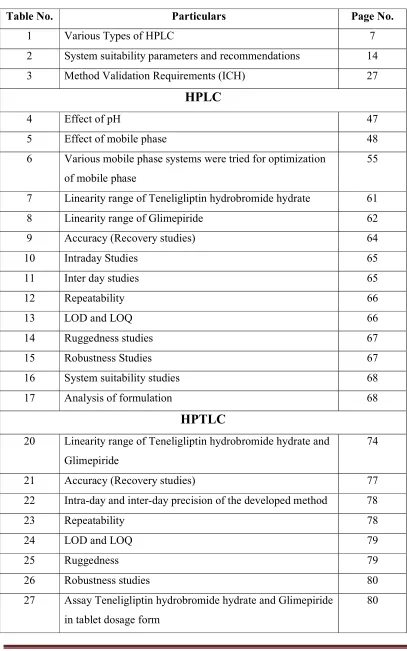
LIST OF TABLES
Table No. Particulars Page No.
1 Various Types of HPLC 7
2 System suitability parameters and recommendations 14
3 Method Validation Requirements (ICH) 27
HPLC
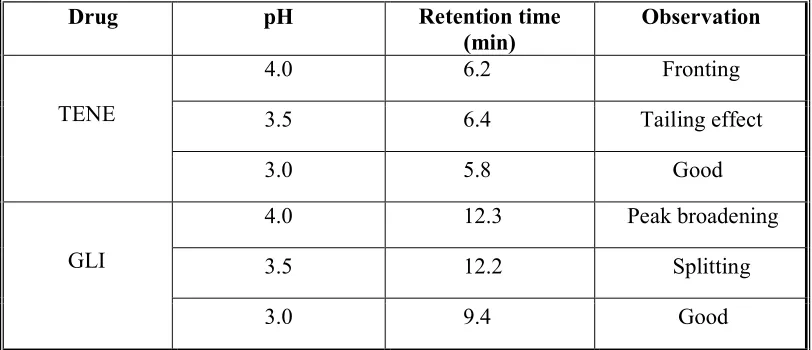
4 Effect of pH 47
5 Effect of mobile phase 48
6 Various mobile phase systems were tried for optimization of mobile phase
55
7 Linearity range of Teneligliptin hydrobromide hydrate 61
8 Linearity range of Glimepiride 62
9 Accuracy (Recovery studies) 64
10 Intraday Studies 65
11 Inter day studies 65
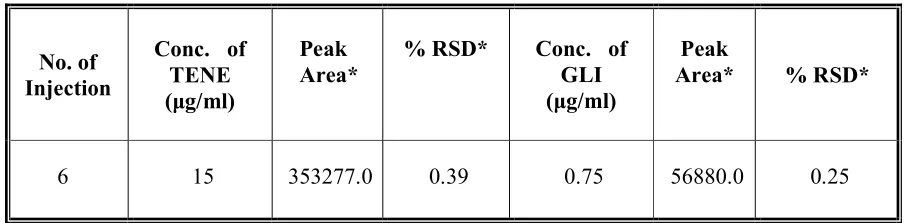
12 Repeatability 66
13 LOD and LOQ 66
14 Ruggedness studies 67
15 Robustness Studies 67
16 System suitability studies 68
17 Analysis of formulation 68
HPTLC
20 Linearity range of Teneligliptin hydrobromide hydrate and Glimepiride
74
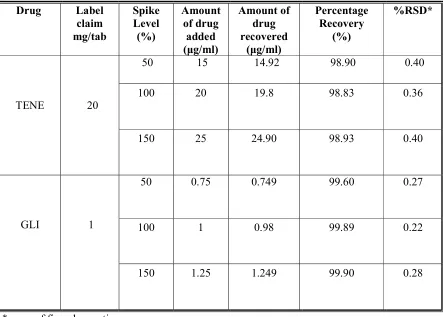
21 Accuracy (Recovery studies) 77
22 Intra-day and inter-day precision of the developed method 78
23 Repeatability 78
24 LOD and LOQ 79
25 Ruggedness 79
26 Robustness studies 80
27 Assay Teneligliptin hydrobromide hydrate and Glimepiride in tablet dosage form
Dept. of Pharm. Analysis, K.M.C.H College Of Pharmacy
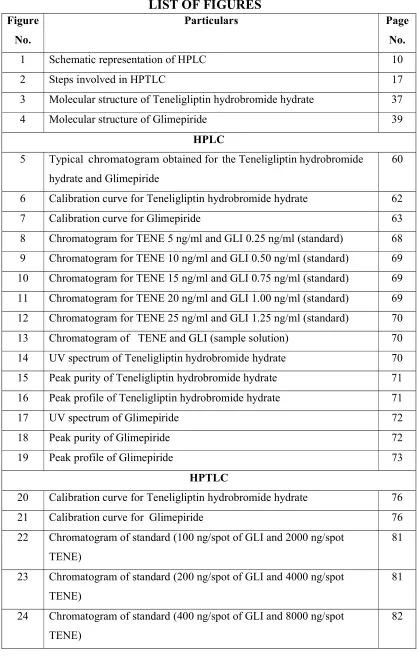
LIST OF FIGURES
FigureNo.
Particulars Page
No.
1 Schematic representation of HPLC 10
2 Steps involved in HPTLC 17
3 Molecular structure of Teneligliptin hydrobromide hydrate 37
4 Molecular structure of Glimepiride 39
HPLC
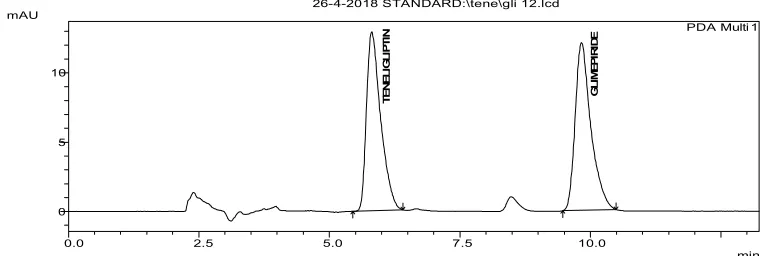
5 Typical chromatogram obtained for the Teneligliptin hydrobromide hydrate and Glimepiride
60
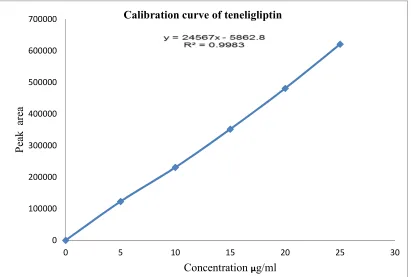
6 Calibration curve for Teneligliptin hydrobromide hydrate 62
7 Calibration curve for Glimepiride 63
8 Chromatogram for TENE 5 ng/ml and GLI 0.25 ng/ml (standard) 68
9 Chromatogram for TENE 10 ng/ml and GLI 0.50 ng/ml (standard) 69
10 Chromatogram for TENE 15 ng/ml and GLI 0.75 ng/ml (standard) 69
11 Chromatogram for TENE 20 ng/ml and GLI 1.00 ng/ml (standard) 69
12 Chromatogram for TENE 25 ng/ml and GLI 1.25 ng/ml (standard) 70
13 Chromatogram of TENE and GLI (sample solution) 70
14 UV spectrum of Teneligliptin hydrobromide hydrate 70
15 Peak purity of Teneligliptin hydrobromide hydrate 71
16 Peak profile of Teneligliptin hydrobromide hydrate 71
17 UV spectrum of Glimepiride 72
18 Peak purity of Glimepiride 72
19 Peak profile of Glimepiride 73
HPTLC
20 Calibration curve for Teneligliptin hydrobromide hydrate 76
21 Calibration curve for Glimepiride 76
22 Chromatogram of standard (100 ng/spot of GLI and 2000 ng/spot TENE)
81
23 Chromatogram of standard (200 ng/spot of GLI and 4000 ng/spot TENE)
81
24 Chromatogram of standard (400 ng/spot of GLI and 8000 ng/spot TENE)
Dept. of Pharm. Analysis, K.M.C.H College Of Pharmacy
25 Chromatogram of standard (800 ng/spot of GLI and 16000 ng/spot TENE)
82
26 Chromatogram of standard (1000 ng/spot of GLI and 20000 ng/spot TENE)
83
27 Chromatogram of sample 83
28 Over all 3D diagram for TENE and GLI (standard and sample) 84
29 Overlay spectrum of Glimepiride 84
30 Overlay spectrum of Teneligliptin hydrobromide hydrate 85
31 Overlay spectrum of standard and Sample ( TENE and GLI ) 85
Dept. of Pharm. Analysis, K.M.C.H College Of Pharmacy
CONTENTS
SN TOPIC Page No.
1 INTRODUCTION 1
2 REVIEW OF LITERATURE 28
3 DRUG PROFILE 37
4 AIM AND OBJECTIVES 41
5 PLAN OF WORK 42
6 METHODOLOGY 43
7 RESULTS AND DISCUSSION 60
8 SUMMARY 87
9 CONCLUSION 90
Dept. of Pharm. Analysis, K.M.C.H College Of Pharmacy 1
1.
INTRODUCTION
Analytical method development and validation plays a main role in the discovery, development and manufacture of pharmaceuticals. Analytical methods are used to ensure identity, purity and potency of the drug products. There are various factors to be considered while developing analytical methods. At first collect the information about the analyte’s physicochemical properties for e.g. pKa, log p, solubility etc.
The analytical chemistry is often be the described the area of chemistry responsible for characterizing the composition of the matter, both qualitatively (what is present) and quantitatively (how much is present). Analytical chemistry is not separate branch of chemistry, but simply application of chemical knowledge. The pharmaceutical analyst’s in the respective quality control and quality assurance department (QA&QC) will check whether the products are complying with the standard or not. [1-2]
There are mainly two types of chemical analysis: 1. Qualitative (Identification)
2. Quantitative (Estimation)
1. Qualitative analysis: It is performed to establish composition of natural or synthetic substances. These tests are performed to indicate whether the substance or compound is present in the sample or not.
2. Quantitative analysis: This is mainly used to quantify any compound or substance in the sample.
Common techniques for analysis 1. Chemical methods [3]
a) Volumetric or titrimetric methods b) Gravimetric methods
c) Gasometrical analysis 2. Electrical methods
3. Instrumental methods
4. Biological and microbiological methods [4-7]
There are various types of instrumental methods available for the analysis of the drugs and drug products. Some of them are
UV –Visible spectrophotometry
Dept. of Pharm. Analysis, K.M.C.H College Of Pharmacy 2 X-ray spectroscopy
Nuclear magnetic spectroscopy (NMR)
High performance liquid chromatography (HPLC)
High performance thin layer chromatography (HPTLC)
Mass spectrometry
Gas chromatography-mass spectrometry (GC-MS)
Liquid chromatography-mass spectrometry (LC-MS)
1. Chemical methods:
a) Titrimetric and volumetric methods:
It involves the reaction of separation in substances to be determined with the appropriate reagent as the standard solution and volume of solution required to complete the reaction is determined.
b) Gravimetric methods:
In gravimetric analysis, a substance to be determined is converted to an insoluble precipitate in the purest form, which is then collected and weighed.
c) Gasometrical analysis:
Gasometry involve the measurement of volume of gas evolved or absorbed in a chemical reaction.
2. Electrical methods:
Electrical methods of involve the measurement of electric current, voltage or resistance in relation to the concentration of some spices in the solution. Electrical methods of analysis include
1. Potentiomety 2. Conductometry 3. Polarography 4. Voltammetry
Dept. of Pharm. Analysis, K.M.C.H College Of Pharmacy 3
3. Instrumental methods of analysis:
Instrumental methods involve the measurement of some physical properties of the compounds.
a) Spectrophotometric methods:
The spectroscopic method of analysis is depends upon the measurements of the amount of radient energy of particular wavelength emitted or absorbed by the sample.
b) Chromatographic techniques:
The chromatographic techniques are separation methods for the mixture of compounds and also applied for identification of compound of mixtures. Various chromatographic techniques are GC, HPLC, HPTLC, TLC, PC etc.
c) X-ray methods:
When high speed electrons collide with a solid target, X-rays are produced. From the remittent X-ray emission, it is possible to identify the certain emission peaks, which are characteristic of elements contained in target.
d) Radioactivity:
It involves measurement of the intensity of the radiation from naturally radioactive substances or induced radioactive substance arising from exposure of sample to a neutron source.
e) Optical methods:
i) Refractometer: based on measurement of refractive index of a liquids
ii) Optical rotation: for optically active compounds.
f) Thermal methods:
Changes in weight or changes in energy, record as a function of temperature like a Thermo gravimetry, Differential scanning calorimetry etc.
4. Biological and micro-biological methods:
Dept. of Pharm. Analysis, K.M.C.H College Of Pharmacy 4
Micro-biological method is used to observe potency of biotic or anti-microbiological agents. These methods include cup plate method and turbidimetric analysis.
HIGH PERFORMANCE LIQUID CHROMATOGRAPHY:
HPLC is one of the modern chromatographic techniques which are widely used in the fields of clinical research, bio-chemical research, industrial quality control etc. Application of these methods includes detection, analysis, determination, quantification and derivation of molecules from mixtures of biological, plant and medical samples. In column chromatography the solvent is just allowed drip through the column in high performance liquid chromatography, it is forced externally through the column at very high pressure up to 400 atmosphere. This will turn make the process lot faster. It also permits the very small particle size for the column packing material which offers a much greater surface area for interaction between the stationary phase and molecules flowing through it. High performance liquid chromatography be situated only of the best powerful tools now the analytical chemistry in means of the capacity to identify, separate then quantitate the compound that is existing in sample that is dissolved in every liquid.
HPLC method as the several advantages similar to rapidity, specificity, accuracy, precision, as well as ease automation now this method. HPLC method eliminates tedious extraction and isolation procedures.
Dept. of Pharm. Analysis, K.M.C.H College Of Pharmacy 5
1) Normal phase HPLC:
The column is filled with tiny silica particles, and the solvent is non-polar-for example hexane. A typical column has an internal diameter of around 4.6mm, and length in the range of 150-250mm. polar compounds in the mixture which is passed through the column will stick longer to the silica longer to the polar silica than to the non-polar compounds. Hence the non-polar compounds will elute faster.
2) Reverse phase HPLC:
The column size is the similar as in normal phase HPLC, but silica is modified and completed non-polar attaching by long hydrocarbon chains to its surface with their 8 or 18 carbon atom in them. A polar solvent is used in this type of HPLC- for example, a mixture of an alcohol such as methanol and water is used. There will be a strong magnetism between the polar molecules and polar solvent in the mixture which is passing through the column. The attraction between the hydrocarbon chains attached to the silica (the stationary phase) and the polar molecules in the solution won’t be as much. Therefore, polar molecules in the mixture will spend most of their time moving with the solvent. Because of van-der Waals forces the Non-polar compounds in the mixture will tend to form attractions with the hydrocarbon groups present in the stationary phase. RP-HPLC method is the most commonly used for analysis. [8-13]
Characteristics features of HPLC:
HPLC method is having many advantages than the conventional method of analysis, in which the following is included;
High resolving power and speed of separation.
Accurate and quantitative measurement.
Repetitive and reproducible analysis using the same column.
Determination of several components in a single analysis.
Easy collection of separated components for further characterization.
A variety of solvents, column, and detectors are available.
Dept. of Pharm. Analysis, K.M.C.H College Of Pharmacy 6
PRINCIPLE:
The principle of separation is based on the typical modes of separation of that of a classical chromatography
1) Adsorption 2) Partition 3) Ion exchange 4) Gel permeation
Adsorption chromatography
Adsorption is a surface phenomenon where the separations of components are achieved by adsorption to the stationary phase. It involves the accumulation of the liquid or gaseous solute on to the surface of the solid particle. The separation is based on affinity characters of the with stationary phase. Compounds having less affinity with stationary phase will eluted faster while those compounds more affinity with stationary phase will be eluted later.
Partition chromatography
In this method the stationary phase will be liquid coated with solid support. Here the separation is achieved based on the relative distribution solute between two liquid phases i.e; based on the partition co-efficient value. This type chromatography may be either normal phase or reverse phase depending on the nature of mobile phase and stationary phase.
Ion-exchange chromatography
This method involves reversible exchange of charged ions between the stationary ion exchange resin and liquid mobile phase. Separation is achieved due to the difference in strength of electrostatic interaction of solutes with the stationary phase. Gel permeation chromatography
The mechanical sorting of molecules take place based on the size of the molecules in solution. Small molecules are able to permeate through the pores and therefore longer than larger molecules and hence molecules are elute first. [14-16]
Dept. of Pharm. Analysis, K.M.C.H College Of Pharmacy 7
Table 1: Various Types of HPLC
TYPE SAMPLE
POLARIZA TION MOLECULAR MASS RANGE STATIONARY PHASE MOBILE PHASE
Adsorption non-polar to somewhat
polar
100– 104 silica or alumina non-polar to
polar Partition (reversed-phase) non-polar to slightly polar
100– 104 non-polar liquid
adsorbed or chemically bonded to
the packing material
relatively polar Partition (normal-phase) To some polar to greatly polar
100– 104 highly polar liquid
adsorbed or chemically bonded toward the packing
material relatively non-polar Ion Exchange extremely polar to ionic
100 – 104 ion-exchange resins
complete of insoluble, high-molecular mass solids
functionalized characteristically through sulfonic acid
or amine groups
aqueous buffers by added organic solvents to moderate solvent strength Size-Exclusion non-polar to ionic
103 – 106 small, porous, silica
or polymeric particles
Dept. of Pharm. Analysis, K.M.C.H College Of Pharmacy 8
Quantitation methods in HPLC:
The peak height and peak area measured by the detector signals. This measurement will give an account about the concentration or mass of the compound. For establishing this quantitation, some sort of calibration should be performed.
The major techniques for quantitation are:
1. Normalized peak area method 2. External standard method 3. Internal standard method
4. Method of standard addition method
Normalized peak area method
To determine the degradation product or impurity in a product, this method is used. The peak area of any one of the peak is referred to the normalized peak area. The response factor for each component is identified by this method.
External standard method
This method is done by injecting both standard and unknown sample. The unknown can be determined by calculating the response factor or calibration graph. The response factor Rf can be calculated from the following formula
Rf =
There is no need of extensive sample preparation. The chromatographic conditions should be maintained constant during the separation of all standards and samples for better quantitation using external standard method. External standard methods are mainly used to ensure that the total chromatographic system is properly and can provide reliable results.
Internal standard method
Dept. of Pharm. Analysis, K.M.C.H College Of Pharmacy 9
is to mimic the nature and behavior of sample. For compounds which need pre-treatment or preparation this internal standard method is used.
The response factor is used for the determination of sample component in the original sample. Response factor is defined as the ratio of peak area of sample component (Ax) and the internal standard (AISTD). The formula is follow as,
Rf=
Based on the response factor and strength of internal standard (NISTD ), the amount
of analyte in the original sample can be calculated from the formula,
X =
Method of standard addition
The method of standard addition can be used to provide calibration plot for the quantitative analysis. An important aspect of this method is that the response prior to spiking additional analytes should be high enough to provide to provide a reasonable S/N ratio (>10), otherwise the result will have poor precision. Mostly this method is used in the trace analysis. [17-18]
std x
AI A
STD ISTD F
x N
A R
A
Dept. of Pharm. Analysis, K.M.C.H College Of Pharmacy 10
Instrumentation of HPLC:
The features of modern HPLC is illustrated in the block diagram comprise of components.
Fig.1: schematic diagram of HPLC
1. Pumping system:
HPLC pumping technique is required toward deliver metered amounts of mobile phase on a constant flow rate. Pumping system that is delivers solvent from one or more reservoirs be there available. Modern computer- or micro processer- controlled pumping systems are capable of delivering a mobile phase of either constant (isocratic elution) or either (gradient elution) composition, according to a defined programme.
Features of pumping systems:
High pressures up to 6000 psi, constant & reproducible flow, pulse free output, flow rate (0.1-10ml), adaptable to gradient flow, corrosion to resistant components. Easy to dismantle & repair and low maintenance cost.
2. An injector:
Dept. of Pharm. Analysis, K.M.C.H College Of Pharmacy 11
system has a fixed loop or a variable column devise which can operated manually or by an auto sampler. Partially filling of tuber may lead to poorer injection volume precision.
3. Chromatographic column:
A tube which contains the stationary phase. The stationary phase differentially interrelates through the sample constituent compounds they are carried along with the mobile phase HPLC column is packed with very fine particles (usually few microns in diameter).
Types of column:
Analytical column:
It performs the separation. It is a straight column with dimensions 4.0-8.0 mm (id) X 15cm or 25 cm length and particle size of 5or 10 micron. It contains 40000-60000 plates/m.
Preparative column:
It is 25-50mm (id) X 25cm (length) and used for preparative works. Its important parameters are sample load and transfer of analytical data to preparative data. 4. Detector:
The detector controls the sensitivity with which each compound can be detected and measured, once separated on the column. It must be capable of responding to concentration in all of the compounds of interest.
There are six main detectors used for HPLC. Refractive index (RI), ultraviolet (UV), fluorescence (FD), conductivity (CD), electrochemical (EC), and mass spectrometric (MS).
Ultraviolet visible (UV/Vis) absorption spectrometer is the most commonly used detectors for pharmaceutical analysis. [19-20]
Data system:
For better accuracy and precision.
Routine analysis: pre-programmed computing integrator.
Data station/ computer needed for higher control levels.
Dept. of Pharm. Analysis, K.M.C.H College Of Pharmacy 12
System suitability parameters:
System suitability parameters toward ensue recognized intended for a specific process depend on the type of process which being validated. The simplest form of a system suitability test involves a comparison of the chromatogram trace with a standard trace. This allows the comparison of the peak shape, peak width, and base line resolution. These are few parameters that can be calculated to provide a quantitative system suitability test report.
Number of theoretical plates (efficiency)
HETP
Capacity factor
Peak asymmetry factor
Resolution
Tailing factor
i) Resolution (Rs):
The resolution Rs, two neighboring peaks is defined as the ratio of the distance between the two peaks maxims. This one of the located the variance among the retention times of double solutes divided in their average peak width. Intended for baseline separation, the ideal value of Rs is 1.5. It is calculated by using the formula,
Rs =
2 1 1 2 5 .
0 W W Rt Rt
Where, Rt1 and Rt2 are the retention time of component 1 and 2 and
W₁ and W₁ are peak widths of component 1 and 2. ii) Capacity factor (K):
Capacity factor, K, is defined as the ratio of the number of molecules of solute in the stationary phase to the number of molecules of the same in the mobile phase. Capacity factors are measure of exactly how well the sample molecule is retained in a column or TLC plate during an isocratic separation. The ideal value of K ranges from 2-10 capacity factors can be determined by using the formula,
Dept. of Pharm. Analysis, K.M.C.H College Of Pharmacy 13
Where, V1 = retention volume on the top of the peak (solute)
V₁= void volume of the system
The values of K of individual band increase or decrease with changes in solvent strength. In reversed phase HPLC, solvent strength increases with the increase in the volume of organic phase in the water / organic mobile phase. Typically an increase in percentage of the organic phase by 10% by volume will decrease K bands by a factor of 2-3.
iii) Column efficiency (N):
Efficiency, N, of a column is measured by the number of theoretical plates per meter. It is a measure of band spreading of single peak. Smaller the band width, higher is the number of theoretical plates, indicating good column and system performance. Columns through N ranging from 2000 – 100,000 plates/meter are suitable intended for good system. Efficiency is calculated by means of using the formula,
N = 2
2 16
W Rt
Where, Rt is the retention time and W is the peak width.
iv) Peak asymmetry factor (As):
Peak asymmetry factor, As, can be used as a criterion for checking column performance. The peak half width, b, of a peak at 10% of the peak height, divided by the corresponding front half width, a, gives a asymmetry factor.
As =
a b
For a well packed column, an asymmetry factor of 0.9 to 1.1 should be achievable.
[21-25]
Dept. of Pharm. Analysis, K.M.C.H College Of Pharmacy 14
Table 2: System suitability parameters and recommendations
Parameter Formula Recommendation
Theoretical Plates (N)
N=5.54*(tR/W0.5)2 In general should be > 2000
HETP(H) H= L/N HETP↓ Column efficiency↑
Peak asymmetry (As) As= b/a In general it should be 1
Tailing Factor (T) T= (b+a)/2a In general it should be 1
Resolution (R)
2 1 1 2 2 W W t t Rs Rs of > 2 between the peaks of
interest.
HIGH PERFORMANCE THIN LAYER CHROMATOGRAPHY:
Thin layer chromatography (TLC) is also well-known as planar chromatography or flat chromatography similar all other chromatographic techniques, a multi stage distribution process. The most advanced form of TLC is commonly called high performance thin layer chromatography (HPTLC).
Dept. of Pharm. Analysis, K.M.C.H College Of Pharmacy 15
HPTLC is the highest flexible, reliable then cost-efficient separation technique preferably suited for the analysis of botanical and herbal drugs etc. used through standardized then validated processes, it guarantees reproducible results. HPTLC is a vital element routine identification of complex finger prints of plant extracts and pharmaceutical products. It has established itself as the method of choice for handling complex analytical task involving identification of herbal drugs and botanicals.
High throughput analysis using HPTLC helps in the rapid analysis of large number of compounds. This field has been expedited by the requirements to provide analytical support of multiple drug targets emerging from the field of molecular biology, human genetics and functional genomics.
The power of thin layer chromatography has been improved by considering the chromatographic principles to enhance the speed and efficiency of separation by development of instruments to automate sample application, development of chromatogram and detection including accurate and precise quantification and identification. As the particle size of layer is decreases, the separation will be faster, more resolved and efficient. The particle size of the stationary phase has a narrower distribution range with an average size of 5µm, instead of average of 20µm for conventional TLC. The use of mechanical applicators like linomat 5, produce reproducible application reduces the diameter of the starting spots, compared to conventional TLC, only few volumes of sample are used in HPTLC, i.e; about one-tenth of the sample. The separation time is also reduced considerably.
Modern thin layer chromatography can be complementary to the HPLC technique. It allows the analysis of many samples in parallel, providing low cost analysis of simple mixtures for which the sample workload in high. The TLC plates acts as a “storage detectors” of the analytes if they are saved properly. [26-28]
Factors influencing the TLC / HPTLC separation and resolution of
spots:
Type of stationary phase
Layer of thickness / binder in the layer
Dept. of Pharm. Analysis, K.M.C.H College Of Pharmacy 16 Size and saturation of the developing chamber
Sample volume to be spotted
Solvent level in the chamber
Relative humidity
Temperature (Rf values with increase with rise in temperature)
Separation distance
Features of HPTLC:
1. Simultaneous processing of sample and standard, it shows better analytical precision and accuracy, less need for internal standard,
2. Several analysts work simultaneously,
3. Lower analysis time and less cost per analysis, 4. Low maintenance cost,
5. Simple
6. Low mobile phase consumption per sample, [29-31]
HPTLC METHODOLOGY:
Set the analytical objective main that can exist quantification or qualitative identification or separation of twofold components/multicomponent combinations or optimization of analysis while before starting HPTLC. Process demands primary knowledge about the nature of the sample, namely, structure, polarity, volatility, stability and the solubility parameter of the sample.
Method improvement includes considerable test and error procedures. Selection of stationary phase exists quite easy. That remains to start with silica gel which is reasonable and nearly suits all kind of drugs.
Mobile phase optimization is done by using three level techniques.
i) First level involves use of neat solvents by considering the solubility of drugs and then by finding some such solvents can have average separation power for the desired drugs.
Dept. of Pharm. Analysis, K.M.C.H College Of Pharmacy 17
iii) Third level involves annoying of mixtures instead of neat particular solvents since the selected solvents first and second level which can further be optimized through the use of modifiers like acids or bases are desired volumes.
Analytes are detected using either fluorescence or absorbance mode. Optimization can be started only afterward a reasonable chromatogram which can be finished by slight change in mobile phase composition.
Dept. of Pharm. Analysis, K.M.C.H College Of Pharmacy 18
1. Sample preparation:
Normal phase chromatography: non polar solvents Reverse phase chromatography: polar solve
2. Selection of chromatographic layer:
Precoated plates of different support material (different solvents) are available for 80% of analysis. Generally plates of 20 × 20cm or 10 × 10cm size having 100-250mm adsorbent thickness are used.
Alkaloids and steroids – aluminium oxide, silica gel 60 GF₁₁₁
Amino acids, dipeptides, sugars and alkaloids – cellulose
Non-polar substances, fatty acids, carotenoids and cholesterol – RP-2 and RP-8
Preservatives, barbiturates, analgesics, phenothiazine – hybrid plates (RP-WF₁₁₁)
3. Layer pre washing:
It is a purification step to remove water vapours present in the plate. This step also removes the volatile impurities which might get trapped in the plates. Mainly methanol is as a solvent for washing by ascending or descending technique. This step is very essential for quantitative evaluation and stability testing of drugs.
4. Conditioning of pre coated plates:
Freshly open box of plates do not require activation. Plates exposed to high humidity or kept on hand for long time is to be activated. Activation is done by using the plate in oven at 110 to 120ºc for 30minutes prior to spotting. Dried plates are stored at dust free atmosphere.
5. Sample application:
Dept. of Pharm. Analysis, K.M.C.H College Of Pharmacy 19
The criteria like precision of applied volume, small size of application zone and exact positioning of sample are essential for the quality or repeatability of the analysis. Usually the concentration range between 0.1-1µg/µl. Above this causes poor separation. Band wise sample request open through linomat 5 applicator or automatic TLC sampler 4 which operates the best separation regarding sample and application volumes. Nitrogen gas, spray the sample and standard from syringe on TLC plates as bands. Band wise application provides better separation which gives high response to densitometer giving good results. By using spray-on technique the applied volume can be easily adjusted to match the required detection limit of the analytical task.
6. Selection of mobile phase:
Trial and error or one’s own experience and literature helps in the selection of mobile phase 3-4 component mobile phase should be avoided. Multi component mobile phase while used not mentioned for extra use and solvent composition exists expressed by volume (v/v) and sum of volumes is usually 100 twin through chambers are used which requires only 10-15ml of mobile phase. Components of mobile phase must be mixed and introduced now to the twin through chamber.
7. Pre- conditioning (chamber saturation):
Un-saturated chamber causes high RF values and improper solvent front. Saturated chamber through inside layer by filter paper for 30 minutes later to development uniform distribution of solvent vapours-less solvent meant for the sample to travel lower RF values.
8. Chromatogram development:
Chromatogram is developed by capillary force. The developing solvent (mobile phase) migrates through the layer (stationary phase) over a defined distance called solvent front. During this process the sample is separated into fractions/bands (components). After evaporation of the mobile phase by keeping the layer/plate in hot air oven or at room temperature, all fractions remain stored on the layer.
9. Derivatization:
Dept. of Pharm. Analysis, K.M.C.H College Of Pharmacy 20
Eg: Ninhydrin, Dragandroff’s reagent 10. Chromatogram evaluation:
The chromatogram is evaluated under UV light or white light detection under UV is first choice nondestructive. The various methods involve visual inspection, electronic image processing, video densitometry and documentation to quantitative determination by means of monochromatic light in a classical densitometer. This additionally facilitates measurement of spectral information. Two types of ultra violet light are required by inspecting thin layer chromatogram.
Long wave UV light 366nm:
Some substances may naturally inherent or reagent may induce fluorescence which appears at bright spots, often differently coloured, on a back ground. The sensitivity of this detection method is proportional with the intensity of the long-wave UV light and also as more visible light is eliminated. A fluorescent compound F254 contained in the layer does not interfere with this detection method.
Short wave UV light 254nm:
Substance absorbing at this wavelength become visible provided that TLC layer contains a fluorescent indicator F254. This substance appear as dark spots on a back ground UV intensity and complete elimination visible light are less critical for this detection method.
Spots of non-fluorescent compound ethambutol, dicylomine etc are dipping the plates in 0.1% iodine solution.
11. Scanning and documentation:
Dept. of Pharm. Analysis, K.M.C.H College Of Pharmacy 21
Parameters that are affected by the changes in chromatographic
conditions are:
Retention factor (Rf )
Peak purity
1. Retention factor (Rf ):
Retention factor is defined such as the quantity of separation due to the solvent migration through the sorbent layer as shown in the formula. It depends on time of development and velocity coefficient or solvent front velocity.
Migration distance of substance from origin
Rf = ---
Migration distance of solvent front from origin
2. Peak purity:
The null hypothesis “these spectra are identical” can in this case (purity) with two sided significance. Through the purity test the spectrum in use at the first peak slope is correlated by the spectrum of peak maximum [r (s, m)] then the correlation of spectra taken at the peak maximum by the one from the down slope or peak end [r (m, e)] which is used by way of a reference spectra for statistical calculation. An error probability of 1% only is rejected if the test value is greater than or equal to 2.57. [38]
Quantitative analysis:
Dept. of Pharm. Analysis, K.M.C.H College Of Pharmacy 22
avoidance of the use of toxic reagents and solvents. In an attempt to promote harmonization, primary consideration is given to those methods which are already accepted in official pharmacopeias. When necessary, comparative tests shall be conducted to determine which of the available method is most appropriate. [39]
VALIDATION OF ANALYTICAL PROCEDURE: Significance of method validation:
The quality of analytical data is a key factor in the success of a drug development programmer. The process of method development then validation takes a complete impact on the quality of these data.
To trust the method
Regulatory requirement
Different types of validation characteristics:
Precision
Repeatability
Inter and intraday precision
Accuracy
Specificity/selectivity
Linearity range
Limit of detection (LOD)
Limit of quantification (LOQ)
Robustness
Ruggedness
System suitability
Generalized validation process for HPLC assay methods
Validation is the process of collecting documented evidence that the method performs according to its intended purpose. The validation process as follows:
1. Precision:
Dept. of Pharm. Analysis, K.M.C.H College Of Pharmacy 23
of a test method is usually expressed as the deviation or relative deviation of a series of measurements.
Precision may be considered at three levels:
Repeatability
Interday and
Intraday Precision.
Acceptance Criteria:
Percentage Relative deviation (%RSD) NMT 1 % (Instrument precision)
(%RSD) NMT -2% (Intra- assay precision)
2. Accuracy:
The ICH guideline mentions that accuracy requirement be determined by a smallest of nine determinations over a minimum of three concentration levels covering the identified range. The spiked samples are prepared now triplicate at three levels over a range that covers 80 -120% of the target concentration for assay methods .There are several methods that can be used for determining accuracy.
In this case, method accuracy is the agreement between the differences in the measured analyte concentration and the known amount of analyte added. That is the accuracy or % recovered is calculated as:
Accuracy = Cm × 100
Ct
Where; Cm is the measured concentration
Ct is the theoretical concentration.
Accuracy has also been reported as; when a sample is analyzed the measured value should ideally be identical to the true value. Accuracy is represented and determined by the recovery experiments. The usual range is being 10% above or below the expected range of claim. The % recovery was calculated using the formula,
100 ) ( cov Re %
bX a b a
ery
Where,
Dept. of Pharm. Analysis, K.M.C.H College Of Pharmacy 24
Acceptance Criteria:
For an assay method, mean recovery will be 100%± 2% at each concentration over the range of 80-120% of the target concentration.
3. Limit of Detection:
The condition is previous amount of analyte now a sample analyzed that contain exist detected but not necessarily be quantitated below the stated experimental conditions.
Following are different approaches:
i. Based on Signal to Noise Ratio Method:
The LOD can be expressed as a concentration at specified signal-to-noise ratio obtained from samples spiked with analyte. A signal-to-noise ratio is 3:1 is generally considered to be acceptable.
ii. Based on the Deviation of the Response of the Slope:
Prepare the blank solution as per test method inject six times into the chromatographic system.
Similarly prepare the linearity solution starting from lowest possible concentration of analyte to 150% of target concentration and establish the linearity curve.
The detection limit (DL) may be expressed as: LOD = 3.3 σ / S
The slope shall be estimated from the calibration curve of the analyte.
4. Limit of quantification:
Dept. of Pharm. Analysis, K.M.C.H College Of Pharmacy 25
LOQ = 10 σ / S
Acceptance Criteria:
In Pharmaceutical application, the LOQ is typically set at minimum 0.05% for active pharmaceutical ingredients.
5. Linearity range:
The linearity of an analytical method is its ability to evoke test results that are consider to the analyte concentration in samples within a given range. The working sample concentration tested for accuracy should be in the linear range. The demand that the method is linear is to be justified with additional mention of zero intercept by processing data by linear least square regression (R2).
y = mx +C
For the method to be linear the R2 value should be near to1. Where y is the measured
output signal, x is the concentration of sample, m is the slope, C is the intercept.
The range of an analytical method is the interval between the upper and lower levels of the analyte (including these levels) that have been demonstrated to be determined with precision, accuracy linearity using the method as written.
Acceptance criteria:
Coefficient of correlation should be NLT 0.99.
6. Robustness:
That one is a measure of the method’s capability to remains unaffected done slight then deliberate deviations now the parameters, which provides an indication of his reliability throughout normal usage.
For example in a chromatographic method, the typical method parameters need to change deliberately verify during method validation:
Flow rate : (+/- 0.2ml/minutes).
Dept. of Pharm. Analysis, K.M.C.H College Of Pharmacy 26
PH of buffer in mobile phase : (+/- 0.2 units).
For Variations:
1. System suitability should meet the acceptance criteria as per test method.
2. If system suitability doesn’t meet, narrow the variation range carryout the experiment again to meet system suitability.
7. Ruggedness:
Ruggedness is near a measure of reproducibility of the test effects under normal operational conditions though laboratory to laboratory and after analyst to analyst. The following are the typical method parameters needed to be tested during the method validation:
Analyst-to-Analyst variability.
Column-to-Column variability
Different days [40-57]
Dept. of Pharm. Analysis, K.M.C.H College Of Pharmacy 27
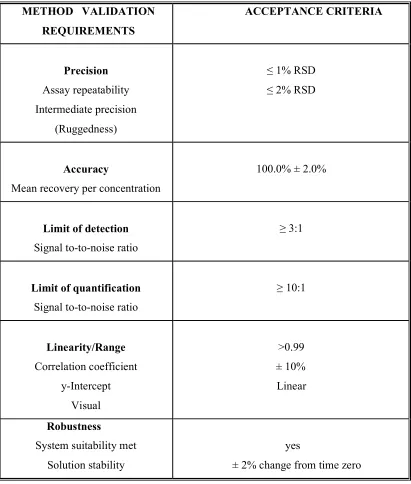
Table 3: Method Validation Requirements (ICH)
METHOD VALIDATION REQUIREMENTS
ACCEPTANCE CRITERIA
Precision Assay repeatability Intermediate precision
(Ruggedness)
≤ 1% RSD ≤ 2% RSD
Accuracy
Mean recovery per concentration
100.0% ± 2.0%
Limit of detection Signal to-to-noise ratio
≥ 3:1
Limit of quantification Signal to-to-noise ratio
≥ 10:1
Linearity/Range Correlation coefficient
y-Intercept Visual
>0.99 ± 10% Linear
Robustness
System suitability met Solution stability
yes
Dept. of Pharm. Analysis, K.M.C.H College Of Pharmacy 28
2. REVIEW OF LITERATURE
Ganesh Kumar[58] et al. Developed and validated simple and new stability indicating
RP-HPLC method for the identification of teneligliptin and its degradants on kromasil 100-5C18 (250×4.6mm, 5µm) column using pH 6.0 phosphate buffer and acetonitrile (60:40 v/v) as mobile phase in isocratic mode of elution of flow rate of 1.0ml/min. The column effluents were monitored by a variable wavelength UV detector at 246nm. The method was validated as per ICH guidelines. Forced degradation studies of teneligliptin were carried out under acidic, basic, neutral (peroxide), photo and thermal conditions for 48hrs at room temperature respectively.
Kadam V.N. [59] et al. Proposed simple accurate, precise and reproducible RP-HPLC
method was developed for the determination of Voglibose (VGB), Glimepiride (GLM) and Metformin HCL (MET). RP-HPLC method was developed on jasco 2075 HPLC systems with fine pack ODS C18 column (250mm) and using a mobile phase mixture containing mixed acetonitrile: phosphate buffer in the ratio of 85:15 (pH 4). The flow rate was 1ml/min and effluent was monitored at 223nm. The retention time of voglibose, glimepiride and metformin HCL were 2.3, 3.8 and 5.1 min respectively. The method was validated in terms of linearity, precision, accuracy, specificity and system suitability parameters. The proposed method results were found to be satisfactory and are suitable for simultaneous estimation of voglibose, metformin and glimepiride for routine quality control drugs.
Sunil R. Dhaneswar [60] et al. validated simple, precise and accurate HPTLC method for
Dept. of Pharm. Analysis, K.M.C.H College Of Pharmacy 29
Gopal S. Irache [61] et al. developed and validate a simple, rapid and reproducible
gradient high performance reverse phase liquid chromatographic method for the estimation of teneligliptin and metformin in bulk drug sample and pharmaceutical dosage forms using cromosil (C18, 250×4.6mm, 5µm) column with mobile phase composition of methanol and water (pH 3.5) 50:50 v/v. Flow rate of 0.7ml/min and UV detection at 242nm was maintain during the entire study. The retention time of metformin and teneligliptin was found to be 2.45 min and 6.21 min respectively. Linearity was observed over concentration range of 2-10µg/ml and 50-250µg/nl for teneligliptin and metformin respectively. The accuracy of the proposed method was determined by recovery studies and found to be 98-101%. The proposed method was validated and results conformed to ICH parameters.
Abdul Bari Mohd [62] et al. A simple, rapid sensitive method was carried out on a 5µm
particle octadesyl silane (ODS) column (250×4.0 mm) with acetonitrile 0.2M phosphate buffer (pH 7.4) 40;60 v/v as a mobile phase at a flow rate 1ml/min and quantification was achieved at 228nm using PDA detector. The correlation coefficient (r²) was found to be 0.999 over the concentration range of 0.2 to 2 µg/ml for glimepiride. The method was validated for linearity, accuracy and precision. The limit of detection and limit of quantification were found to be 0.38 and 1.17 µg/ml respectively.
Vishnu C. Shinde [63] et al. developed and validate simple, rapid sensitive and specific
Dept. of Pharm. Analysis, K.M.C.H College Of Pharmacy 30 with respect to peak area in the concentration range of 100-600 ng/spot. The developed methods were validated as per ICH guidelines.
Deepak Patil [64] et al. accurate, precise and reproducible high performance liquid
chromatographic method was developed for quantitative estimation of metformin and teneligliptin simultaneously in tablet dosage forms. Younglin (S.K.) gradient system UV detector and C₂ (Agilent) column with 250mm×4.6mm i.d. and 5µm particle size. Methanol: water 0.05% OPA (50:50) was used as the mobile phase for the method. The detection wavelength was 235nm and flow rate was 0.7ml/min. In the developed method, the retention time of metformin and teneligliptin was found to be 2.1 min and 7.6min. The developed method was validated according to ICH guidelines. The linearity, precision, range, robustness was within the limits as specified by the ICH guidelines. The proposed method can be used for the routine quality control analysis of metformin and teneligliptin respectively.
Pradnya N. [65] et al. a simple reverse phase high performance liquid chromatography
method was developed and validated for simultaneous determination of metformin hydrochloride (MET) and glimepiride (GLM) in combination and estimation of their principal degradation products. The separation was achieved using JASCO finepak SIL (250mm×4.6mm i.d. 5µm) at ambient temperature. The optimized mobile phase composed of an aqueous phase (20 mM phosphate buffer, adjusted to pH 3.0) and an organic phase (methanol: acetonitrile, 62.5: 37.5) in the ratio of 80:20. The flow rate was 1ml/min, and the analytes were detected at 230nm. The developed method was validated for accuracy, precision, specificity, linearity and sensitivity. The chromatographic analysis time was accurately six minutes with the complete resolution of MET (Rt₂2.75minutes) and GLI (Rt₂5.87minutes). The method exhibited good linearity over the range of 5-30 µg/ml for MET and 1-10 µg/ml for GLI. The drugs in combination were subjected to various stress degradation studies as per the ICH guidelines.
Mastanamma Shaik. [66] et al. developed and validate simple, sensitive, linear, precise
Dept. of Pharm. Analysis, K.M.C.H College Of Pharmacy 31 the use of luna C18 (250×4.6mm, i.e. 5µm) column in a gradient mode. Mobile phase consisted of methanol (solvent A) and 0.1% orthophosphoric acid (OPA, solvent B) was set with gradient programming for 18min and was delivered at 1ml/min flow rate and effluents are achieved with variable wavelength photodiode array detector at 284nm. The retention time of MET, LOS and GLI were found to be 3.11, 7.12 and 13.52mins respectively. The percentage assay of MET, LOS and GLI was found to be 100.5%, 100.5% and 100.4% respectively. Calibration curve were linear for MET, LOS and GLI at concentration ranges of 30-450 ng/ml and 15-225 ng/ml and 1-18 ng/ml with the regression co-efficient of 0.999 for all three drugs and precise with (%RSD>2). The drug was subjected to various stress condition of acid and base hydrolysis, oxidation, photolysis, thermal degradation and condition.
Vedantika Das [67] et al. developed and validate simple, accurate, precise and
economical HPLC method has been developed and validated for the estimation of teneligliptin hydrobromide hydrate (THH) in bulk and tablet dosage form. Separation was achieved on a prontosil C8 column using a mobile phase consisting of acetonitrile: dihydrogen potassium phosphate buffer in 60: 40 (v/v) adjusted with o-phosphoric acid pH 3.0. Gradient elution at a flow rate of 1ml/min and UV detection at 246nm. Linearity was observed in the concentration range of 30-150 µg/ml. The retention time of teneligliptin was 2.47min. The proposed methods were validated according to the ICH guidelines.
M. Vijaya Kumari [68] et al. developed and validate simple, rapid, precise and accurate
Dept. of Pharm. Analysis, K.M.C.H College Of Pharmacy 32 linearity and range were studied for all developed methods and were found to be within limits.
Karthik A. [69] et al. developed and validate simple, fast and precise reverse phase,
isocratic HPLC method was developed for the separation and quantification of pioglitazone and glimepiride in bulk drug and pharmaceutical dosage form. The quantification was carried out using inertsil ODS (250×4.6mm, 5µm) column and mobile phase comprised of acetonitrile and ammonium acetate (pH 4.5; 20mM) in proportion of 60:40 (v/v). The flow rate was 1.0 ml/min and the effluent was monitored at 230nm. The retention of pioglitazone and glimepiride were 7.0±0.1 and 10.2±0.1 min respectively. The method was validated in terms of linearity, precision, accuracy and specificity, limit of detection and limit of quantification. Linearity of pioglitazone and glimepiride were in the range of 2.0 to 200.0µ/ml and 0.5-50µg/ml respectively. The percentage recovery of both the drugs was 99.85% and 102.06% for pioglitazone and glimepiride respectively.
Sharma [70] et al. developed and validate simple reverse phase liquid chromatographic
method has been developed and subsequently validated for simultaneous determination of pioglitazone and glimepiride in combination. The separation was carried out using a mobile phase of phosphate buffer (pH 4.5): acetonitrile (45:55 v/v) and using methanol as diluent. The column used was inertsil ODS (250×4.6mm i.d., 5µm) with flow rate of 1.0ml/min using UV detection at 225nm. The described method was linear over a concentration range of 5-50µg/ml and 5-25µg/ml for the assay of pioglitazone and glimepiride respectively. The retention times of pioglitazone and glimepiride were found to be 4.6 and 7.7min respectively. Results of analysis were validated statistically and by recovery studies. The results of the study showed that the proposed RP-HPLC method is simple, rapid, precise and accurate, which is useful for routine determination of pioglitazone and glimepiride bulk drug in pharmaceutical dosage form.
E. A. Rathod [71] et al. the present work proposed precise, accurate and validated HPLC
Dept. of Pharm. Analysis, K.M.C.H College Of Pharmacy 33 value less than 1. The chromatographic separation was achieved by isocratic mode with a mixture of methanol: phosphate buffer (pH 7.2) in the ratio of 70:30v/v as the mobile phase using shodex C18 column as stationary phase at flow rate of 1ml/min and detection wavelength of 244nm. The retention time was found to be 5.753min. The percent amount of drug estimated by all developed methods was nearly 100%, found to be in good agreement with label claim of marketed tablet formulation. The recovery study was carried out at five different levels and results were found to be satisfactory. The validation parameters like accuracy, precision, ruggedness, linearity and range were studied for all the developed methods were found to be within the limits.
K.P.R.Chowdary[72] et al. the stability indicating RP-HPLC method has been developed
and validated for simultaneous estimation of metformin hydrochloride and teneligliptin in bulk and dosage forms. The involves separation on YMC C18 column (150mm×4.6mm×5µm particle size). The optimized mobile phase consists of phosphate buffer (pH 3) and acetonitrile (80:20 v/v) with a flow rate of 0.8ml/min and UV detection at 220nm. Retention time was 2.138min (metformin hydrochloride), 2.943 (teneligliptin), 5.075 pioglitazone. Linearity range was 9.98-600µg/ml (metformin hydrochloride), 0.51-24µg/ml (teneligliptin). Accuracy was in the range of 99.41-100.74% for both drugs. Precision was 0.8% and 0.9% for metformin hydrochloride and teneligliptin. LOD and LOQ are 0.72µg/ml and 2.40µg/ml for metformin hydrochloride, 0.15µg/ml and 0.51µg/ml for teneligliptin. The method developed is sensitive, accurate and precise. Retention time and run time were also less and hence the method is economical when applied to tablet assay, drug content was within 99.89-100.74% of labeled content. Forced degradation studies indicated the suitability of the method for stability studies.
Sohan S. Chitlange [73] et al. the simple, accurate precise and economical HPTLC and
Dept. of Pharm. Analysis, K.M.C.H College Of Pharmacy 34 evaluation of the chromatograms in reflectance/absorbance mode. The system was found to give good result for teneligliptin at Rf 0.51. The calibration plot was found to linear between concentrations range 0.5-3µg/ml band and r²=0.9993. Method was validated as sper ICH guidelines. In stability testing, teneligliptin was found susceptible to alkali hydrolysis and oxidative degradation. Because the method could effectively separate the drug from its degradation products, it can be used stability indicating method. A UV spectrophotometric method was also developed using methanol as solvent at wavelength at 247nm. Beer’s law was obeyed in the concentration range of 5-50µg/ml and r²=0.9997. The proposed method was validated according to the ICH guidelines.
Shraddha Pawar[74]et al. a gradient method is developed for the quantitative
determination of impurities of glimepiride and metformin hydrochloride in the combined pharmaceutical dosage form. The method is based on high performance liquid chromatography (HPLC) on a reverse phase column of waters symmetry C8, 5µm 4.6×250mm thermo stated at 50˚c, using a mobile phase of pentane sulfonic acid sodium salt buffer pH 3.5 and acetonitrile and evaluated for its ability to simultaneously establish the level of known impurities in glimepiride and metformin hydrochloride tablets. The method shows good resolution between glimepiride sulfonamide (GS), glimepiride urethane (GU), glimepiride 3-isomer (GI), metformin related compound A (MA), glimepiride (G), metformin hydrochloride (M), unknown impurities and formulation excipients of tablets. A gradient program with UV detection at 230nm is used to quantitate all components. The developed method is validated in term of specificity, linearity and range GS, GU, GI, MA, M and G. Accuracy using spiked level of impurities (80% to 120% of the specified limit), precision and ruggedness. Limit of quantitation is found to be 1.50µg/ml for M, 0.10µg/ml for G, 0.30µg/ml for MA, 0.24µg/ml for GS, 0.10µg/ml for GU and 0.22µg/ml for GI.
M Suchitra[75]et al. A rabid RP-HPLC method was developed and validated for
Dept. of Pharm. Analysis, K.M.C.H College Of Pharmacy 35 stability. The proposed method can be used for the routine estimation of these drugs in combined pharmaceutical dosage form.
Shailesh V. Luhar [76] et al. a simple, rapid, precise and accurate reversed phase stability
indicating RP-HPLC method was developed and validated for the simultaneous determination of teneligliptin hydrobromide hydrate from its associated main impurities and their degradation products. Separation was achieved on a shisedo C18 column, 5µm, 250mm×4.6mm i.e. column using a mobile phase consisting of acetonitrile: methanol: water (30:40:30 v/v/v) at flow rate of 1.0ml/min and UV detection at 246nm. The drugs are subjected to acid hydrolysis, alkaline hydrolysis, oxidative degradation and thermal degradation to apply force degradation testing. The linearity of the proposed method was investigated in the range of 50-300µg/ml (r²=0.9996). The limit of detection was 2.78µg/ml and the limit of quantification was 8.45µg/ml respectively.
Prafulla M Patil [77] et al. a high performance thin layer chromatography method for
determination of teneligliptin was developed and validated as per ICH guide lines. HPTLC separation was performed on aluminium plates precoated with silica gel 60F₂₂₂ and methanol: toluene: triethylamine (1:3:1% v/v) volume as optimized mobile phase at detection wavelength at 245nm. The retardation factor (Rf) value for teneligliptin were 0.63 respectively. Accuracy for the marketed formulation teneza was found to be 98.31-100.51%. The percent relative standard deviation for repeatability and intermediate precision studies was found to be <2%. The propose development HPTLC method can be applied for identification and quantitative determination of teneligliptin respectively.
Amina A Abdelal[78]et al. the simple reversed phase high performance liquid
Dept. of Pharm. Analysis, K.M.C.H College Of Pharmacy 36 resolution of ROS (Rt =3.7min), GLM (Rt =4.66min) and nicardipine (Rt =6.37min). Validation studies were performed according to ICH guidelines.
K. Neelima [79] et al. the simple, sensitive, linear, precise and accurate method by
gradient reversed phase high performance liquid chromatography for the simultaneous estimation on metformin (MET), voglibose (VOG) and glimepiride(GLM) in bulk and in their combined tablet dosage form. The separation of the three drugs was based on the use of inertsil ODS 3V (150×4.6mm, i.e. 5µm) column in a gradient mode. Mobile phase consisted of 0.02M phosphate buffer adjusted to pH 2.5 using dilute orthophosphoric acid (solvent A) and acetonitrile (solvent B) was set with gradient programming for 18min and was delivered at 1ml/min flow rate and effluents are achieved with variable wavelength, photodiode array detector at 230nm. The retention time of MET, VOG and GLI were found to be 2.423, 8.191 and 11.708 respectively. The percentage assay of MET, VOG and GLI at concentration ranges of 200-600µg/ml, 0.08-0.24µg/ml and 0.8-2.4µg/ml with the regression coefficient of 0.999 for all the three drugs precise with (%relative standard deviation <2). The limit of detection MET, VOG and GLI was found to be 0.05µg/ml, 0.004µg/ml, 0.002µg/ml and limit of quantification for MET, VOG and GLI was found to be 1.5µg/ml, 0.012µg/ml and 0.006µg/ml respectively.
Dept. of Pharm. Analysis, K.M.C.H College Of Pharmacy 37
3. DRUG PROFILE
TENELIGLIPTIN HYDROBROMIDE HYDRATE: [80-83]
1. Chemical profile
Chemical name/ IUPAC name : {(2s,4s)-4-(4-(3-methyl-1-phenyl-1H-pyrazol-5-
yl)-1-piperazinyl)-2-pyrrolidinyl)-3-
thiazolidinyl hydrobromide,(2:5),hydrate.
Molecular formula :( C₂₂H₂₂N₂OS) 2.5HBr.xH₂O
Molecular mass : 1275.74 g/mol
Molecular structure :
Fig. 3: Structure of teneligliptin hydrobromide hydrate
2. Pharmacokinetic data
Bioavailability : 63-85%
Protein Binding : 78-80%
Metabolism : CYP3A4, a cytochrome P450 isoenzyme andflavin
Containing monooxygenases (FMO1 and FMO3)
Dept. of Pharm. Analysis, K.M.C.H College Of Pharmacy 38 Biological half life : 8.43-24.2 hrs
Excretion : kidney (34.4%) renal (65.6%)
Route of administration : Oral
Solubility : DMSO, methanol, water
3. Mechanism of action
Teneligliptin inhibits human dipeptidyl peptidase-4 (DPP-4) enzyme activitywith the IC₂₂=1 nM, more than 150 fold selectivity against DPP-8 and DPP-9 which Suggested little of target skin lesion side effect.
4. Dosing
Adultdose: the usual adult dosage is 20mg of teneligliptin orally administered once a daily.
5. Side effects
Hypoglycemia
Constipation
Feeling of abdomen enlarged
Abdominal discomport
Nausea
Abdominal pain
Meteorism
Eczema
Rash
Pruritus
Dermatitis
Dept. of Pharm. Analysis, K.M.C.H College Of Pharmacy 39 GLIMEPIRIDE [84-87]
1. Chemical profile
Chemical name/ IUPAC name : 3-ethyl-4-methyl-2-oxo-N-(2-{4-[({[(1r,4r)-4-
methylcyclohexyl]-c-hydroxycarbonimidoyl}
amino)sulfonyl]phenyl}ethyl)-2,5-dihydro-1H-
pyrrole- 1-carboximidic acid
Molecular formula : C₂₂H₂₂N₂O₂S
Molecular mass : 490.617 g/mol
Molecular structure :
Fig. 4: Structure of glimepiride
2. Pharmacokinetic data
Bioavailability : 100%
Protein binding : 99.5%
Metabolism : complete hepatic (1st stage through CYP2C9)
Biological half-life : 5-8 hrs
Excretion : urine (60%) feces (40%)
Routes of administration : oral
Dept. of Pharm. Analysis, K.M.C.H College Of Pharmacy 40 3. Mechanism of action
Glimepiride acts as an insulin secretagogue. It lowers blood sugar by stimulating the release of insulin by pancreatic beta cells and by inducing increased activity of intracellular insulin receptors.
Not all secondary sulfonylureas have the same risks of hypoglycemia. Glibenclamide (glyburide) Is associated with an incidence of hypoglycemia of up to 20-30%to as low as 2% to 4% with glimepiride.
4. Dosing
Adult dosage: The recommended starting dose 1mg or 2mg taken once per day with breakfast or the first main meal of the day