promoting access to White Rose research papers
White Rose Research Online
Universities of Leeds, Sheffield and York
http://eprints.whiterose.ac.uk/
This is an author produced version of a paper published in Journal of Choice Modelling.
White Rose Research Online URL for this paper:
http://eprints.whiterose.ac.uk/43623/
Paper:
Bliemer, MCJ, Rose, JM and Hess, S (2008) Approximation Of Bayesian
Efficiency In Experimental Choice Designs. Journal of Choice Modelling, 1 (2). 98 – 127.
Approximation of Bayesian Efficiency
in Experimental Choice Designs
Michiel C.J. Bliemer1,2 John M. Rose1,* Stephane Hess1
m.c.j.bliemer@tudelft.nl johnr@itls.usyd.edu.au stephaneh@itls.usyd.edu.au
1
University of Sydney, Faculty of Economics and Business, School of Business, Institute of Transport and Logistics Studies, Newtown, NSW 2006, Australia 2
Delft University of Technology, Faculty of Civil Engineering and Geosciences, Transport & Planning Department, P.O. Box 5048, 2600 GA Delft, The Netherlands
*
corresponding author, (tel) +61 02 9351 0168, (fax) +61 (02) 9351 0088
Abstract
1. Introduction
The generation of stated choice (SC) experiments has evolved to become an increasingly important, but complex component of SC studies (Burgess and Street 2003; Carlsson and Martinsson 2003; Ferrini and Scarpa 2006; Huber and Zwerina
1996; Kanninen 2002; Kessels et al. 2006; Kuhfeld et al. 1994; Lazari and Anderson
1994; Sándor and Wedel 2001, 2002, 2005; Street and Burgess 2004; Street et al.
2001). Typically, SC experiments present sampled respondents with a number of hypothetical scenarios (known as choice situations) consisting of a universal but finite number of alternatives that differ on a number of attribute dimensions. These respondents are then asked to specify their preferred alternative from the set of alternatives presented within each choice situation based on the attribute levels shown. These responses are then pooled both over hypothetical choice scenarios and respondents before being used to estimate parameter weights for each of the design attributes (or in some cases, even attribute levels). These parameter weights may then be used to solve problems in many different research areas. For example, in transport, SC data has been used to examine the demand for a cycle-way network (e.g., Ortúzar
et al. 2000), and to calculate Value of Travel-Time Savings (VTTS) of commuters and non-commuters (e.g., Hensher 2001a,b), whilst in marketing, choice of orange juice (e.g., Swait and Adamozicz 2001) and soft drink and holiday destination choice (Louviere and Woodworth 1983) have been examined. In health economics for
example, SC methods have been used to model smoking cessation (Paterson et al. in
press) and different treatment options (e.g., Ratcliffe 2002).
Traditionally, researchers have relied upon the use of orthogonal experimental designs
to populate the hypothetical choice situations shown to respondents (see Louviere et
al., 2000, for a review of orthogonal designs). More recently however, some
researchers have begun to question the relevance of orthogonal designs when applied
to SC experiments (e.g., Huber and Zwerina 1996; Kanninen 2002; Kessels et al.
2006; Sándor and Wedel 2001, 2002, 2005). Whilst orthogonality is an important criterion to determine independent effects in linear models, discrete choice models are not linear (Train 2003). In models of discrete choice, the correlation structure between the attributes is not what is of importance. Rather, given the derivation of the models, it is the correlations of the differences in the attributes which should be of concern.
In order to calculate the AVC matrix for a SC design, the analyst requires a priori
knowledge of the utility functions for that design. This is because the values of the AVC matrix are directly dependent upon both the attribute levels and the choice probabilities of the alternatives contained within each of the design’s choice situations. The choice probabilities for a given design are in turn a function of the attribute levels of the alternatives as well as the parameter weights associated with each of these attributes. As such, the parameter values play a key role in determining the level of efficiency of a design. Unfortunately, the exact parameter values are unlikely to be known at the design construction phase, and as such, the researcher may have to make certain assumptions as to what values (termed priors) these will be in order to generate an efficient design.
Three different approaches have been used in the past regarding the parameter priors assumed in generating efficient SC experiments. In the first approach, researchers have made the strong assumption that all parameter priors for the design are simultaneously equal to zero (e.g., Burgess and Street 2003; Huber and Zwerina 1996;
Street and Burgess 2004; Street et al. 2001). Street et al. make this assumption for
analytical reasons, enabling them to locate truly optimal (most efficient) designs. This optimality will only exist under the assumption of zero parameter estimates, which is unlikely to hold in reality. A second approach that has sometimes been used is to assume that the parameter priors are non-zero and known with certainty (e.g., Carlsson and Martinsson 2003; Huber and Zwerina 1996; Rose and Bliemer 2005). In such an approach, a single fixed prior is assumed for each attribute. Whilst the assumption of perfect certainty is a strong one, the design generation process is such that researchers are able to test its impact on a design’s efficiency assuming misspecification of the priors. Sándor and Wedel (2001) introduced a third approach
by relaxing the assumption of perfect a priori knowledge of the parameter priors
through adopting a Bayesian approach to the design generation process. Rather than assume a single fixed prior for each attribute, the efficiency of a design is now determined over a number of draws taken from prior parameter distributions assumed by the researcher. Different distributions may be associated with different population moments representing different levels of uncertainty with regards to the true parameter values1.
The Bayesian approach to constructing efficient SC experiments requires that the efficiency of a design be evaluated over numerous different draws taken from the prior parameter distributions assumed in generating the design. The Bayesian efficiency of a design is then calculated as the expected value of whatever measure of efficiency is assumed over all the draws taken. The Bayesian approach therefore necessitates the use of simulation methods to approximate the expectations for differing designs. In this paper we will focus on the evaluation of the Bayesian efficiency of a given design and will not discuss algorithms for generating these
designs. Recently, Kessels et al. (in press) have proposed a generation method using
so-called minimum potential designs, which may be an interesting direction for further research.
1
For computing the Bayesian efficiency, a number of different simulation procedures are available to researchers, with the simplest being the use of pseudo random draws. In using pseudo random draws (often referred to as pseudo Monte Carlo, or PMC, draws), points from a distribution are randomly selected. Whilst simple to implement in practice, results obtained using PMC draws are susceptible to being specific to the particular draws taken from whatever distribution is assumed, with different sets of random draws likely to produce different coverage over the distribution space, possibly leading to widely different results when calculating the expectations. This risk is especially high with the use of a small number of draws. The precision of simulation processes may potentially be improved by using a more systematic approach in selecting points when sampling from a distribution. Such techniques are commonly referred to within the literature as quasi random Monte Carlo draws (see,
for example, Bhat 2001, 2003; Hess et al. 2005; Sándor and Train 2003). The
potential to provide better coverage of the distribution space for each prior parameter distribution should theoretically result in a lower approximation error in calculating the simulated choice probabilities for a given design. This in turn will result in greater precision in generating the design’s AVC matrix, resulting in greater precision in terms of the Bayesian efficiency measure of that design. Other methods, such as Gaussian quadrature, also aim to minimize the approximation error when calculating the Bayesian efficiency.
Independent of the type of draws used, the researcher must decide on the number of draws to use. If too few draws are taken, it is probable that the resulting Bayesian measure of efficiency will be far from the true efficiency for a given design. If too many draws are used, the computation time in generating an efficient design will be unnecessarily high. The issue therefore becomes one of how many draws should be used before the Bayesian measure of efficiency will converge to the true efficiency level for a given design, or alternatively, fall within some acceptable error range around the true value. Unfortunately, the answer to this question will likely depend on the dimensions of the design itself, the number of Bayesian priors assumed, the population of the prior distributions, the type of econometric model used, as well as the type of draws employed.
The purpose of this paper is to examine over a range of draws, the performance of various forms of draws in approximating the true level of efficiency for a number of different designs. This paper compares the performance of the PMC method to three different types of quasi random Monte Carlo draws, namely Halton, Sobol, and Modified Latin Hypercube Sampling (MLHS) draws, and one Gaussian quadrature method, namely Gauss-Hermite approximation. In making our comparisons, we vary not only the number of draws but also the dimensions of the designs. In doing so, we are able to make recommendations as to what are the best types of draws to use as well as how many to use when generating designs of different dimensions.
2. Efficiency of Experimental Designs for Discrete Choice Models
Historically, efficiency when dealing with SC studies has generally been related to how statistically reliable the parameters in a discrete choice model will likely be when estimated using data obtained from a SC experiment. Reliability of the parameters has been defined in terms of the asymptotic standard errors of the model to be estimated where improvements in reliability suggest a reduction in the asymptotic standard
errors and hence an increase in the asymptotic t-ratios of the model estimates. As
such, the use of more efficient designs leads to an expectation that a lower number of respondents will be required to produce statistically significant parameter estimates for a given SC study when compared to less efficient designs.
Measurement of the (in)efficiency of a SC experimental design is typically expressed
in terms of some form of error (e.g., D-error, A-error) derived from the AVC matrix
for the design. Both the dimensions of the AVC matrix of a design and the values that populate it will influence the (in)efficiency of the design. In turn, the AVC of a design will depend on the following:
(a) Econometricform of the discrete choice model estimated
Different discrete choice models (e.g., multinomial logit (MNL), nested logit (NL), mixed logit (ML) models) lead to different AVC matrices;
(b) Experimental design
Different choice situations (i.e., different combinations of attribute levels in each choice situation) lead to different AVC matrices; and
(c) Prior parameter values
Different assumptions made regarding the true values of the parameter estimates
result in different AVC matrices.
Let the AVC matrix be denoted by Ω( |β X), where β represents the prior parameter
values and X the attribute levels in the underlying experimental design. This matrix
can be determined (analytically or by simulation) for various econometric representations of the discrete choice models. The D-error, describing the inefficiency of a design, can be expressed as
(
)
1/( | ) det ( | ) K,
f β X = Ω β X (1)
where K is the number of parameters2. The lower this D-error, the higher the overall efficiency of the design will be. Hence, given the prior parameters and the discrete choice model, the aim in creating the experimental design is to find attribute levels X
such that this D-error is as low as possible. The design with the lowest D-error is termed D-optimal. Other (in)efficiency measures exist which may be substituted for D-error. For example, some researchers prefer A-error, where equation (1) now becomes (replacing the determinant by the trace of the matrix and normalizing it by dividing by the number of parameters):
2
(
)
tr ( | )
( | ) X .
f X
K β
β = Ω (2)
Up to this point, it has been assumed that the prior parameter values are fixed and known. As mentioned before, the parameters are unknowns to be estimated in the model using the data collected from some underlying SC experiment. The literature has suggested some starting points for identifying prior parameter values that may be useful in constructing efficient SC experiments such as obtaining them from previous studies, focus groups, pilot studies, managers, etc. (Sándor and Wedel 2001). Nevertheless, priors obtained using these methods will likely exhibit a certain degree of uncertainty. Unfortunately, an efficient experimental design is only efficient for the specified prior parameter values assumed; hence, if the priors are incorrectly specified, the experimental design may become less efficient. In order to generate a more robust experimental design incorporating uncertainty in the parameter priors assumed (i.e., the design generation process does not solely depend on fixed priors), a Bayesian approach has been proposed within the literature (Sándor and Wedel 2001). Using this approach, (a subset of) prior parameters are assumed to have random distribution(s) rather than fixed values. Such designs are known as Bayesian efficient designs if the expected efficiency is high (or the associated expected error low). Let
( | )
φ β θ denote the multivariate probability density function of the priors β, where θ
are the corresponding parameters of this distribution (e.g., if β follows a normal
distribution, then θ represents the means and standard deviations of this multivariate normal distribution). The Bayesian D-error (or A-error) can then be written as the expected D-error (A-error),
( )
( | ) ( | ) .E f f X d
β β φ β θ β
=
∫
(3)In the remainder of the paper, we will use the D-error criterion for design efficiency.
Minimizing the Bayesian D-error (denoted Db-error) will yield a Db-optimal
experimental design. Unfortunately, computation of the above integral is complex as it cannot be calculated analytically. Therefore, it has to be approximated, typically by simulation. Approximation of this integral can be time consuming. As in general millions of experimental designs may need to be evaluated when searching for a (Bayesian) efficient design, computation time is a real issue. For realistically sized experimental designs with many randomly distributed parameters, this may not be
feasible if the Db-error cannot be computed quickly. In the next section, different
approximations are outlined and discussed. We show that much better (and faster) approximation methods are available than those currently used by most researchers.
3. Approximation of Bayesian Efficiency
In this section we will describe several different methods for approximating the Db
Carlo simulation, and (c) Gaussian quadrature. The most common method is PMC simulation, which is currently used by all but few researchers3.
Independent of the method, the principles in generating efficient SC experiments remain the same:
1) first, R values are drawn from the random distribution of the prior parameter
values;
2) then, for each of these parameter values, the D-error is evaluated; and 3) an average D-error is computed over these values (giving the Db-error).
The PMC and quasi-random MC methods all take a simple (unweighted) average of
the different Db-errors, but differ in the way they take the draws from the random
distribution. In the PMC method, these draws are completely random, whereas in the
quasi-random MC methods they are intelligent and structured, and in most cases deterministic. The Gaussian quadrature methods construct intelligent and deterministic draws as well, but also determine specific weights for each draw and compute a weighted average.
Rather than drawing from a multivariate distribution, all methods generally use
independent draws from univariate distributions for each random prior βk, under the
assumption that all parameters are independent.4 Under this assumption, equation (3)
can be written as
1
1 1
( ) ( | ) ( | ) ( | ) ( | ) .
K
K
k k k K
k
E f f X d f X d d
β β φ β θ β β β β φ β θ β β
=
=
∫
=∫ ∫
∏
(4)Equation (4) also allows priors to have different forms of random distributions, such as mixing priors with a normal and a uniform distribution. The distribution parameters
k
θ will determine the mean prior value and the standard deviation (uncertainty) of
that prior. Hence, one can include uncertainty for each prior parameter by specifying the corresponding random distribution.
Below, each of the approximation methods will be outlined.
3.1 Pseudo-Random Monte Carlo (PMC) Simulation
In PMC simulation, for each of the K parameters, R independent draws are taken from their given prior distributions. For each of these R draws of the prior parameters, the
Db-error is computed. Finally, the average is taken of all computed D-errors. Let
( ) ( ) ( ) 1
[ , , ]
r r r
K
β = β … β denote draw r, r=1,…, ,R from the corresponding prior random
distributions described by the probability density functions φ β θk( k | k). The
approximation of the Db-error can be formalized as
3
Sándor and Wedel (2002, 2005) adopt a quasi random Monte Carlo approach; orthogonal array-based Latin hypercube sampling, and randomly shifted good lattice points, respectively. Yu et al. (in press) used Halton draws. All other papers reviewed appear to use PMC methods.
4
( )
1
1
( ) ( | ).
R r
r
E f f X
R = β
≈
∑
(5)The total number of D-error evaluations is equal to R. In order to determine the draws
( )r k
β , we let the computer generate for each parameter R pseudo-random numbers uk( )r
which are uniformly distributed on the interval [0,1], and then compute the draws by
( )
( ) 1 ( )
,
r r
k k uk β = Φ−
(6)
where Φk(β θk | k) denotes the cumulative distribution function corresponding to the probability density function φ β θk( k| k).
3.2 Quasi-Random Monte Carlo Simulation
Randomness of the draws is not a prerequisite in the approximation of the integral in equation (3); rather, it has been argued in the literature (see e.g., Winiarski, 2003) that (a) correlation between draws for different dimensions has a positive effect on the approximation, and (b) one should aim for the draws to be distributed as uniformly as possible over the area of integration. Hence, the draws can be selected deterministically so as to minimize the integration error, which is exactly what quasi-random MC simulation methods aim to do. For a more detailed discussion on these methods we refer to Niederreiter (1992) and Fang and Wang (1994). Quasi-random
MC simulation methods for approximating the Db-error are almost identical to the
PMC simulation method, except that they use deterministic draws for βk( )r (as
opposed to purely random draws). In fact, equations (5) and (6) are still valid, but instead of generating pseudo-random numbers uk( )r ∼U(0,1), these numbers uk( )r are taken from different intelligent quasi-random sequences, also called low discrepancy sequences. Using these quasi-random sequences, faster convergence to the true value of the numerical integration can be achieved. PMC simulation has a slow rate of
convergence of O
(
1/ R)
, while quasi-random MC simulation typically has a rate ofconvergence as good as O
( )
1/R .5In this paper, we examine three different sequences. MLHS aims to distribute the draws uniformly, while maintaining randomness between different dimensions. Halton and Sobol sequences provide a certain degree of uniformity in the distribution of the draws, but also introduce correlations between the sequences in different dimensions. We now look at these three approaches in turn.
5
3.2.1 Modified Latin Hypercube Sampling (MLHS)
The MLHS method (Hess et al. 2005) produces multi-dimensional sequences by
combining randomly shuffled versions of one-dimensional sequences made up of uniformly spaced points. Formally, the individual one-dimensional sequences of length R are constructed as:
( ) 1
, 1, , ,
r
k k
r
u r R
R ξ −
= + = … (7)
where ξk is a random number drawn between 0 and 1/ ,R and where a different
random draw is used in each of the K different dimensions. In the resulting sequence, the distances between adjacent draws are all equal to 1/ ,R satisfying the condition of equal spacing. Multi-dimensional sequences are constructed by simple combination of randomly shuffled one-dimensional sequences, where the shuffling disrupts the correlation between individual dimensions.
3.2.2 Halton Sequences
Halton sequences (Halton 1960) are constructed according to a deterministic method based on the use of prime numbers, dividing the 0-1 space into pk segments (with pk
giving the prime used as the base for parameter k), and by systematically filling in the
empty spaces, using cycles of length pk that place one draw in each segment.
Formally, the rth element in the Halton sequence based on prime p k is obtained by taking the radical inverse of integer r in base pk by reflection through the radical point, such that
( )
0
,
L r
k
r b p
=
=
∑
(8)where 0≤b( )r ≤ pk−1 determines the L digits used in base pk in order to represent r
(i.e., solving equation (8)), and where the range for L is determined by 1
.
L L
k k
p ≤ <r p +
The draw is then obtained as:6
( ) ( ) 1
0
.
L
r r
k k
u b p− −
=
=
∑
(9)To allow for the computation of a simulation error, the deterministic Halton sequence can be randomized in several ways. Here, we use the approach discussed by amongst others Tuffin (1996), where the modified draws are obtained by adding a random
draw ξk to the individual draws in dimension k, and by subtracting one from any
6
As an example, consider the 5th draw using 2 (the first prime number) as base. Then r = 5 can be expressed using three digits as 101 in base 2, because 5= ⋅ + ⋅ + ⋅1 20 0 21 1 2 .2
draws that now fall outside the 0-1 interval. A different random draw is used for each dimension.
3.2.3 Sobol Sequences
The main problem with Halton sequences is the fact that the individual sequences are highly correlated, leading to problems with poor multi-dimensional coverage in higher dimensions. Aside from various transformations of the standard Halton sequence and
other advanced methods (cf. Hess et al. 2005), one approach that has received
exposure in the area of discrete choice modeling is the Sobol sequence, used amongst others by Garrido (2003). Like Halton sequences, Sobol sequences are based on Van
der Corput sequences (cf. Niederreiter 1992). However, rather than in a K
-dimensional problem using the first K primes (as in Halton sequences), Sobol
sequences are based on prime 2 in each dimension, where different permutations are
used to ensure that the resulting K-dimensional sequence obtains good coverage. We
will use a randomized version of the Sobol sequences equivalent to the randomization in the Halton sequences by adding a random component to each of the draws in each dimension.
3.3 Gaussian quadrature
Polynomial cubature methods aim to approximate integrals using orthogonal polynomials. Gaussian quadrature is the best-known method, see e.g. Stoer and
Bulirsch (2002). In case of a single variable, the use of R draws yields an exact
approximation if the integrand is a polynomial up to degree (2R-1). General functions can be approximated by (high order) polynomials, hence the higher the degree (yielding more draws), the more accurate the approximation will be.
The principle of Gaussian quadrature is that not only the draws βk( )r for the priors are selected intelligently, but also that weights w( )kr are associated with each draw. The
approximation of the Db-error using Gaussian quadrature can be formalized as
1
1 1
1
( ) ( ) ( ) ( )
1 1
1 1
( ) ( , , | ).
K
K K
K
R R
r r r r
K K
r r
E f w w f β β X
= =
≈
∑ ∑
… (10)The draws for the priors and the associated weights depend on the random distribution. Different draws βk( )r for each individual parameter are called abscissas.
The draws for the whole vector β( )r are given by a rectangular grid of these
abscissas.7 In the case where βk ∼N(µ σk, k), the abscissas and weights can be computed using so-called Hermite polynomials. If βk ∼U a b( k, k), the abscissas and weights can be computed using so-called Legendre polynomials. The abscissas and
7
For example, suppose that the first parameter has two abscissas and the second parameter has three. Let (1)
1
β and (2) 1
β denote the abscissas for the first parameter and (1) 2 ,
β (2)
2
β and (3) 2
β the abscissas of the second parameter. Then the draws for β will be (β β1(1), 2(1)),
(1) (2)
1 2
(β β, ), (β β1(1), 2(3)), (β β1(2), 2(1)),
(2) (2)
1 2
(β ,β ), and (2) (3)
1 2
weights for both situations are listed in Table 1 for up to 10 abscissas for each
individual parameter. The weights always sum up to one, i.e., ( )
1 1
R r k r= w =
∑
for each k. [image:12.595.88.512.154.637.2]For each of the K parameters, the number of abscissas used, Rk, can be different.
Table 1:Abscissas and weights for Gauss-Hermite and Gauss-Legendre integration
Normal distribution N(µ σk, k)
( ) ( )
2
r r
k k x k
β =µ + σ
Uniform distribution U a b( k, k)
( ) 1 1 ( )
2( ) 2( )
r r
k ak bk bk a xk
β = + + −
k
R ( )r
x wk( )r x( )r wk( )r
1 0.0000000000 1.0000000000 0.0000000000 1.0000000000
2 ±0.7071067812 0.5000000000 ±0.5773502692 0.5000000000
3 0.0000000000 ±1.2247448714 0.6666666667 0.1666666667 0.0000000000 ±0.7745966700 0.4444444444 0.2777777778 4 ±1.6506801239 ±0.5246476233 0.0458758548 0.4541241452 ±0.3399810400 ±0.8611363100 0.3260725750 0.1739274250 5 0.0000000000 ±2.0201828705 ±0.9585724646 0.5333333333 0.0112574113 0.2220759220 0.0000000000 ±0.5384693100 ±0.9061798500 0.2844444450 0.2393143350 0.1184634450 6 ±2.3506049737 ±1.3358490740 ±0.4360774119 0.0025557844 0.0886157460 0.4088284696 ±0.2386191800 ±0.6612093900 ±0.9324695100 0.2339569650 0.1803807850 0.0856622450 7 0.0000000000 ±2.6519613568 ±1.6735516288 ±0.8162878829 0.4571428571 0.0005482689 0.0307571240 0.2401231786 0.0000000000 ±0.4058451500 ±0.7415311900 ±0.9491079100 0.2089795900 0.1909150250 0.1398526950 0.0647424850 8 ±2.9306374203 ±1.9816567567 ±1.1571937125 ±0.3811869902 0.0001126145 0.0096352201 0.1172399077 0.3730122577 ±0.1834346400 ±0.5255324100 ±0.7966664800 ±0.9602898600 0.1813418900 0.1568533250 0.1111905150 0.0506142700 9 0.0000000000 ±3.1909932018 ±2.2665805845 ±1.4685532892 ±0.7235510188 0.4063492063 0.0000223458 0.0027891413 0.0499164068 0.2440975029 0.0000000000 ±0.3242534234 ±0.6133714327 ±0.8360311073 ±0.9681602395 0.1651196775 0.1561735385 0.1303053482 0.0903240803 0.0406371942 10 ±3.4361591188 ±2.5327316742 ±1.7566836493 ±1.0366108298 ±0.3429013272 0.0000043107 0.0007580709 0.0191115805 0.1354837030 0.3446423349 ±0.1488743400 ±0.4333953900 ±0.6794095700 ±0.8650633700 ±0.9739065300 0.1477621100 0.1346333600 0.1095431800 0.0747256750 0.0333356700
Note that the total number of D-error evaluations in Gaussian quadrature is equal to
1 , K k k R R =
=
∏
that is, the total number of all combinations of abscissas in alldimensions. This number of D-error evaluations grows exponentially if the number of random priors increases.8 Therefore, Gaussian quadrature is typically not suitable for
8
integrals of high dimensionality, although it is extremely powerful for low-dimensional problems.
4. Case studies
4.1 Model and experimental design description
We consider six different discrete choice models with the number of parameters
ranging from two to 14, see Table 2, where the number of utility functions
(alternatives) is either two or three. They are all of the multinomial logit (MNL) type, although a similar analysis could be performed for nested logit (NL) and mixed logit (ML) by replacing the AVC matrix, see Appendix A. The levels of the attributes are given in Table 3, where some of the attributes are dummy-coded. The constants in the model are assumed to have fixed priors (the constants are essentially design parameters in a stated choice experiment), where the uncertainty about the other parameters translates into random prior parameter values. In our case studies, each
prior parameter βk is assumed to be normally distributed with a mean µk and a
standard deviation σk,
( , ).
k N k k
[image:13.595.88.519.395.720.2]β ∼ µ σ (11)
Table 2: Model specifications
Model Systematic utility functions Comments
M1 1 1 11 2 12
2 1 21 2 22
V x x
V x x
β β
β β
= +
= +
0 constants 2 generic par. 0 alt.-spec. par.
M2 1 01 1 11 2 12 3 13
2 1 21 2 22 4 23
V x x x
V x x x
β β β β
β β β
= + + +
= + +
1 constant 2 generic par. 2 alt.-spec. par.
M3 1 01 1 11 2 12 3 13
2 02 1 21 2 22 4 23
3 1 31 2 32 5 33 6 34
V x x x
V x x x
V x x x x
β β β β
β β β β
β β β β
= + + +
= + + +
= + + +
2 constants 2 generic par. 4 alt.-spec. par.
M4 1 01 1 11 2 12 3 13 4 14
(1) 2 02 1 21 2 22 5 23 6 24
3 1 31 2 32 7 33 8 34
V x x x x
V x x x x
V x x x x
β β β β β
β β β β β
β β β β
= + + + +
= + + + +
= + + +
2 constants 2 generic par. 6 alt.-spec. par. (1 for dummy)
M5 (1) (2)
1 01 1 11 2 12 3 14 4 15 5 15 (1) (2) (1) 2 02 1 21 2 22 6 25 7 25 8 26
(1) 3 1 31 2 32 9 33 10 35
V x x x x x
V x x x x x
V x x x x
β β β β β β
β β β β β β
β β β β
= + + + + +
= + + + + +
= + + +
2 constants 2 generic par. 8 alt.-spec. par. (6 for dummies)
M6 (1) (2)
1 01 1 11 2 16 3 12 4 14 5 15 6 15 (1) (2) (1)
2 02 1 21 2 27 3 22 7 25 8 25 9 26 10 28 (1)
3 1 31 2 36 3 32 11 33 12 35
V x x x x x x
V x x x x x x x
V x x x x x
β β β β β β β
β β β β β β β β
β β β β β
= + + + + + +
= + + + + + + +
= + + + +
Table 3: Attribute levels
Attribute Number of levels Levels
01,
x x02 1 1
11,
x x21, x31 3 10, 20, 30
12,
x x22,x32 3 1, 3, 5
13,
x x23 3 2, 4, 6
14
x 3 4, 7, 10
15,
x x25 3 dummy-coded
16
x 3 5, 10, 15
24,
x x26,x35, 2 dummy-coded
28
x 3 1, 2, 3
33
x 3 3, 5, 7
34
x 4 2, 4, 6, 8
Table 4: Prior parameter mean values
model β01 β02 β1 β2 β3 β4 β5 β6 β7 β8 β9 β10 β11 β12
M1 - - -0.09 -0.3 - - -
M2 1.2 - -0.09 -0.3 0.5 0.8 - - -
M3 3.0 1.4 -0.09 -0.3 0.5 0.9 0.3 0.7 - - - -
M4 -1.2 0.8 -0.09 -0.3 0.5 0.6 0.9 1.2 0.3 0.7 - - - -
M5 -3.0 -1.5 -0.09 -0.3 0.9 0.6 0.9 0.3 0.8 1.2 0.3 0.8 - -
M6 -3.3 1.0 -0.09 -0.06 -0.3 0.6 0.5 0.9 0.3 0.8 1.2 -0.3 0.3 0.8
The means µk are listed in Table 4 while the standard deviations are taken as a
function of the mean,
, 0.
k k
σ =α µ α ≥ (12)
We will consider two situations, namely a small uncertainty about the priors using
0.1
α = and a large uncertainty about the priors using α =0.3.
The designs (D1 through D6 for models M1 through M6) used for assessing the Db
-errors with different approximations are listed in Appendix B. In the next subsection
the Db-errors calculated using the different approximation methods are compared for
each model/design.
4.2 Comparison of approximation methods
For each design we calculate the Db-error using the five different approximations:
PMC draws, MLHS, Halton sequences, Sobol sequences, and Gauss-Hermite. For
each design, all approximation outcomes are compared to the true value of the Db
[image:14.595.85.511.354.459.2]same true Db-error in the limit). The Db-errors are computed for different numbers of
draws, from 20 draws up to 10,000–40,000 draws (depending on the model/design). The deviation from the true Db-error is computed as a percentage.
Rather than computing a single percentage for the deviation from the true Db-error for
a given number of draws in each approximation, 50 deviations are computed by changing the draws 50 times randomly, which is trivial for PMC draws and MLHS and is described for Halton sequences and Sobol sequences in Section 3. Using these
50 values, we determine the 95 percent confidence intervals for the Db-errors. Since
Gaussian quadrature is completely deterministic, these draws cannot be randomized; hence, there is no need to compute a confidence interval in this case. In Gaussian quadrature, the number of draws cannot be chosen arbitrarily, as the number of draws should be a multiple of the number of abscissas used. We increase the number of draws each time by increasing the number of abscissas for a single parameter prior. Note that we do not require that each individual parameter prior has the same number of abscissas. Instead, we use different numbers of abscissas for each prior, depending on the impact this prior has on the utility. That is, if a prior has a large effect on the utility (i.e., if both the prior parameter value and the attribute levels are high) and has a large standard deviation, then we require more information on this prior in order to
calculate the Db-error more accurately. The priors are ranked in decreasing order of
the mean value multiplied with the corresponding average attribute level. Starting with a single abscissa for each prior, the prior with the highest order will face an increase in the number of abscissas first, then the second in order, etc., until all priors have two abscissas each. Then the procedure starts all over again by increasing the number of abscissas for each prior in the same order. The total number of draws used in the Gauss-Hermite approximation is equal to the product of all prior abscissas, as mentioned in Section 3.3.
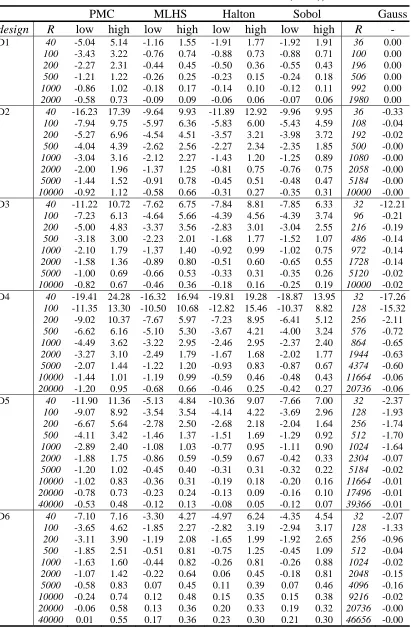
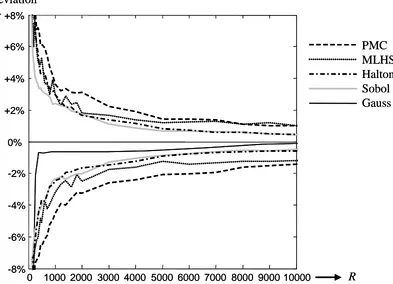
Figure 1 depicts confidence intervals for the deviations from the true Db-errors for the
Table 5: Confidence intervals for true Db-error (in %), α =0.1
PMC MLHS Halton Sobol Gauss
design R Low high low high low high low high R -
D1 40 -1.59 1.55 -0.44 0.43 -0.64 0.57 -0.57 0.56 36 0.00
100 -1.04 0.94 -0.18 0.18 -0.29 0.24 -0.27 0.23 100 0.00
200 -0.73 0.73 -0.12 0.11 -0.15 0.10 -0.17 0.12 196 0.00
500 -0.39 0.39 -0.04 0.06 -0.07 0.04 -0.07 0.05 506 0.00
1000 -0.26 0.31 -0.02 0.02 -0.04 0.03 -0.04 0.03 992 0.00
2000 -0.18 0.22 -0.02 0.02 -0.02 0.01 -0.02 0.02 1980 0.00 D2 40 -1.50 1.59 -0.85 0.98 -0.79 0.83 -0.81 0.83 36 0.00
100 -0.79 0.91 -0.40 0.48 -0.42 0.36 -0.44 0.41 108 0.00
200 -0.54 0.67 -0.35 0.36 -0.25 0.23 -0.32 0.32 192 0.00
500 -0.38 0.41 -0.22 0.23 -0.14 0.15 -0.16 0.15 500 0.00
1000 -0.26 0.27 -0.15 0.13 -0.08 0.08 -0.08 0.06 1080 0.00
2000 -0.16 0.17 -0.12 0.11 -0.04 0.04 -0.04 0.04 2058 0.00
5000 -0.14 0.14 -0.06 0.08 -0.02 0.02 -0.02 0.03 5184 0.00
10000 -0.08 0.10 -0.06 0.05 -0.02 0.02 -0.02 0.02 10000 0.00 D3 40 -1.67 1.59 -0.98 1.01 -1.05 1.24 -1.06 0.89 32 -1.86
100 -1.06 0.93 -0.48 0.60 -0.56 0.57 -0.55 0.48 96 -0.01
200 -0.68 0.69 -0.40 0.36 -0.32 0.33 -0.38 0.34 216 -0.01
500 -0.43 0.41 -0.26 0.25 -0.17 0.18 -0.17 0.14 486 -0.01
1000 -0.30 0.28 -0.18 0.19 -0.10 0.11 -0.11 0.10 972 0.00
2000 -0.22 0.21 -0.16 0.13 -0.05 0.07 -0.07 0.07 1728 0.00
5000 -0.14 0.11 -0.09 0.08 -0.03 0.03 -0.03 0.03 5120 0.00
10000 -0.11 0.10 -0.05 0.07 -0.01 0.02 -0.02 0.02 10000 0.00 D4 40 -2.13 2.59 -1.57 1.77 -1.47 1.53 -1.95 1.46 32 -2.42
100 -1.20 1.32 -0.83 0.80 -0.92 1.07 -0.91 0.77 128 -1.98
200 -0.79 0.89 -0.76 0.71 -0.52 0.60 -0.52 0.46 256 0.00
500 -0.64 0.62 -0.47 0.44 -0.24 0.31 -0.26 0.23 576 0.00
1000 -0.41 0.36 -0.30 0.27 -0.14 0.20 -0.14 0.15 864 -0.01
2000 -0.32 0.32 -0.21 0.20 -0.10 0.12 -0.12 0.11 1944 -0.01
5000 -0.21 0.15 -0.14 0.12 -0.05 0.05 -0.05 0.05 4374 0.00
10000 -0.16 0.12 -0.09 0.09 -0.03 0.03 -0.03 0.03 11664 0.00
20000 -0.11 0.09 -0.04 0.06 -0.02 0.02 -0.02 0.02 20736 0.00 D5 40 -1.96 2.31 -0.77 0.63 -1.93 1.62 -1.29 1.14 32 -0.48
100 -1.44 1.56 -0.46 0.44 -0.85 0.82 -0.56 0.45 128 -0.13
200 -1.30 1.17 -0.27 0.25 -0.49 0.43 -0.31 0.27 256 -0.05
500 -0.79 0.67 -0.13 0.12 -0.21 0.22 -0.15 0.09 512 -0.03
1000 -0.59 0.46 -0.09 0.09 -0.11 0.12 -0.09 0.08 1024 -0.03
2000 -0.39 0.38 -0.08 0.07 -0.07 0.08 -0.03 0.03 2304 0.01
5000 -0.22 0.22 -0.03 0.04 -0.04 0.04 -0.02 0.02 5184 0.00
10000 -0.20 0.16 -0.03 0.03 -0.02 0.02 -0.01 0.01 11664 0.00
20000 -0.16 0.15 -0.02 0.02 -0.01 0.01 -0.01 0.01 17496 0.00
40000 -0.11 0.10 -0.01 0.01 -0.01 0.01 -0.01 0.01 39366 0.00 D6 40 -1.15 1.11 -0.33 0.39 -0.94 0.90 -0.60 0.57 32 -0.29
100 -0.68 0.82 -0.21 0.22 -0.51 0.44 -0.36 0.29 128 -0.18
200 -0.58 0.64 -0.14 0.14 -0.35 0.27 -0.23 0.23 256 -0.14
500 -0.31 0.32 -0.10 0.10 -0.19 0.17 -0.06 0.08 512 -0.02
1000 -0.27 0.18 -0.07 0.06 -0.06 0.05 -0.05 0.06 1024 -0.01
2000 -0.20 0.17 -0.04 0.04 -0.03 0.03 -0.05 0.06 2048 0.01
5000 -0.13 0.09 -0.03 0.04 -0.02 0.01 -0.02 0.02 4096 0.00
10000 -0.07 0.07 -0.02 0.02 -0.01 0.01 -0.01 0.01 9216 0.00
20000 -0.04 0.05 -0.02 0.02 -0.01 0.01 -0.01 0.01 20736 0.00
Table 6: Confidence intervals for true Db-error (in %), α =0.3
PMC MLHS Halton Sobol Gauss
design R low high low high low high low high R -
D1 40 -5.04 5.14 -1.16 1.55 -1.91 1.77 -1.92 1.91 36 0.00
100 -3.43 3.22 -0.76 0.74 -0.88 0.73 -0.88 0.71 100 0.00
200 -2.27 2.31 -0.44 0.45 -0.50 0.36 -0.55 0.43 196 0.00
500 -1.21 1.22 -0.26 0.25 -0.23 0.15 -0.24 0.18 506 0.00
1000 -0.86 1.02 -0.18 0.17 -0.14 0.10 -0.12 0.11 992 0.00
2000 -0.58 0.73 -0.09 0.09 -0.06 0.06 -0.07 0.06 1980 0.00 D2 40 -16.23 17.39 -9.64 9.93 -11.89 12.92 -9.96 9.95 36 -0.33
100 -7.94 9.75 -5.97 6.36 -5.83 6.00 -5.43 4.59 108 -0.04
200 -5.27 6.96 -4.54 4.51 -3.57 3.21 -3.98 3.72 192 -0.02
500 -4.04 4.39 -2.62 2.56 -2.27 2.34 -2.35 1.85 500 -0.00
1000 -3.04 3.16 -2.12 2.27 -1.43 1.20 -1.25 0.89 1080 -0.00
2000 -2.00 1.96 -1.37 1.25 -0.81 0.75 -0.76 0.75 2058 -0.00
5000 -1.44 1.52 -0.91 0.78 -0.45 0.51 -0.48 0.47 5184 -0.00
10000 -0.92 1.12 -0.58 0.66 -0.31 0.27 -0.35 0.31 10000 -0.00 D3 40 -11.22 10.72 -7.62 6.75 -7.84 8.81 -7.85 6.33 32 -12.21
100 -7.23 6.13 -4.64 5.66 -4.39 4.56 -4.39 3.74 96 -0.21
200 -5.00 4.83 -3.37 3.56 -2.83 3.01 -3.04 2.55 216 -0.19
500 -3.18 3.00 -2.23 2.01 -1.68 1.77 -1.52 1.07 486 -0.14
1000 -2.10 1.79 -1.37 1.40 -0.92 0.99 -1.02 0.75 972 -0.14
2000 -1.58 1.36 -0.89 0.80 -0.51 0.60 -0.65 0.55 1728 -0.14
5000 -1.00 0.69 -0.66 0.53 -0.33 0.31 -0.35 0.26 5120 -0.02
10000 -0.82 0.67 -0.46 0.36 -0.18 0.16 -0.25 0.19 10000 -0.02 D4 40 -19.41 24.28 -16.32 16.94 -19.81 19.28 -18.87 13.95 32 -17.26
100 -11.35 13.30 -10.50 10.68 -12.82 15.46 -10.37 8.82 128 -15.32
200 -9.02 10.37 -7.67 5.97 -7.23 8.95 -6.41 5.12 256 -2.11
500 -6.62 6.16 -5.10 5.30 -3.67 4.21 -4.00 3.24 576 -0.72
1000 -4.49 3.62 -3.22 2.95 -2.46 2.95 -2.37 2.40 864 -0.65
2000 -3.27 3.10 -2.49 1.79 -1.67 1.68 -2.02 1.77 1944 -0.63
5000 -2.07 1.44 -1.22 1.20 -0.93 0.83 -0.87 0.67 4374 -0.60
10000 -1.44 1.01 -1.19 0.99 -0.59 0.46 -0.48 0.43 11664 -0.06
20000 -1.20 0.95 -0.68 0.66 -0.46 0.25 -0.42 0.27 20736 -0.06 D5 40 -11.90 11.36 -5.13 4.84 -10.36 9.07 -7.66 7.00 32 -2.37
100 -9.07 8.92 -3.54 3.54 -4.14 4.22 -3.69 2.96 128 -1.93
200 -6.67 5.64 -2.78 2.50 -2.68 2.18 -2.04 1.64 256 -1.74
500 -4.11 3.42 -1.46 1.37 -1.51 1.69 -1.29 0.92 512 -1.70
1000 -2.89 2.40 -1.08 1.03 -0.77 0.95 -1.11 0.90 1024 -1.64
2000 -1.88 1.75 -0.86 0.59 -0.59 0.67 -0.42 0.33 2304 -0.07
5000 -1.20 1.02 -0.45 0.40 -0.31 0.31 -0.32 0.22 5184 -0.02
10000 -1.02 0.83 -0.36 0.31 -0.19 0.18 -0.20 0.16 11664 -0.01
20000 -0.78 0.73 -0.23 0.24 -0.13 0.09 -0.16 0.10 17496 -0.01
40000 -0.53 0.48 -0.12 0.13 -0.08 0.05 -0.12 0.07 39366 -0.01 D6 40 -7.10 7.16 -3.30 4.27 -4.97 6.24 -4.35 4.54 32 -2.07
100 -3.65 4.62 -1.85 2.27 -2.82 3.19 -2.94 3.17 128 -1.33
200 -3.11 3.90 -1.19 2.08 -1.65 1.99 -1.92 2.65 256 -0.96
500 -1.85 2.51 -0.51 0.81 -0.75 1.25 -0.45 1.09 512 -0.04
1000 -1.63 1.60 -0.44 0.82 -0.26 0.81 -0.26 0.88 1024 -0.02
2000 -1.07 1.42 -0.22 0.64 0.06 0.45 -0.18 0.81 2048 -0.15
5000 -0.58 0.83 0.07 0.45 0.11 0.39 0.07 0.46 4096 -0.16
10000 -0.24 0.74 0.12 0.48 0.15 0.35 0.15 0.38 9216 -0.02
20000 -0.06 0.58 0.13 0.36 0.20 0.33 0.19 0.32 20736 -0.00
0 1000 2000 3000 4000 5000 6000 7000 8000 9000 10000 -8%
-6% -4% -2% 0% +2% +4% +6% +8%
PMC MLHS Halton Sobol Gauss
R
deviation
0 1000 2000 3000 4000 5000 6000 7000 8000 9000 10000 -8%
-6% -4% -2% 0% +2% +4% +6% +8%
PMC MLHS Halton Sobol Gauss
R
[image:18.595.105.498.84.368.2]deviation
Figure 1:Confidence intervals fordeviation of the true Db-error of design D3
In Table 5 and Table 6, the 95 percent confidence intervals (from low to high) of the deviations are indicated for PMC, MLHS, Halton, and Sobol sequences for different
numbers of draws R, while the deterministic deviations from Gauss-Hermite is
indicated in the last column. As the number of draws for Gauss-Hermite in general
does not match the number of draws from the other methods, feasible values of R that
are closest to the number of draws for the other methods are shown.
Comparing Table 5 and Table 6, larger standard deviations result in greater difficulty
in approximating the Db-error than smaller standard deviations. Only a few draws are
needed in order to have the 95 percent confidence interval of the deviation within ±1 percent. Even though the PMC method is outperformed by all other methods (particularly by Gauss-Hermite) in the case of small standard deviations, it can be concluded that the approximation method is of particular importance in cases where the standard deviations are larger, making it more difficult to compute the Db-error.
As such, we will focus mainly on the results dealing with large standard deviations in the priors.
As expected, Gauss-Hermite is preferred in designs with lower dimensions (designs D1 and D2 have 2 and 4 random priors, respectively) as indicated in Table 6, where
even with small numbers of draws, the true Db-error is accurately reproduced. In
designs with higher dimensions (design D3–D6 have 6, 8, 10, and 12 random priors,
respectively) Gauss-Hermite has slightly more problems with computing the Db-error,
incremental Gaussian quadrature) in which not all priors are given the same number of abscissas, which significantly reduces the number of draws needed for higher-dimensional problems. Overall, our findings suggest that Gauss-Hermite outperforms the other methods considered within this paper. However, it is worth noting that, mainly with designs D3 and D4, the Gauss-Hermite method has difficulties when a
small number of draws (R<100) is used. This is due to the fact that with a small
number of draws, the Gauss-Hermite method is unable to pick up enough variance in the prior parameters. Nevertheless, it performs well with more draws.
Halton and Sobol sequences perform similarly, clearly outperforming tPMC draws. It is interesting to note that in all designs, MLHS performs well compared to the PMC method and similar to using Halton and Sobol sequences when low numbers of draws
are used. However, whenever the number of draws increases, the Db-error from
MLHS does not converge as rapidly to the true value as Halton and Sobol do. This may be explained by the way the sequences are constructed. PMC draws lacks both a uniform spread of the integration area and correlation between the draws in different dimensions, which were properties that have a positive effect on the accuracy of the approximation (see Section 3). MLHS has a uniform spread by definition, but correlation is removed as much as possible by randomizing the order of the draws in each dimension. Halton and Sobol sequences are less uniform in their spread (particularly with low number of draws), but the correlation between the dimensions
has positive effect on the outcomes (at least for smaller dimensions). With small R,
MLHS produces more uniform sequences than Halton or Sobol sequences. However, with larger R this uniformity plays less of a role and the importance of the correlation between the sequences may become more important.
Rather than looking at the percentage deviation from the true Db-error for different
numbers of draws, we can consider the reverse by looking at the number of draws needed in order to ensure (with 95 percent certainty; and 100 percent certainty in case of Gauss-Hermite) that the deviation is not more than a certain percentage. The results are shown in Table 7, where the numbers of draws have been determined by inverting the lines in Figure 1 (and using linear interpolation).
With small standard deviations (α =0.1), the number of draws required to be within
one percent from the true Db-error is typically not larger than 100 for all designs.
However, in the case where the prior parameter distributions are assumed to have
large standard deviations (α =0.3), a much larger number of draws is necessary.
Compare the outcomes for design D1 using large standard deviations. If one would like to be with 95 percent probability within 0.5 percent from the true Db-error, more
Table 7: Number of draws for different allowed maximum deviations Design 1, α=0.1 Design 1, α=0.3
Dev. PMC MLHS Halton Sobol Gauss PMC MLHS Halton Sobol Gauss 5.0% <20 <20 <20 <20 1 45 <20 <20 <20 1 4.0% <20 <20 <20 <20 1 73 <20 <20 <20 2 3.0% <20 <20 <20 <20 1 126 <20 27 27 4 2.0% 26 <20 <20 <20 1 242 29 39 39 4 1.0% 111 <20 26 22 1 1,033 74 78 85 4 0.5% 352 37 52 51 2 >2,000 139 204 252 4
Design 2, α=0.1 Design 2, α=0.3
Dev. PMC MLHS Halton Sobol Gauss PMC MLHS Halton Sobol Gauss 5.0% <20 <20 <20 <20 1 294 116 115 110 16 4.0% <20 <20 <20 <20 1 577 293 150 199 16 3.0% <20 <20 <20 <20 2 1,115 348 288 327 24 2.0% 21 <20 <20 <20 2 2,016 1,400 645 629 24 1.0% 89 39 33 32 4 >10,000 4,543 1,592 1,389 24 0.5% 293 85 88 83 8 >10,000 >10,000 3,947 4,810 36
Design 3, α=0.1 Design 3, α=0.3
Dev. PMC MLHS Halton Sobol Gauss PMC MLHS Halton Sobol Gauss 5.0% <20 <20 <20 <20 2 200 112 76 86 64 4.0% <20 <20 <20 <20 2 297 161 121 115 64 3.0% <20 <20 <20 <20 4 539 275 158 204 64 2.0% 31 <20 <20 <20 32 1,415 647 420 351 64 1.0% 106 64 56 44 64 4,987 1,943 997 1,247 64 0.5% 367 154 119 111 64 >10,000 8,956 2,594 2,825 64
Design 4, α=0.1 Design 4, α=0.3
Dev. PMC MLHS Halton Sobol Gauss PMC MLHS Halton Sobol Gauss 5.0% <20 <20 <20 <20 4 871 441 390 320 256 4.0% <20 <20 <20 <20 4 1,171 581 657 499 256 3.0% 34 <20 <20 <20 8 2,398 1,087 984 769 256 2.0% 65 32 <20 27 128 6,342 2,676 1,703 2,034 384 1.0% 179 85 106 89 256 >20,000 11,525 4,749 4,278 384 0.5% 691 270 243 210 256 >20,000 >20,000 14,343 9,758 6,561
Design 5, α=0.1 Design 5, α=0.3
Dev. PMC MLHS Halton Sobol Gauss PMC MLHS Halton Sobol Gauss 5.0% <20 <20 <20 <20 1 300 48 86 79 16 4.0% <20 <20 <20 <20 1 540 75 107 95 16 3.0% 24 <20 <20 <20 16 970 144 186 138 16 2.0% 59 <20 37 <20 32 1,696 233 419 220 128 1.0% 278 35 83 57 32 8,634 1,096 954 1,076 1,536 0.5% 1,392 88 193 112 32 >40,000 4,604 2,820 1,624 1,536
Design 6, α=0.1 Design 6, α=0.3
Dev. PMC MLHS Halton Sobol Gauss PMC MLHS Halton Sobol Gauss 5.0% <20 <20 <20 <20 1 87 36 67 33 8 4.0% <20 <20 <20 <20 1 187 45 85 55 8 3.0% <20 <20 <20 <20 1 401 91 105 114 8 2.0% <20 <20 26 <20 2 656 145 139 290 64 1.0% 57 <20 39 <20 2 4,192 481 768 860 256 0.5% 294 34 102 60 8 >40,000 4,452 1,888 4,129 512
draws with the same number of draws. Nonetheless, the number of draws in Gauss-Hermite approximation is dictated by the product of the prior abscissas and choosing a small value may therefore be impossible in a large design. In that case, there is always the option of using Halton or Sobol sequences, as the number of draws can be selected
arbitrarily, although one should realize that the approximated Db-error may deviate
largely from the true value.
5. Conclusions and discussion
This paper compares the performance of PMC draws to several types of quasi random Monte Carlo draws, as well as to a single Gaussian quadrature method, when using Bayesian methods to generate efficient SC designs. The quasi random Monte Carlo draws include Halton sequences, Sobol sequences and MLHS whilst the Gaussian quadrature method examined is Gauss-Hermite. Performance comparisons are made for six SC designs with various design dimensions (attributes and alternatives) as well as over different assumptions regarding the standard deviations of the prior parameter distributions. In all but a few cases involving an extremely small number of draws, Gauss-Hermite approximation appears to outperform all other methods in reproducing the true level of a design’s level of efficiency, whilst the PMC method appears to perform worst in nearly all cases. When the standard deviations of the prior parameter distributions are relatively small (i.e., the researcher is more certain about the true parameter value), draws from Halton, Sobol and MLHS appear to perform equally well. However, with larger standard deviations in the prior parameter distributions and as the dimension of the problem increases, the performance of MLHS is slightly worse than both Halton and Sobol sequences. Furthermore, all approximation methods need more draws if the standard deviations of the priors are larger.
Our findings call into question the predominant use within the literature of PMC draws to generate Bayesian efficient SC designs. Our findings suggest that designs generated using PMC methods are unlikely to be truly efficient under the assumptions made by the researcher (that is the population moments of the prior parameter distributions) unless an impractically large number of draws are used. The results of this paper suggest that whilst quasi random Monte Carlo methods perform much better than the PMC method, better approximation to the true level of efficiency of a design may be achieved using Gaussian quadrature methods. This result conflicts with evidence offered in other areas using simulation methods (mainly in estimating the random parameters in mixed logit models) which suggest that Halton draws outperform Gauss-Hermite approximations (Bhat 2001) in obtaining more correct results. In this paper, we have used an incremental Gauss-Hermite approximation, which is a more intelligent technique than used elsewhere in determining how many draws to use, which may partly explain these conflicting results.
this paper, there still remains a minimum number of draws that must be used when employing Gaussian quadrature methods. No such limits exist for the other methods. It appears however, that for a given level of accuracy involving designs with large numbers of dimensions, the number of draws required when using Gaussian quadrature methods represents the minimum number of draws, independent of the type of draws taken. As such, whilst the researcher may rely on fewer draws when using say Halton draws, the reduction in the number of draws comes at the price of less accurate results.
One limitation within the research presented here is that we have only examined the case of Bayesian efficient designs assuming the multinomial logit model form. The theory presented in this paper is still valid for other discrete choice models (such as nested logit and mixed logit). Whilst we would expect the results to hold for these other models, this is still to be confirmed. An interesting case to examine is the mixed logit model, whereby simulation is required not only for the Bayesian prior distributions, but also the random parameter distributions as well. Sándor and Wedel (2002, 2005) do report results for Bayesian efficient designs developed using mixed logit models, adopting a quasi random Monte Carlo approach; orthogonal array-based Latin hypercube sampling, and randomly shifted good lattice points, respectively. They report in a footnote (Sándor and Wedel 2005) that some exploration of the number of draws was undertaken but we call for a more structured examination of the issue, similar to that presented here.
Additionally, the analyses presented only consider Normal distributions for the prior parameters. Additional research is required to investigate the impact of the different approximation methods when other probability distributions are assumed.
Acknowledgments
We would like to thank Andrew Collins for his work on the Ngene software, and Fabian Bastin for his help in creating the Sobol sequences. Furthermore, we would like to thank the three anonymous reviewers for their detailed comments that helped improving this paper.
Appendix A. Deriving the asymptotic (co)variance matrix
Consider an experimental design with alternatives (indexed by j) with associated
attributes (indexed by k). In each choice situation ,s we assume that the levels of the attributes are given by xjks. Let the utility of alternative j in choice situation s be given by
,
js js js
U =V +ε (13)
where Vjs denotes the systematic (sometimes called observed) part of utility and
js
ε denotes the random (unobserved) part.
Denote the complete experimental design by X ≡[xjks]. Let the observed utility of
( | ) ,
j
js k jks
k K V X b b x
∈
=
∑
(14)where [ ]b≡ bk denotes the vector of attribute weights, which are typically the
unknown parameters to be estimated. Depending on the set of attributes appearing in each alternative Kj, both generic and alternative-specific weights can be present. In
the generic case, parameter bk appears in multiple utility functions of different
alternatives, while in the alternative-specific case, the parameter only appears in the corresponding alternative.
Let Pjs(X b| ) denote the probability of choosing alternative j in choice situation s,
and let yjs denote the outcome of the stated choice experiment based on the
experimental design (assuming a single respondent), where yjs equals one if
alternative j is chosen in choice situation s, and zero otherwise. The log-likelihood function can be written as
( | ) jslog js( | ) .
s j
L b X =
∑∑
y ⎡⎣P X b ⎤⎦ (15)Assuming that β are the true parameter values, the Fisher information matrix can be
written as
2
( | )
( | ) .
'
L X
I X
b b β β =∂
∂ ∂ (16)
The asymptotic variance-covariance (AVC) matrix can be computed as the negative inverse of the Fisher information matrix:
1
( |β X) I− ( |β X)
Ω = − (17)
The probability Pjs(X b| ) depends on the assumptions regarding the unobserved
components εjs. Different assumptions yield different models (see Train 2003). Only
the probabilities differ (as well as how they are obtained) and as such the theories presented within this paper therefore hold for each of these models.
Appendix B. Experimental designs
The designs used in this paper are D-efficient designs9 using fixed priors created using
the Ngene10 software. As an example, the syntax for generating the design for model
M2 is given below. It generates a D-efficient design for the specified MNL model with six choice situations. The prior parameter values are given between brackets for each parameter b and the attribute levels are given between brackets for each attribute
9
Not necessarily D-optimal designs in the sense that it may not be possible to determine the most efficient designs, but merely designs that are as efficient as possible.
10
x. Note that b1 and b2 are generic since they have the same name in both utility functions for the two alternatives, while b0, b3 and b4 are alternative-specific. Tables B.1 through B.6 list the experimental designs used for the analyses in the paper.
Design
;alts = alt1, alt2
;rows = 6
;eff = (mnl,d)
;model:
U(alt1) = b0[1.2] + b1[-0.09]*x1[0,20,30] + b2[-0.3]*x2[1,3,5] + b3[0.5]*x3[2,4,6] /
U(alt2) = b1 *x1 + b2 *x2 + b4[0.8]*x4[2,4,6]
[image:24.595.89.211.269.381.2]$
Table B.1: Experimental design D1 (for model M1)
s x11 x12 x21 x22
1 20 3 10 1 2 20 1 20 3 3 30 5 30 1 4 30 1 10 5 5 10 3 20 3 6 10 5 30 5
D-error (α =0) = 0.029186
Bayesian D-error (α =0.1) = 0.029352 Bayesian D-error (α =0.3) = 0.030671
Table B.2: Experimental design D2 (for model M2)
s x01 x11 x12 x13 x21 x22 x23
1 1 10 3 6 30 3 6 2 1 30 5 6 20 1 2 3 1 20 1 4 20 5 6 4 1 30 3 4 10 3 4 5 1 20 1 2 10 5 2 6 1 10 5 2 30 1 4
D-error (α =0) = 0.093658
[image:24.595.88.264.457.581.2]Table B.3: Experimental design D3 (for model M3)
s x01 x11 x12 x13 x02 x21 x22 x23 x31 x32 x33 x34
1 1 30 1 6 1 10 3 2 10 5 3 6
2 1 10 5 2 1 20 1 2 30 1 3 4
3 1 10 1 2 1 30 5 6 30 3 5 4
4 1 10 5 6 1 30 1 6 20 3 5 4
5 1 20 3 2 1 10 1 2 30 5 7 6
6 1 20 1 4 1 20 3 4 10 5 3 8
7 1 30 3 6 1 20 5 4 10 1 5 2
8 1 30 5 4 1 30 5 4 10 1 7 2
9 1 30 1 2 1 10 3 2 20 3 5 2
10 1 20 3 4 1 10 5 6 20 1 3 8
11 1 20 5 4 1 30 1 6 20 5 7 6
12 1 10 3 6 1 20 3 4 30 3 7 8
D-error (α =0) = 0.056300
Bayesian D-error (α =0.1) = 0.059608 Bayesian D-error (α =0.3) = 0.086397
Table B.4: Experimental design D4 (for model M4) *
s x01 x11 x12 x13 x14 x02 x21 x22 x23 (1) 24
x x31 x32 x33 x34
1 1 20 5 4 7 1 10 1 2 1 30 3 3 8
2 1 10 3 4 4 1 30 1 6 0 10 5 5 4
3 1 10 5 2 7 1 30 5 4 1 10 1 3 4
4 1 30 1 6 4 1 20 5 4 0 20 1 7 2
5 1 10 3 2 7 1 20 3 2 0 30 3 7 6
6 1 20 1 2 10 1 10 5 6 0 30 3 5 6
7 1 30 5 4 7 1 10 3 2 1 20 1 7 2
8 1 30 3 6 10 1 20 5 6 1 20 1 3 6
9 1 20 3 4 10 1 30 1 6 1 10 5 7 8
10 1 30 5 6 10 1 10 1 4 0 20 3 5 4
11 1 10 1 6 4 1 30 3 4 1 30 5 5 8
12 1 20 1 2 4 1 20 3 2 0 10 5 3 2
D-error (α =0) = 0.096534
Table B.5: Experimental design D5 (for model M5) *
s x01 x11 x12 x14 (1) 15
x x15(2) x02 x21 x22 x25(1) x25(2) x26(1) x31 x32 x33 x35(1)
1 1 10 5 7 0 0 1 20 1 0 0 1 10 5 5 0
2 1 10 3 4 0 1 1 30 5 1 0 0 30 3 7 0
3 1 20 1 10 0 0 1 10 3 0 0 1 20 3 5 1
4 1 30 5 4 1 0 1 30 1 0 1 0 10 5 3 0
5 1 20 3 4 0 1 1 30 3 0 0 0 20 5 3 1
6 1 20 1 7 1 0 1 30 1 1 0 1 10 5 7 1
7 1 10 1 4 1 0 1 20 5 0 0 1 30 5 5 1
8 1 10 3 7 0 0 1 30 1 0 1 1 30 3 7 0
9 1 30 5 10 0 0 1 30 3 0 1 0 20 3 7 1
10 1 30 1 10 0 1 1 20 3 0 1 1 20 3 5 1
11 1 20 5 10 0 1 1 20 1 1 0 1 30 1 5 0
12 1 20 3 10 1 0 1 10 5 0 1 1 10 1 7 0
13 1 20 3 7 0 0 1 10 5 1 0 0 20 3 3 0
14 1 30 5 10 1 0 1 20 1 1 0 0 30 1 3 1
15 1 30 5 7 0 1 1 10 3 0 0 0 20 5 5 0
16 1 10 1 7 0 0 1 10 3 0 0 0 10 1 3 1
17 1 10 3 4 1 0 1 10 5 0 1 0 30 1 7 1
18 1 30 1 4 0 1 1 20 5 1 0 1 10 1 3 0
D-error (α =0) = 0.28606
Bayesian D-error (α =0.1) = 0.49787 Bayesian D-error (α =0.3) = 0.63800
* Attributes x15 and x25 are dummy-coded with 3 levels, x26 and x35 with 2 levels.
Table B.6: Experimental design D6 (for model M6) *
s x01 x11 x12 x14 (1) 15
x x15(2) x16 x02 x21 x22 x(1)25 x25(2) x26(1) x27 x28 x31 x32 x33 x35(1) x36
1 1 10 3 10 0 0 5 1 10 3 1 0 1 5 1 10 1 7 1 10
2 1 20 5 7 0 1 10 1 10 3 0 1 1 5 2 10 1 5 1 10
3 1 20 3 7 0 0 5 1 20 1 0 1 0 10 3 10 5 3 1 5
4 1 20 3 7 1 0 10 1 10 5 1 0 1 15 1 20 1 7 0 5
5 1 10 5 4 0 0 5 1 10 3 0 0 0 5 1 10 3 3 0 15
6 1 10 3 10 0 0 15 1 20 1 0 1 1 15 1 30 3 5 0 10
7 1 10 3 4 0 1 15 1 20 5 1 0 1 15 2 30 3 5 1 5
8 1 20 1 4 0 1 15 1 30 3 0 1 0 15 2 20 5 3 1 15
9 1 20 1 4 0 1 10 1 30 5 1 0 0 5 3 30 3 7 0 10
10 1 30 1 10 1 0 15 1 30 5 0 1 1 5 2 20 1 5 0 15
11 1 10 5 4 0 1 10 1 20 3 0 0 1 15 3 30 3 7 0 5
12 1 30 1 7 1 0 15 1 30 1 0 0 0 10 2 20 5 3 1 15
13 1 30 3 7 1 0 5 1 30 1 1 0 0 15 2 10 5 5 1 5
14 1 30 5 10 0 0 5 1 10 1 0 1 0 5 1 10 5 7 0 10
15 1 10 1 4 1 0 10 1 20 3 0 0 1 10 3 30 1 3 1 15
16 1 30 5 10 0 1 10 1 10 1 0 0 0 10 3 30 5 7 1 10
17 1 30 5 10 1 0 5 1 30 5 1 0 1 10 3 20 1 5 0 15
18 1 20 1 7 0 0 15 1 20 5 0 0 0 10 1 20 3 3 0 5
D-error (α =0) = 0.26361
Bayesian D-error (α =0.1) = 0.27163 Bayesian D-error (α =0.3) = 0.33554