A dissertation on
EXPRESSION OF E-CADHERIN AND VIMENTIN IN ORAL SQUAMOUS CELL CARCINOMA AND ITS CORRELATION
WITH GRADING AND NODAL METASTASIS
Dissertation Submitted in
in partial fulfilment of the regulations required for the award of M.D.DEGREE IN PATHOLOGY - BRANCH III
THE TAMILNADU
Dr.M.G.R. MEDICAL UNIVERSITY CHENNAI
DECLARATION
I hereby declare that the dissertation entitled “EXPRESSION OF E-CADHERIN AND VIMENTIN IN ORAL SQUAMOUS CELL
CARCINOMA AND ITS CORRELATION WITH GRADING AND NODAL METASTASIS” is a bonafide research work done by me in the Department of Pathology, Coimbatore Medical College during the period from January 2017 to May 2018 under the guidance and supervision of Dr.B.Sudha,M.D., Senior Assistant Professor, Department of Pathology, Coimbatore Medical College.
This dissertation is submitted to the Tamilnadu Dr.M.G.R Medical University, Chennai towards the partial fulfilment of the requirement for the award of M.D. Degree (Branch III) in Pathology. I have not submitted this dissertation on any previous occasion to any university for the award of any Degree.
CERTIFICATE
This is to certify that this dissertation entitled “ EXPRESSION OF E-CADHERIN AND VIMENTIN IN ORAL SQUAMOUS CELL CARCINOMA AND ITS CORRELATION WITH GRADING AND NODAL METASTASIS” is a record of bonafide work done by DR.VIGNESWARI.R, a postgraduate student in the Department of Pathology, Coimbatore Medical College, Coimbatore under guidance and supervision of Dr.B.SUDHA,M.D., Senior Assistant Professor, Department of Pathology, Coimbatore Medical College, Coimbatore in partial fulfilment of the requirements for the award of M.D. Degree in Pathology(Branch III) by the Tamilnadu Dr.M.G.R Medical University, Chennai.
Guide Head of the Department Dr.B. Sudha, M.D., Dr.C.Lalitha,M.D., Senior Assistant Professor, Professor,
Department of Pathology, Department of Pathology, Coimbatore Medical College, Coimbatore Medical College, Coimbatore. Coimbatore.
Dr.B. Asokan, M.S., M.ch., Dean,
ACKNOWLEDGEMENT
I express my deep gratitude to Dr.B.Asokan,M.S,M.ch., Dean, Coimbatore Medical College, for granting me permission to undertake this study.
I profusely thank and express my sincere gratitude to Dr.C.Lalitha,M.D., Professor and Head, Department of Pathology, Coimbatore Medical College, for having rendered her valuable support and encouragement without which this project work would have not been feasible.
I express my heartful thanks to Dr.B.Sudha,M.D., Senior Assistant Professor, Department of Pathology, Coimbatore Medical College, for having suggested this topic for dissertation, for her scholarly guidance, valuable advice throughout the course of this study.
I also wish to record my sincere thanks to all Associate Professors and Assistant Professors of the Department of Pathology, Coimbatore Medical College, for their constant support and encouragement throughout the work.
Also, I am indebted to my parents, my husband Dr.K.Gopalakrishnan,M.D., and colleagues for their moral support during this tenure. Last but not the least, I profusely thank all the patients from whom tissues were taken for the study.
PLAGIARISM CERTIFICATE
This is to certify that this dissertation work titled “EXPRESSION OF E-CADHERIN AND VIMENTIN IN ORAL SQUAMOUS CELL CARCINOMA AND ITS CORRELATION WITH GRADING AND NODAL METASTASIS” of the candidate R.Vigneswari with registration number 201613257 for the award of M.D degree in the branch of PATHOLOGY. I personally verified the urkund.com website for the purpose of plagiarism check. I found that the uploaded thesis file contains from introduction to conclusion pages and result shows 11 percentage of plagiarism in the dissertation.
TABLE OF CONTENTS
SL.NO TITLES PAGE.NO
1 INTRODUCTION 1
2 AIM OF THE STUDY 4
3 NEED FOR THE STUDY 5
4 REVIEW OF LITERATURE 6
5 MATERIALS AND METHODS 46
6 OBSERVATION AND RESULTS 55
7 DISCUSSION 83
8 SUMMARY AND CONCLUSION 90
9 BIBLIOGRAPHY 92
10 ANNEXURES
ANNEXURE I : PROFORMA
ANNEXURE II : MASTER CHART ANNEXURE III : LIST OF
LIST OF TABLES
SL.NO TITLES PAGE.NO
1. Mean age of the study 55
2. Demographics of the population based on age 55 3. Demographics of the population based on gender 56 4. Clinical and histopathological characteristics 57 5. Distribution of tumour within oral cavity 59
6. Histopathological grade of tumour 61
7. Scoring of molecular marker E-Cadherin and Vimentin in Oral squamous cell carcinoma
62
8. Immunoreactivity of E-cadherin in patients with Oral squamous cell carcinoma
65
9. Immunoreactivity of Vimentin in patients with Oral squamous cell carcinoma
66
10. Expression of E-cadherin in Oral squamous cell carcinoma in correlation with histological grade of tumour
67
11. Expression of E-cadherin in Oral squamous cell carcinoma in relation to nodal metastasis
68
12. Expression of Vimentin in Oral squamous cell carcinoma with correlation to histopathological grade of tumour
SL.NO TITLES PAGE.NO 13. Expression of Vimentin in Oral squamous cell
carcinoma in relation to nodal metastasis
70
14. Expression of E-cadherin and Vimentin in relation to histopathological grade in patients with nodal metastasis
71
15. Expression of E-cadherin and Vimentin in relation to histopathological grade in patients without nodal metastasis
LIST OF CHARTS
SL.NO TITLES PAGE.NO
1. Age distribution of the population included in the study
55
2. Gender distribution of the patients with Oral squamous cell carcinoma
56
3. Site of tumour within oral cavity 60
4. Histopathological grade of tumour included in the study
61
5. Immunoreactivity of E-cadherin in Oral squamous cell carcinoma
65
6. Immunoreactivity of Vimentin in Oral squamous cell carcinoma
66
7. Expression of E-cadherin in relation to histopathological grade of tumour
67
8. Expression of E-cadherin in relation to nodal metastasis
68
9. Vimentin expression in relation to grade of tumour 69
10. Vimentin expression in relation with nodal metastasis 70 11. Expression of E-cadherin and Vimentin in relation to
histopathological grade in patients with nodal metastasis
71
12. Expression of E-cadherin and Vimentin in relation to histopathological grade in patients without nodal metastasis.
LIST OF COLOUR PLATES
SL.NO TITLES
1. H & E stained section of normal oral squamous epithelium 2. E-Cadherin immunostaining in normal oral squamous
epithelium
3. Vimentin immunostaining in normal oral squamous epithelium
4. H & E stained section of Well differentiated Squamous cell carcinoma
5. High immunoreactivity of E-Cadherin in Well differentiated Squamous cell carcinoma
6. Negative immunoreactivity of Vimentin in Well differentiated Squamous cell carcinoma
7. High immunoreactivity of E-Cadherin in Well differentiated tumour with nodal metastasis
8. High immunoreactivity of Vimentin in Well differentiated tumour with nodal metastasis
9. H & E stained section of Moderately differentiated Squamous cell carcinoma
10. E-Cadherin immunostaining with high immunoreactivity in moderately differentiated tumour
12. High immunoreactivity of E-Cadherin in moderately differentiated tumour with nodal metastasis
13. High immunoreactivity of Vimentin in moderately differentiated tumour with nodal metastasis
14. H & E stained section of Poorly differentiated Squamous cell carcinoma
15. Low immunoreactivity of E-Cadherin in Poorly differentiated tumour with nodal metastasis
1
INTRODUCTION
Oral cancer constitutes the sixth most prevalent cancer worldwide but ranks third in developing world and eighth in developed countries.1 Oral cancer accounts for 5% of all cancers in men and 2% in women. Approximately 94% of all oral malignancies are Squamous cell carcinoma. In recent years, there is increase in incidence rates and mortality particularly in young adults as an outcome of this disease.2
Despite great improvement in adjunctive therapy and surgical treatment, 5-year survival rate of oral cancer has not improved over past few decades.3-5
Most important cause for poor survival rate is local or regional relapse and cervical lymph node metastasis. If reliable biomarker could be identified to predict metastasis and prognosis, it would aid in selection of definitive treatment strategy and could improve survival.
2
understand cancer progression and metastasis that would help in selecting more selective and suitable treatment for cancer.
Studies of epithelial malignancies have shown that loss of epithelial morphology and acquisition of mesenchymal characteristics termed as Epithelial mesenchymal transition (EMT) are typical for carcinoma cells and correlate with invasiveness and metastatic potential of tumour. Cells proceeding EMT exhibit down-regulation of epithelial markers such as E-cadherin and upregulation of mesenchymal markers such as Vimentin.8-10
E-cadherin is a calcium dependent transmembrane glycoprotein located in epithelial tissue responsible for cell-cell adhesion and plays role in establishing cell polarity and normal tissue architecture.11 Loss of E-cadherin expression increases the mobility of epithelial cells and its ability for local invasion.
3
4
AIM OF THE STUDY
1) To Study the expression of immunohistochemical marker E-Cadherin in Oral Squamous cell carcinoma.
2) To Study the expression of immunohistochemical marker Vimentin in Oral Squamous cell carcinoma.
3) To Correlate E-Cadherin and Vimentin expression with histopathological grade of Oral squamous cell carcinoma.
5
NEED FOR THE STUDY
1. Epithelial mesenchymal transition (EMT) is being established as a known factor for the occurrence of metastasis and the reason for death in the patients with Oral squamous cell carcinoma. Hence analysis of E-Cadherin and Vimentin that indicates EMT is the need of the hour to predict the occurrence of metastasis in these patients.
2. As the grading of Oral squamous cell carcinoma increases, there are more chances of metastasis in these patients. The addition of immunohistochemical markers E-Cadherin and Vimentin would be helpful in eliminating the subjective bias in grading and making it as an objective finding in this era of evidence-based medicine.
6
REVIEW OF LITERATURE
INCIDENCE OF ORAL SCC:
Head and neck squamous cell carcinoma accounts for 6,50,000 new cases annually. Oral squamous cell carcinoma accounts for more than 90% of total head and neck carcinoma.
In India, Oral squamous cell carcinoma accounts for 9.4 percent of all cancers with an incidence of 12.6 per lakh population.14 50 -70% of total cancer mortality in India occurs due to oral squamous cell carcinoma.In India, 5 people die every hour because of oral cancer.15
Despite advances in treatment including radiotherapy, chemotherapy and surgery the overall long-term survival is less than 50%. Decrease in long term survival is because most of the oral cancer is detected only at an advanced stage.
AGE DISTRIBUTION:
7
Although primarily a disease of the middle and older age groups, younger population presenting with Oral Squamous Cell Carcinoma has increased in recent years.
The etiological factors associated with Oral cancer in this age group is attributed to alteration in behavioural and lifestyle patterns.
GENDER DISTRIBUTION:
Men are affected two to four times more than women because of heavier indulgence in both tobacco and alcohol habits in most countries.
In India, the highest rates of intraoral cancer may be found in women who chew tobacco heavily.
LOCATION:
The frequency of occurrence of squamous cell carcinomas within the oral cavity are as follows: lip, 45%; tongue, 16%; floor of mouth, 12%; buccal mucosa, 10%; lower gingiva, 12%; upper gingiva and hard palate, 5%. Of the lip tumours, over 90% involve the lower lip.
ETIOLOGY:
8
smoking and oral cancer has been established firmly by epidemiological studies.16
Another major risk factor for Oral cancer is the consumption of alcohol. Persons who smoke and drink have 10 times greater risk of developing oral cancer than who do not smoke, and drink.17,18 Other risk factors are betel quid chewing and marijuana use.
Human Papilloma virus (HPV)19 and Herpes simplex virus (HSV) have been established as causative agents in recent years. Candida also plays a role in initiation of Oral cancer. Poor oral hygiene and prolonged irritation from sharp teeth have also been viewed for their possible role in the development.20
MOLECULAR PATHOGENESIS OF ORAL SCC:
9
proliferation, with loss of cell cohesion, and the ability to infiltrate local tissue and spread to distant sites.
Specific genetic alterations have been identified in oral squamous cell carcinoma and precancerous lesions of oral cavity.22,23 Genetic alterations that occur during carcinogenesis includes point mutations, amplifications, rearrangements, and deletions. Point mutations (single base changes) in K-ras and p53 genes leads to overactivity or inactivity of gene products. Amplification and rearrangement affect excitatory pathway genes, whereas rearrangement can also inactivate inhibitory pathway genes.
10
imbalance which was present in initial lesion has increased as the carcinoma developed.
Inactivation of protein product p16INK4 by deletion and mutation in cyclin dependent kinase inhibitor 2/multiple tumour suppressor gene 1 (CDKN2/MTSI) mapped to chromosome 9p21-22 has been found in 33% of Oral Squamous Cell carcinoma. p16INK4 binds to and inhibits phosphorylation of pRb by cyclin dependent kinases CDK4 and CDK6.28,29
Aberrant expression of proto oncogene epidermal growth factor receptor (EGFR/c-erb 1), c-myc, int-2, members of the ras gene family,hst-1, PRAD-1, and bcl-1 also contribute towards cancer development.30 Aberrant expression of transformation growth factor α
(TGF-α) is reported to occur that stimulate cell proliferation by binding to
EGFR in an autocrine and paracrine fashion. 23
EGFR, the biological receptor of EGF and TGF- α is
11
[image:26.595.127.510.181.588.2]degree of differentiation.31 Oral squamous carcinomas overexpressing EGFR exhibit a greater response to chemotherapy, when compared with EGFR negative tumours.32
Figure 1: Progression model of multistep oral carcinogenesis.
12
cancer. These genes encode protein p21 that transmits mitogenic signals by binding GTP. The mitogenic signal is terminated by conversion of GTP to GDP by hydrolysis .When the ras oncogene gets mutated, this conversion is prevented, leading to continuous stimulation.33 C-Myc is overexpressed as a result of gene amplification in oral cancer.
C-Myc requires p53 for apoptosis and the retinoblastoma tumour suppressor gene Rb-1 nuclear protein pR6 interacts with c-myc gene, preventing its transcription, and thus inhibiting cell proliferation. However, when phosphorylation of pR6 occurs, c-Myc is increased and cell proliferation proceeds.34
The PRAD-1 gene on chromosome 11q13 encodes Cyclin D1, that together with Rb gene product controls the cell cycle in G1 to S transition. This gene is amplified in 30-50% of Oral cancers. Amplification of PRAD-1 is correlated with cytological grade, infiltrative growth and metastases.35,36 Co amplification of the int-2 and hst-1 genes that encodes a protein similar to fibroblast growth factor is associated with tumour recurrence and progression.37,38
13
have been associated with mutation of p53 gene in Oral cancer. Activated STAT3 levels is elevated in oral cancer via up-regulation of the Jak, Src, EGFR, TGF-α, or interleukin-6 (IL-6) signalling pathways. In poorly differentiated oral cancers activated STAT3 is highly expressed and is correlated with metastasis. Loss of heterozygosity with mutation of the adenomatous polyposis coli ( APC) tumour suppressor gene has been detected in 25% of Oral cancers.40
FIELD CANCERISATION:
14
EPITHELIAL MESENCHYMAL TRANSITION IN ORAL
SQUAMOUS CELL CARCINOMA:
The concept of epithelial and mesenchymal transition (EMT) was first proposed by Greenberg et al. Epithelial mesenchymal transition is a biological process in which an epithelial cell undergoes biologic metamorphosis to a mesenchymal phenotype to acquire increased resistance to apoptosis, improved migratory capacity, invasiveness and increased production of extracellular matrix components. The hallmark sign is the transformation of cohesive and polarized epithelial cells into mesenchymal-like cells that exhibit no polarization and high mobility. The completion of EMT is signalled by the degradation of underlying basement membrane and formation of a mesenchymal cell that migrate away from the epithelial layer in which it originated.
15
Figure 2: Epithelial mesenchymal transition
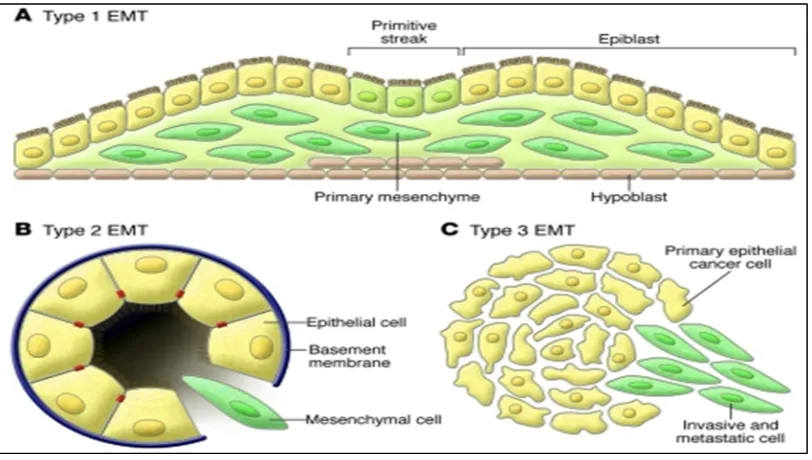
The phenomenon of Epithelial mesenchymal transition is divided into 3 types.43
Type 1 EMT: Type 1 EMT occurs during implantation, embryogenesis and development. The primitive epithelium, the epiblast gives rise to mesenchyme via an EMT. This mesenchyme is reinduced to form secondary epithelia by a MET (Mesenchymal epithelial transition). It is speculated that such secondary epithelia further differentiate to form other types of epithelial tissues and undergo subsequent EMT to generate cells of connective tissue such as astrocytes, adipocytes, chondrocytes, osteoblasts and muscle cells.
16
[image:31.595.114.520.212.442.2]Type 3 EMT: This type is associated with cancer progression and metastasis. The Secondary epithelia associated with many organs transform into cancer cells that later undergo the EMT that enable invasion and metastasis.
Figure 3: Different types of Epithelial mesenchymal transition
Many studies and experiments demonstrated that carcinomatous cells acquire mesenchymal phenotype and express mesenchymal markers
17
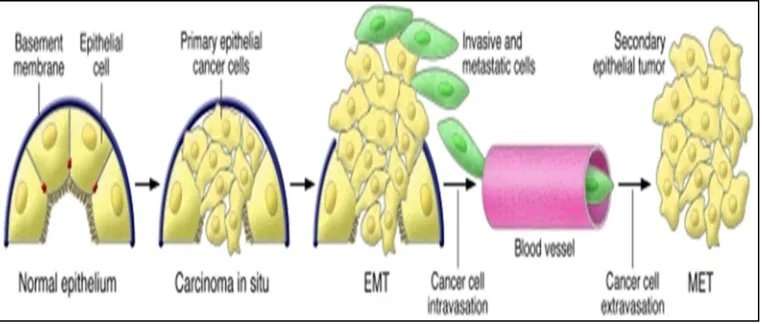
Figure 4: Contribution of EMT in cancer progression.
EMT-inducing signals from the tumour-associated stroma such as HGF, EGF, PDGF, and TGF-β are responsible for induction or functional
activation in cancer cells of a EMT-inducing transcription factors such as Snail, Slug, Twist, zinc finger E-box binding homeobox 1(ZEB1), Goosecoid, and FOXC2.48 The implementation of EMT program also depends on intracellular signalling networks involving Smads, RhoB,
18
proteins, which mediate TGF-β action to induce EMT via the ALK-5 receptor.
In oral squamous cell carcinoma epithelial markers such as E-cadherin, cytokeratin, Claudine, desmoplakin, beta keratin were down
regulated and mesenchymal markers such as N-cadherin, vimentin, fibronectin, and snail-1/2 were up regulated by the process of EMT.
ROLE OF E- CADHERIN :
E-cadherin (Epithelial-cadherin), a calcium-dependent transmembrane glycoprotein of the type-1 cadherin family, is an important cell adhesion molecule and signal transduction factor in epithelial cells. It is encoded by the CDH1 gene that is located on chromosome 16q-22.1. It was first identified in chicken and was called originally as L-CAM.50 E-cadherin is expressed at a very early two cell stage in embryogenesis where it plays an important role in adhesion of blastomeres.51,52
19
Figure 5:Role of E-cadherin in invasion and metastasis of tumour cells
In normal cells, E-cadherin exerts its tumour suppressing role
mainly by sequestering β-catenin from its binding to LEF( Lymphoid enhancer factor)/ TCF (T cell factor). β-catenin serves the function of transcribing genes of the proliferative Wnt signalling pathway.
20
alterations that reduce cadherin expression includes promoter methylation, histone modifications and interplay of both that condenses chromatin conformation, limiting access to cis regulatory transcription factors, that control morphogenesis. MicroRNA ( miRNA) dysregulation was discovered recently that play a part in epigenetic control of E-cadherin expression in cancer cells by targeting its multiple transcription regulators such as Snail 1, ZEB 1 and ZEB 2.
E cadherin as a tumour suppressor gene sets a threshold for Wnt/β -catenin signalling. When expression of E-cadherin is lost, potentiation of Wnt signalling pathway occurs leading to loss of cell-cell adhesion53. It is also postulated that blocking cadherin function causes decrease in receptor affinity of EGF-R and increased the surface mobility of EGF-R.
ROLE OF VIMENTIN
21
induce several important features of EMT, including adoption of mesenchymal shape and increased motility by participating in signal transduction.
The epithelial cells expressing vimentin undergo flattening that facilitate these cells to withstand a variety of mechanical forces. This may be the critical factor for survival of metastatic cells when exposed to abnormal physical stress as they navigate from primary to secondary tumour sites.54, 55
22
HISTOPATHOLOGY OF ORAL SQUAMOUS CELL CARCINOMA:
OSCC is a malignant neoplasm derived from the stratified squamous epithelium of the oral mucosa57. SCC can be ulcerative, papillary, flat or exophytic in growth. It ranges from minute mucosal thickenings to large masses that fills the luminal spaces.
During the process of carcinogenesis, the epithelium undergoes reactive epithelial changes such as hyperkeratosis, hyperplasia and acanthosis or preneoplastic changes (including mild, moderate and severe dysplasia) prior to the development of an invasive carcinoma . The precancerous lesions that progress to SCC are erythroplakia, leucoplakia, actinic cheilitis, lichen planus, sideropenic dysphagia, submucous fibrosis, dyskeratosis congenita, discoid lupus erythematosus.
The characteristic dysplastic features are;
1. Drop shaped rete pegs
2. Loss of cellular adhesion and cohesion
3. Disturbed polarity of basal cells
23
5. Irregular epithelial stratification or disturbed maturational sequence
6. Abnormal intraepithelial keratinization
7. Cellular pleomorphism/anisocytosis
8. Increase in nuclear cytoplasmic ratio
9. Nuclear hyperchromatism
10. Prominent nucleoli
11. Increased mitosis and abnormal mitosis .58,59,60
Conventional squamous cell carcinoma is composed of variable degrees of squamous differentiation and basement membrane violation by nests of tumour cells. In addition to the above-mentioned dysplastic features, malignant epithelial cells show keratin pearls and intercellular bridges. Inflammatory infiltrate (usually of lymphocytes and plasma cells) is seen at the tumour stroma junction, along with dense, desmoplastic fibrous stroma.
24 GRADING SYSTEMS
In 1920, Border developed a quantitative grading of 4 categories based on degree of differentiation. Jakobson et al developed a multifactorial grading system which was later modified by Anneroth and Hansen for application to squamous cell carcinoma of tongue and floor of mouth.
Border’s grading system
Grade I: Well differentiated = <25% of undifferentiated cells
Grade II: Moderately differentiated =25-50% of undifferentiated cells
Grade III: Poorly differentiated =50-75% of undifferentiated cells
Grade IV: Anaplastic or pleomorphic =>75% of undifferentiated cells
Anneroth grading included six parameters such as degree of keratinization, nuclear pleomorphism, number of mitosis, pattern of invasion, stage of invasion, lympho-plasmocytic infiltration.
25
invasive tumour front grading system gave prognosis better than other areas of tumour.
According to WHO grading system, 3 categories are recommended :
Well differentiated,
Moderately differentiated and
Poorly differentiated.
It depends on assessment of keratinisation, pleomorphism and mitotic activity.
VARIANTS OF SQUAMOUS CELL CARCINOMA:
VERRUCOUS SQUAMOUS CELL CARCINOMA (ACKERMAN’S TUMOR):
Verrucous carcinoma comprises about 3% of all SCC. It is more common among older women. Active pathogenetic role has been ascribed to human papilloma virus. Grossly it appears as a broad-based, warty, exophytic or fungating, bulky, firm to hard, tan or white mass measuring up to 10cm in greatest dimension. They may show surface ulceration.
26
filiform projections lined by well-differentiated squamous epithelium. The advancing margins of tumour are broad or bulbous rete pegs with pushing rather than infiltrative appearance and dense inflammation in adjacent tissues. There is an orderly maturation of cells towards the surface, with abundant surface keratosis called ‘church-spire Keratosis. Parakeratotic crypting is a common feature. Mitotic figures are rare and focal atypia/dysplasia is limited to basal zone if present.
EXOPHYTIC AND PAPILLARY SQUAMOUS CELL CARCINOMA:
27
Two specific histologic growth patterns are identified that separates from conventional SCC. The exophytic pattern is composed of broad based, bulbous to exophytic growth of squamous epithelium. The projections are ‘cauliflower-like’ and are rounded. Central fibrovascular cores are seen on tangential sectioning, but the superficial aspect of growth is lobular and not papillary.
28
SPINDLE CELL ( SARCOMATOID CARCINOMA):
It is also known as Carcinosarcoma, Pseudo sarcoma, Squamous cell carcinoma with pseudo sarcoma, Lane tumour over the years. Spindle cell carcinoma is recognized as biphasic tumour with carcinoma that has surface epithelial changes (dysplasia to invasive carcinoma) and an underlying spindle-shaped neoplastic proliferation.
29
includes plump fusiform, rounded and epithelioid cells. Opacified, dense, eosinophilic cytoplasm give a hint of squamous differentiation.
BASALOID SQUAMOUS CELL CARCINOMA:
Basaloid squamous cell carcinoma is a high-grade variant of squamous cell carcinoma. It affects men in seventh decade of life with frequent cervical lymph node metastasis. Grossly they present as exophytic to nodular masses measuring up to 6 cm in greatest dimension. They are firm to hard and associated with central necrosis.
Histologically, the infiltrating tumour shows a variety of growth patterns, such as solid, lobular, cribriform, cords, trabeculae, nests and glands or cysts. Surface ulceration is frequently noted. Basaloid component is defined by features that includes
1) Solid growth of cells in a lobular configuration with peripheral palisading, closely associated with or involving surface mucosa.
2) Individual cells are small, crowded with scant cytoplasm having dark hyperchromatic nuclei without nucleoli.
30
The lobules often contain central necrosis with visible necrotic material. Sometimes the necrotic material completely "drops out," giving a pseudo glandular appearance . These basaloid regions are in direct continuity with areas of squamous differentiation, including abrupt keratinization in the form of squamous pearls, individual cell keratinization, etc.70
ADENOSQUAMOUS CARCINOMA:
Adenosquamous carcinoma is a high-grade variant of squamous cell carcinoma with admixture of both squamous cell carcinoma and adenocarcinoma. They often present as an indurated submucosal nodule ranging in size from less than 1 cm to 5 cm in maximum dimension. Most patients present with lymph node metastasis. Any two of the following squamous features are mandatory:
1) Intercellular bridging
2) Keratin pearl formation
3) Parakeratotic differentiation
4) Individual cell keratinization
31
The adenocarcinoma component can be tubular, alveolar and/or glandular. The cells in adenocarcinoma can also be basaloid. The glandular epithelium requires the demonstration of intracytoplasmic sialomucin by high iron diamine alcian blue or PAS stain retention after diastase digestion or Mayer’s mucicarmine.
The tumour cells were of the three basic types:
1) Basaloid cells
2) Squamous cells
3) Undifferentiated cells.
The malignant cells usually demonstrate frequent mitoses, necrosis and infiltration into the surrounding tissue with perineural invasion. There is sparse inflammatory cell infiltrate at the tumour-stromal interface.71-74
SPREAD AND METASTASIS:
32
that usually arise on the lateral surfaces and under surfaces, remain localized for long periods but eventually invade the floor of the mouth and root of the tongue, resulting in fixation of the organ. Tumours of the buccal mucosa invade the underlying muscles and may eventually penetrate the skin. Tumours of gingiva extend quickly into the periosteum, the adjacent buccal mucosa, and the floor of mouth. Tumours of the hard palate may spread into the underlying bone, but extension into the maxillary antrum is very rare. Tumours of the retromolar trigone spread to adjacent buccal mucosa, anterior tonsillar pillar, maxilla, pterygomandibular space, medial pterygoid muscle, and buccinator muscle.
33 PROGNOSIS:
Following are the prognostic determinants of oral cavity:
1. Location:
The overall 5-year survival rates are about 90% for carcinomas of the lower lip; 60% for tumours of the anterior tongue; 40% for tumours of the posterior tongue, floor of mouth, tonsil, gingiva, and hard palate; and 20–30% for tumours of the soft palate. However, these figures are heavily influenced by tumour stage.82-86
2. Stage:
5-year survival rate of patients with stage I, 91.0%; stage II, 77.2%; stage III, 61.2%; stage IVA, 32.4%; stage IVB, 25.3%; stage IVC, 3.6%.87
3. Grade:
34 4. Depth of invasion:
This is an important factor, in some locations.89 This feature is incorporated into the staging systems.
5. Tumour size:
Size of the tumour does not correlate closely with clinical outcome except in small tumors.90
6. Desmoplastic reaction:
Presence of a florid desmoplastic reaction has been found to be a marker of aggressive behaviour with higher likelihood of metastases.91
7. Tissue eosinophilia:
Intense infiltration of the carcinoma by eosinophils is said to be a favourable prognostic factor.92
8. Lymph node involvement:
35 9. DNA ploidy:
The nondiploid tumours tend to be clinically more advanced than the diploid ones.95 DNA ploidy correlates with the microscopic grade of the tumour and with prognosis.
10. HPV-16:
HPV-16 positivity in squamous cell carcinomas of the oral cavity is a powerful indicator of improved survival.96
11. H antigen:
It has been observed that loss of expression of blood group antigen is associated with a greater tendency for invasiveness and distant spread.97
12. p21 gene:
Overexpression of p21 gene (the product of which is the downstream regulatory protein of TP53) was found to be an unfavourable prognostic factor in lingual squamous cell carcinoma.98
13. 3q26.3 locus:
36 14. TROP2:
Overexpression of this human trophoblast cell-surface antigen has found to be associated with decreased overall survival.100
15. p16:
Overexpression of p16 was found to be a favourable prognostic factor as it is a surrogate marker for high-risk HPV, a known favourable prognostic factor.101
WHO CLASSIFICATION OF ORAL CAVITY AND OROPHARYNX
MALIGNANT EPITHELIAL TUMOURS:
Squamous cell carcinoma
Verrucous carcinoma
Basaloid squamous cell carcinoma Papillary squamous cell carcinoma Spindle cell carcinoma
Acantholytic squamous cell carcinoma Adenosquamous carcinoma
37 EPITHELIAL PRECURSOR LESIONS
BENIGN EPITHELIAL TUMOURS
Papillomas
Squamous cell papilloma and verruca vulgaris
Condyloma acuminatum
Focal epithelial hyperplasia
Granular cell tumour
Keratoacanthoma
SALIVARY GLAND TUMOURS
Salivary gland carcinomas Acinic cell carcinoma
Mucoepidermoid carcinoma Adenoid cystic carcinoma
Polymorphous low-grade adenocarcinoma Basal cell adenocarcinoma
Epithelial-myoepithelial carcinoma
38 Mucinous adenocarcinoma Oncocytic carcinoma
Salivary duct carcinoma Myoepithelial carcinoma
Carcinoma ex pleomorphic adenoma Salivary gland adenomas
Pleomorphic adenoma Myoepithelioma
Basal cell adenoma Canalicular adenoma Duct papilloma Cystadenoma
SOFT TISSUE TUMOURS
Kaposi sarcoma Lymphangioma
Ectomesenchymal chondromyxoid tumour Focal oral mucinosis
39 HAEMATOLYMPHOID TUMOURS
Diffuse large B-cell lymphoma (DLBCL) Mantle cell lymphoma
Follicular lymphoma
Extra nodal marginal zone B-cell lymphoma of MALT type Burkitt lymphoma
T-cell lymphoma (including anaplastic large cell lymphoma ) Extramedullary plasmacytoma
Langerhans cell histiocytosis Extramedullary myeloid sarcoma
Follicular dendritic cell sarcoma / tumour MUCOSAL MALIGNANT MELANOMA
40
TNM CLASSIFICATION OF CARCINOMAS OF THE ORAL
CAVITY AND OROPHARYNX
TNM CLASSIFICATION OF CARCINOMAS OF THE LIP AND ORAL CAVITY
T Primary tumour
TX Primary tumour cannot be assessed
T0 No evidence of primary tumour
Tis Carcinoma in situ
T1 Tumour 2 cm or less in greatest dimension
T2 Tumour more than 2 cm but not more than 4 cm in greatest dimension
T3 Tumour more than 4 cm in greatest dimension
T4a (lip) Tumour invades through cortical bone, inferior alveolar nerve, floor of mouth, or skin (chin or nose)
41
T4b (lip and oral cavity) Tumour invades masticator space, pterygoid plates, or skull base; or encases internal carotid artery
Note: Superficial erosion alone of bone/tooth socket by gingival primary is not sufficient to classify a tumour as T4.
N – Regional lymph nodes##
NX Regional lymph nodes cannot be assessed
N0 No regional lymph node metastasis
N1 Metastasis in a single ipsilateral lymph node, 3 cm or less in greatest dimension
N2 Metastasis as specified in N2a, 2b, 2c below
N2a Metastasis in a single ipsilateral lymph node, more than 3 cm but not more than 6 cm in greatest dimension
N2b Metastasis in multiple ipsilateral lymph nodes, none more than 6 cm in greatest dimension
N2c Metastasis in bilateral or contralateral lymph nodes, none more than 6 cm in greatest dimension
N3 Metastasis in a lymph node more than 6 cm in greatest dimension
42 M Distant metastasis
MX Distant metastasis cannot be assessed
M0 No distant metastasis
M1 Distant metastasis
Stage grouping
Stage 0 Tis,N0,M0
Stage I T1, N0, M0
Stage II T2, N0, M0
Stage III T1/ T2,N1, M0
T3,N0/ N1, M0
Stage IVA T1/ T2/ T3, N2, M0
T4a,N0/N1/N2,M0
Stage IVB Any T, N3, M0
T4b ,Any N, M0
Stage IVC Any T, Any N, M1
43
TNM CLASSIFICATION OF CARCINOMAS OF THE
OROPHARYNX
T Primary tumour
TX Primary tumour cannot be assessed
T0 No evidence of primary tumour
Tis Carcinoma in situ
T1 Tumour 2 cm or less in greatest dimension
T2 Tumour more than 2 cm but not more than 4 cm in greatest dimension
T3 Tumour more than 4 cm in greatest dimension
T4a Tumour invades any of the following: larynx, deep/extrinsic muscle of tongue (genioglossus, hyoglossus, palatoglossus, and styloglossus), medial pterygoid, hard palate, and mandible
T4b Tumour invades any of the following: lateral pterygoid muscle, pterygoid plates, lateral nasopharynx, skull base; or encases the carotid artery
44
NX Regional lymph nodes cannot be assessed
N0 No regional lymph node metastasis
N1 Metastasis in a single ipsilateral lymph node, 3 cm or less in greatest dimension
N2 Metastasis as specified in N2a, 2b, 2c below
N2a Metastasis in a single ipsilateral lymph node, more than 3 cm but not more than 6 cm in greatest dimension
N2b Metastasis in multiple ipsilateral lymph nodes, none more than 6 cm in greatest dimension
N2c Metastasis in bilateral or contralateral lymph nodes, none more than 6cm in greatest dimension
N3 Metastasis in a lymph node more than 6 cm in greatest dimension
Note: Midline nodes are considered ipsilateral nodes.
M Distant metastasis
MX Distant metastasis cannot be assessed
M0 No distant metastasis
45 Stage grouping
Stage 0 Tis, N0, M0
Stage I T1, N0, M0
Stage II T2, N0, M0
Stage III T1/ T2, N1, M0
T3, N0/ N1, M0
Stage IVA T1/ T2/ T3, N2, M0
T4a, N0/ N1/ N2, M0
Stage IVB T4b, Any N, M0
Any T N3 M0
Stage IVC Any T, Any N, M1
46
MATERIALS AND METHODS
STUDY CHARACTERISTICS:
Forty patients with Oral squamous cell carcinoma who attended the outpatient and inpatient department of Coimbatore Medical College Hospital between January 2017 to May 2018 were included in the study. The Immunoexpression of molecular markers ( E-cadherin and Vimentin) were studied in their tissue sections and correlated with degree of differentiation of tumour and its association with cervical lymph node metastasis was analysed.
PATIENT CHARACTERISTICS:
47 SAMPLES:
Of the 40 patients with Oral squamous cell carcinoma , 20 patients presented with cervical lymph node metastasis. Split up of the specimens showed their origin to be 11 from tongue, 7 each from buccal mucosa and tonsillar fossa, 5 from lip, 4 from retromolar trigone, 3 from soft palate, 2 from alveolar margin and 1 from floor of mouth.
For histopathological and immunohistochemical studies the tumour samples were fixed in 10% buffered formalin, processed and then embedded in paraffin. The diagnosis was confirmed by routine histopathological examination using haematoxylin and eosin stain. For immunohistochemical studies, 4 micrometer thick tissue sections were taken in specially coated slides using chrome-alum and gelatin. The tissue sections included not only tumour lesions but also the adjacent non-tumorous oral epithelium in few cases that served as internal controls for immunochemistry.
48 IMMUNOHISTOCHEMISTRY:
PRINCIPLE:
The demonstration of antigen in cells and tissues by immunostaining is a twostep process. First is the binding of antibody to antigen of interest. Second is the detection of bound antibody by one of the varieties of enzyme chromogenic system. In our study we have used “ The Super Sensitive polymer-HRP Detection System” that is based on a non-biotin polymeric technology that makes use of two major components: Super Enhancer and a Poly-HRP reagent. The problems associated with endogenous biotin are eliminated as the system is not based on Biotin-Avidin system. In this technique a large number of peroxidase enzyme molecules are bound to secondary antibody through the dextran backbone. This was done to increase the sensitivity.
SIMPLE PROTOCOL:
1. Application of primary antibody
2. Application of enzyme labelled polymer.
49 REAGENTS USED:
1. Peroxide block: 3% hydrogen peroxide in water.
2. Power block reagent: A highly effective Universal protein blocking reagent. Contains casein and propriety additives in PBS with 15mM sodium azide.
3. Chromogen: DAB-3,3’-diaminobenzidine
4. Liquid DAB substrate: Tris buffer containing peroxide and stabilizers.
5. Super Enhancer Reagent.
6. Poly-HRP Reagent
7. Counterstain: Ehrlich’s Haematoxylin
8. Buffer solutions
TRIS BUFFER ( pH 7.6)
TRIS Buffer salt : 0.605 gm
Sodium chloride : 8 gm
Distilled water : 1000 ml
50 CITRATE BUFFER ( Ph 6.0)
Trisodium citrate : 2.94 gm Distilled water : 1000 ml 1 N Hydrochloric acid : 5 ml TRIS EDTA: (Ph 9.0)
TRIS Buffer salt : 6.05 gm Disodium EDTA : 0.744 gm
Distilled water : 1000 ml
IMMUNOHISTOCHEMISTRY PROCEDURE:
1) Sections were cut at 4 microns, taken in a coated slide & incubated at 58C Overnight.
2) Deparaffinized in Xylene for 30 minutes.
3) Immersed in absolute alcohol for 2 minutes with 2 changes.
4) Washed in tap water for 10 minutes.
5) Rinsed in distilled water for 5 minutes.
51
7) Cooled to room temperature for 20 minutes.
8) Rinsed in distilled water for 5 minutes.
9) Washed in TBS wash buffer for 5 minutes with 2 changes.
10) The Sections were covered with peroxide block for 10 minutes.
11) Washed in TBS wash buffer for 5 minutes with 2 changes.
12) The Sections were covered with power block for 10 minutes.
13) The Sections were drained and covered with primary antibody without washing ( E-Cadherin and Vimentin for 1 hour) and kept in a moisture chamber.
14) Washed in TBS wash buffer 5 minutes with 2 changes.
15) The Sections were covered with Super enhancer for 30 minutes.
16) Washed in TBS wash buffer for 5 minutes with 2 changes.
17) The Sections were covered with S.S label + poly HRP for 30 minutes.
18) Washed in TBS wash buffer for 5 minutes with 2 changes.
19) The Sections were covered with chromogen (DAB + Substrate buffer) for 5 to 8 minutes.
52 21) Washed in tap water for 5 minutes.
22) Counter stained with haematoxylin for 30 seconds.
23) Washed in tap water for 5 minutes.
24) Air dried, Cleaned in Xylene and mounted with DPX mountant.
RESULT: the development of brown colour was interpreted as positive scoring was done using the method mentioned below.
EVALUATION OF IMMUOHISTOCHEMICAL STAINING:
The most representative tumour areas were selected for scoring immunostaining pattern. The scoring was done using light microscopy. The following criteria were used to study the distribution and intensity of positive tumour cell staining. Cell membrane staining was considered as strong positive reaction and Cytoplasmic training as weak positive reaction for E-cadherin. Cytoplasmic staining was considered as positive reaction for Vimentin.
Immunoreactivity for E-cadherin and Vimentin were evaluated based on staining intensity and distribution using immunoreactive score.
53 INTENSITY SCORE :
Intensity score was defined as
SCORE EXPRESSION
0 Negative
1 Weak
2 Moderate
3 Strong
PROPORTION SCORE Proportion score was defined as
SCORE EXPRESSION
0 Negative
1 < 10% of the tumour cells
2 10-20% of the tumour cells
3 20-50% of the tumour cells
54
Immunoreactivity score = Proportion score X Intensity Score
The total score ranged from 0 to 12.
The Immunoreactivity score was divided into three groups on the basis of final score.
TOTAL SCORE IMMUNOREACTIVITY
0 Negative
1 – 4 Low
55
OBSERVATION AND RESULTS
[image:70.595.111.513.234.380.2]RESULTS
Table I: Mean age of the study
N MINIMUM MAXIMUM MEAN±SD
AGE 40 37 70 55.50±8.8
Table II: Demographics of the population based on Age
AGE OF PATIENT NUMBER OF CASES PERCENTAGE
31 – 40 Years 4 10%
41 – 50 Years 8 20%
51 – 60 Years 17 42.5%
61 – 70 Years 11 27.5%
Table II demonstrates the age of patients suffering from oral squamous cell carcinoma included in our study. The youngest age of presentation in our study was 37 years and the eldest was 70 years. Predominant population (42.5%) fall under the age group of 51- 60 years.
CHART I : Chart I shows age distribution of population included in our study
10%
20%
42% 28%
Age distribution
[image:70.595.171.463.503.688.2]56
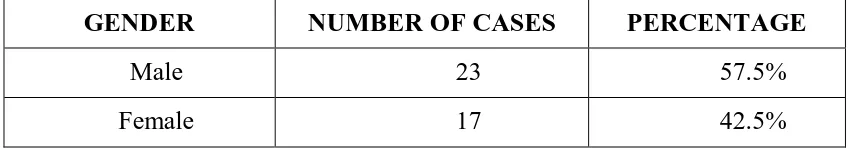
TABLE III: Demographics of the population based on Gender
GENDER NUMBER OF CASES PERCENTAGE
Male 23 57.5%
Female 17 42.5%
Table III shows sex distribution of the population included under our study. Majority(57.5%) of the population with oral squamous cell carcinoma were males.
CHART II : Chart II shows gender distribution of patients with oral squamous cell carcinoma in our study
0 5 10 15 20 25
[image:71.595.107.513.338.598.2]57
Table IV: Clinical and Histopathological characteristics
S.no Age Sex Site Grade Nodal status
1. 60 F Tongue PD +
2. 63 M Tongue MD +
3. 40 F Buccal mucosa MD +
4. 64 M Buccal mucosa PD +
5. 60 F Tongue MD +
6. 40 F Lip MD +
7. 37 F Tongue PD +
8. 52 M Soft palate MD -
9. 56 M Tongue MD +
10. 53 M Tongue WD -
11. 52 M Tonsillar fossa MD -
12. 60 M Soft palate MD -
13. 45 F Buccal mucosa WD -
14. 56 M Buccal mucosa MD -
15. 68 M Tongue WD -
16. 55 F Buccal mucosa MD -
17. 50 M Soft palate MD -
18. 65 F Tongue WD -
19. 65 F Lip PD +
20. 70 M Tonsillar fossa WD -
21. 70 F Retromolar trigone WD +
22. 58 M Buccal mucosa MD -
58
24. 49 M Retromolar trigone WD -
25. 44 M Tongue MD +
26. 56 M Tonsillar fossa MD -
27. 62 M Tonsillar fossa MD +
28. 60 M Retromolar trigone MD -
29. 43 F Alveolar margin WD -
30. 65 M Tonsillar fossa MD -
31. 45 M Tonsillar fossa MD -
32. 55 M Buccal mucosa WD -
33. 60 F Floor of mouth MD +
34. 61 F Lip PD +
35. 40 M Tongue MD +
36. 60 F Lip WD +
37. 60 M Retromolar trigone MD +
38. 48 M Tongue MD +
39. 63 F Tonsillar fossa MD +
40. 60 F Lip WD +
WD - Well differentiated, MD – Moderately differentiated, PD - Poorly differentiated, - Absent, + Present.
[image:73.595.102.530.69.513.2]59
TABLE V: Distribution of tumour within the oral cavity
S.NO SITE OF THE TUMOUR NUMBER OF
PATIENTS
PERCENTAGE
1. Tongue 11 27.5%
2. Buccal mucosa 7 17.5%
3. Tonsillar fossa 7 17.5%
4. Lip 5 12.5%
5. Retromolar trigone 4 10%
6. Soft palate 3 7.5%
7. Alveolar margin 2 5%
8. Floor of mouth 1 2.5%
60
CHART III: Chart III demonstrating the distribution of tumour within oral cavity.
0 2 4 6 8 10
12 11
7 7
5
4
3
2
61
TABLE VI: Histopathological grade of the tumour
GRADE NUMBER OF CASES PERCENTAGE
Well differentiated 12 30%
Moderately differentiated 23 57.5%
Poorly differentiated 5 12.5%
Table VI shows the histopathological grade of oral squamous cell carcinoma in the patients included in the study. Majority of population had moderately differentiated grade of Squamous cell carcinoma.
CHART IV: Chart IV shows the histopathological grade of oral squamous cell carcinoma of the population of our study.
0 5 10 15 20 25
Well differentiated
Moderately differentiated
Poorly differentiated 12
23
[image:76.595.134.499.381.600.2]62
PATTERN OF IMMUNOSTAINING OF MOLECULAR MARKERS:
Immunostaining of molecular markers E-cadherin and Vimentin were done in our study. Staining for E-cadherin demonstrated membrane pattern of staining. Staining of Vimentin demonstrated cytoplasmic pattern of staining.
TABLE VII : Scoring of molecular marker E-cadherin & Vimentin in patients with oral squamous cell carcinoma
S.NO HPE NO E- CADHERIN VIMENTIN
PS IS TS IR PS IS TS IR
1. 1688/17 2 2 4 Low 3 3 9 High
2. 1778/17 3 3 9 High 3 3 6 High
3. 2107/17 3 3 9 High 3 3 9 High
4. 2848/17 2 2 4 Low 3 3 9 High
5. 3346/17 2 3 6 High 3 3 9 High
6. 3364/17 4 3 12 High 3 3 9 High
7. 3385/17 2 2 4 Low 4 3 12 High
8. 3397/17 4 3 12 High 1 2 2 Low
9. 3423/17 3 3 9 High 3 3 9 High
63
11. 3693/17 4 3 12 High 1 2 2 Low
12. 3694/17 4 3 12 High 1 2 2 Low
13. 3695/17 4 3 12 High 1 2 2 Low
14. 3722/17 3 3 9 High 2 2 4 Low
15. 3734/17 3 3 9 High 0 0 0 Neg
16. 3736/17 4 3 12 High 3 2 6 High
17. 4107/17 4 1 4 Low 2 3 6 High
18. 4139/17 4 3 12 High 2 2 4 Low
19. 4141/17 3 2 6 High 3 3 9 High
20. 4265/17 4 2 8 High 0 0 0 Neg
21. 1962/18 4 3 12 High 2 3 6 High
22. 1966/18 3 3 9 High 1 2 2 Low
23. 1973/18 4 3 12 High 2 2 4 Low
24. 1991/18 4 3 12 High 0 0 0 Neg
25. 1993/18 4 3 12 High 2 2 4 Low
26. 2035/18 3 3 9 High 2 3 6 High
27. 2042/18 4 3 12 High 1 2 2 Low
28. 2073/18 4 3 12 High 1 2 2 Low
29. 2076/18 3 3 9 High 1 2 2 Low
30. 2080/18 3 3 9 High 2 2 4 Low
64
32. 2083/18 4 3 12 High 1 2 2 Low
33. 2131/18 3 3 9 High 3 3 9 High
34. 2171/18 2 2 4 Low 3 3 9 High
35. 2348/18 4 3 12 High 3 2 6 High
36. 2838/18 4 3 12 High 3 2 6 High
37. 2888/18 3 3 9 High 2 3 6 High
38. 2980/18 2 3 6 High 2 3 6 High
39. 2982/18 3 3 9 High 2 3 6 High
40. 3038/18 4 3 12 High 3 3 9 High
PS – Proportion score ( Scoring 0 – Negative, 1 - < 10% of the cells taken up the stain, 2 – 10-20% of the cells, 3- 20-50% of the cells, 4- >50% of the cells)
IS – Intensity score( Scoring 0 – Negative, 1 – Weak, 2 – Moderate, 3 – Strong)
TS – Total score( ranges from 0 to 12)
[image:79.595.96.530.71.354.2]65
TABLE VIII: Immunoreactivity of E-cadherin in patients with oral squamous cell carcinoma
IMMUNOREACTIVITY NUMBER OF
CASES PERCENTAGE
Negative (0) 0 0
Low (1 – 4) 5 12.5%
High (>4) 35 87.5%
Table VIII: This Table shows that most of the cases of oral squamous cell carcinoma with E-Cadherin expression were of high immunoreactivity score.
CHART V: The Chart shows the immunoreactivity of E-Cadherin in oral squamous cell carcinoma.
0 10 20 30 40 50
Negative Low High
0
5
[image:80.595.107.494.341.621.2]66
TABLE IX: Immunoreactivity of Vimentin in patients with oral squamous cell carcinoma
IMMUNOREACTIVITY NUMBER OF
CASES PERCENTAGE
Negative (0) 3 7.5
Low (1 – 4) 16 40.0
High (>4) 21 52.5
Table IX shows vimentin expression which was high in 52.5% of the cases and low in 40% of the cases with oral squamous cell carcinoma.
CHART VI: The Chart demonstrates the immunoreactivity of Vimentin in tumour included in our study.
0 5 10 15 20 25
Negative Low High
3
16
[image:81.595.112.470.410.632.2]67
TABLE X: Expression of E-cadherin in patients with oral squamous cell carcinoma in correlation with histopathological grade of tumour.
Histopathological Grade
Immunoreactivity
P Value Negative Low High
Well differentiated - 0(0.0%) 12(100.0%)
0.000* Moderately differentiated - 1(4.3%) 22(95.7%)
Poorly differentiated - 4(80.0%) 1(20.0%) *-statistically significant (P<0.05)
Table X shows that the E-Cadherin expression was statistically significant with histopathological grade of the tumour
CHART VII: Chart showing E-Cadherin expression in relation to histopathological grade of tumour
0 5 10 15 20 25
Negative Low High
[image:82.595.109.512.415.635.2]68
TABLE XI: Expression of E-cadherin in patients with oral squamous cell carcinoma in relation to nodal metastasis
NODAL METASTASIS
IMMUNOREACTIVITY
P VALUE NEGATIVE LOW HIGH
Present - 4(20.0%) 16(80.0%)
.154
Absent - 1(5.0%) 19(95.0%)
Table XI shows that there was no significant relationship between E-Cadherin expression and nodal metastasis.
CHART VIII: This chart shows that E-Cadherin was expressed in tumour with and without nodal metastasis.
0 2 4 6 8 10 12 14 16 18 20
Negative Low High
[image:83.595.138.498.368.588.2]69
TABLE XII: Expression of Vimentin in patients with oral squamous cell carcinoma with correlation to histopathological grade of tumour
*-statistically significant (p<0.05)
Table XII demonstrates significant relationship between expression of vimentin and histopathological grade of tumour.
CHART IX: Chart showing Vimentin expression in relation to grade of tumour 0 2 4 6 8 10 12 14
Negative Low High
3 6 3 0 10 13 0 0 5 Well differentiated Moderately differentiated Poorly differentiated HISTOPATHOLOGICAL GRADE IMMUNOREACTIVITY P VALUE NEGATIVE LOW HIGH
Well differentiated 3(25.0%) 6(50.0%) 3(25.0%)
0.010* Moderately differentiated 0(0.0%) 10(43.5%) 13(56.5%)
[image:84.595.134.500.395.614.2]70
TABLE XIII:Expression of Vimentin in patients with oral squamous cell carcinoma in relation to nodal metastasis
NODAL METASTASIS
IMMUNOREACTIVITY
P VALUE NEGATIVE LOW HIGH
Present 0(0.0%) 2(10.0%) 18(90.0%)
.000* Absent 3(15.0%) 14(70.0%) 3(15.0%)
*-statistically significant (P<0.05)
Table XIII shows the Vimentin expression was statistically significant in oral squamous cell carcinoma with nodal metastasis
CHART X: Chart showing expression of Vimentin in tumour presented with nodal metastasis
0 5 10 15 20 25
Negative Low High
[image:85.595.132.504.388.617.2]71
TABLE XIV: Expression of E-Cadherin and Vimentin in relation to histopathological grade in patients with nodal metastasis
Histopathological grade Nodal metastasis (N=20) E-cadherin
immunoreactivity Vimentin immunoreactivity
Low High P value Low High P
value
Well
differentiated 3
0 (0%) 3 (100%) 0.001* 0 (0%) 3 (100%) 0.477 Moderately
differentiated 12
0 (0%) 12 (100%) 2 (16.7%) 10 (83.3%) Poorly
differentiated 5
4 (80%) 1 (20%) 0 (0%) 5 (100%)
*-statistically significant (P<0.05)
E-Cadherin Vimentin
CHART XI: E-Cadherin and Vimentin expression in relation to grade in patients with nodal metastasis
0 2 4 6 8 10 12
Low High Low High
0 3 0 3 0 12 2 10 4 1 0 5
Well differentiated Moderately differentiated
72
Table XV: Expression of E-Cadherin and Vimentin in relation to histopathological grade in patients without nodal metastasis:
*-statistically significant (P<0.05)
E-cadherin Vimentin
CHART XII: E-Cadherin and Vimentin expression in tumour in relation to histopathological grade in patients without nodal metastasis.
0 1 2 3 4 5 6 7 8 9 10
Low High Negative Low High
0 9 3 6 0 1 10 0 8 3
0 0 0 0 0
Well differentiated Moderately differentiated Poorly differentiated
Histopathological grade Nodal metastasis absent (N=20) E-Cadherin
immunoreactivity Vimentin immunoreactivity
Low High P
Value Negative Low High P Value
Well
differentiated 9
0 (0%) 9 (100.0%) 0.351 3 (33.3%) 6 (66.7%) 0 (0%) 0.046* Moderately
differentiated 11
1 (9.1%) 10 (90.9%) 0 (0%) 8 (72.7%) 3 (27.3%) Poorly
73
COLOUR PLATES
COLOUR PLATE 1: Photomicrograph of H & E stained sections of normal oral squamous epithelium (Magnification :100X)
COLOUR PLATE 2: Photomicrograph of the Positive E-Cadherin
74
COLOUR PLATE 3: Photomicrograph of Negative Vimentin
immunohistochemical staining in normal oral squamous epithelium.
75
COLOUR PLATE 4 : Photomicrograph of H & E stained section of Oral Squamous cell carcinoma - Well differentiated grade (Magnification :100X)
76
COLOUR PLATE 6 : Photomicrograph of Vimentin staining showing negative immunoreactivity in Well differentiated grade without nodal metastasis.(Magnification :100X)
77
78
COLOUR PLATE 9: Photomicrograph of H &E stained sections of Moderately differentiated grade of Oral squamous cell carcinoma.(Magnification :100X)
79
COLOUR PLATE 11: Photomicrograph of Vimentin staining with low immunoreactivity in Moderately differentiated grade without nodal metastasis.(Magnification: 400 X)
80
81
COLOUR PLATE 14: Photomicrograph of H&E stained sections of Poorly differentiated Oral squamous cell carcinoma (Magnification :400X)
82
COLOUR PLATE 16: Photomicrograph of Vimentin staining in Poorly differentiated grade with nodal metastasis with high immunoreactive score.(Magnification :100X)
83
DISCUSSION
The majority of Oral cancers are Squamous Cell Carcinoma, and many studies have been done on them with objective of understanding diagnosis, prognosis, and management of this entity.102-106 Epithelial Mesenchymal transition is a biologic process in which cohesive polarized epithelial cells transform into mesenchymal like cells that exhibit no polarization and high mobility. This process is associated with cancer metastasis and invasion, that correlates with poor prognosis. So, We have studied the epithelial marker E-cadherin and mesenchymal marker Vimentin in tumour differentiation and nodal metastasis.
AGE OF OCCURRENCE:
The mean age of the patients included in our study was 55.50 years (range 51-60 years). Most affected age group in a study done by Parul et al were above 50 years old.107 Most of the patients diagnosed in a study done by Alessandro et al were between 51 and 70 years(53.9%)108
GENDER DISTRIBUTION:
84
have also been reported in study done by Xinjia et al, which was about 70%.109 The Incidence of Oral Cancer in Males was 53.2% and females was 46.8% in study done by Abdulrahman et al.110
SITE DISTRIBUTION:
In a study done by Susam et al, Tongue (62.1%) was the most common site of squamous cell carcinoma.111 Site distribution of Oral squamous cell carcinoma are tongue - 37% followed by alveolar mucosa/gingiva - 20% and floor of mouth -19% was the result of study by Fabio et al.112
The Commonest tumour site in our study group was Tongue(27.5%), followed by buccal mucosa(17.5%) and tonsillar fossa(17.5%).
HISTOPATHOLOGICAL GRADE:
Most of the cases of Oral squamous cell carcinoma were Moderately differentiated grade(57.5%)in our study.