White Rose Research Online URL for this paper:
http://eprints.whiterose.ac.uk/89509/
Version: Accepted Version
Conference or Workshop Item:
Krishnan, Rajesh, Hodge, Victoria Jane orcid.org/0000-0002-2469-0224, Austin, Jim
orcid.org/0000-0001-5762-8614 et al. (1 more author) (2010) A Computationally Efficient
Method for Online Identification of Traffic Control Intervention Measures. In: 42nd Annual
UTSG Conference, 05-07 Jan 2010.
[email protected] https://eprints.whiterose.ac.uk/ Reuse
Items deposited in White Rose Research Online are protected by copyright, with all rights reserved unless indicated otherwise. They may be downloaded and/or printed for private study, or other acts as permitted by national copyright laws. The publisher or other rights holders may allow further reproduction and re-use of the full text version. This is indicated by the licence information on the White Rose Research Online record for the item.
Takedown
If you consider content in White Rose Research Online to be in breach of UK law, please notify us by
A COMPUTATAIONALLY EFFICIENT METHOD FOR ONLINE
IDENTIFICATION OF TRAFFIC CONTROL INTERVENTION MEASURES
Dr Rajesh Krishnan Dr Victoria Hodge
Research Associate Research Associate
Imperial College London University of York
Prof. Jim Austin Prof. John Polak
Professor Professor
University of York Imperial College London
Abstract
Adaptive traffic control systems such as SCOOT and SCATS are designed to respond to changes in traffic conditions and provide heuristically optimised traffic signal settings. However, these systems make gradual changes to signal settings in response to changing traffic conditions. In the EPSRC and TSB funded FREEFLOW project, a tool is being designed to rapidly identify severe traffic problems using traffic sensor data and recommend traffic signal plans and UTC parameters that have worked well in the past under similar traffic conditions for immediate implementation. This paper will present an overview of this tool, called the Intelligent Decision Support (IDS),that is designed to complement adaptive traffic control systems.
The IDS is essentially a learning based system. It requires an historic database of traffic sensor data and traffic control intervention data for the application area as a knowledge base. The IDS, when deployed online, will monitor traffic sensor data to determine if the network is congested using traffic state estimation models. When IDS identifies congestion in the network, the historic database is queried for similar congestion events, where the similarity is based on both the severity and the spatial pattern of congestion. Traffic control interventions implemented during similar congestion events in the historic database are then evaluated for their effectiveness to mitigate congestion. The most effective traffic control interventions are recommended by IDS for implementation, along with an associated confidence indicator.
The IDS is designed to work online against large historic datasets, and is based on traffic state estimation models developed at Imperial College London and pattern matching tools developed at the University of York. The IDS is tested offline using Inductive Loop Detector (ILD) data obtained from the ASTRID system and traffic control intervention data obtained from the UTC system at Transport for London (TfL) during its development. This paper presents the preliminary results using TfL data and outlines future research avenues in the development of IDS.
Introduction
The traffic management scheme in the UK involves manual monitoring and interventions to supplement the automated traffic control systems in place. For example, the motorway network in the UK is monitored and controlled by the National Traffic Control Centre (Highways Agency 2009) and the road network in London is monitored and controlled by the staff at the London Traffic Control Centre (LTCC) (Barton 2004). The network managers in LTCC have access to almost half of the signals in London, and they can change the signal timings or implement other interventions such as changes to SCOOT (Hunt et. al. 1981) parameters in response to traffic problems. Such intervention measures are often based on the operational experience of the person handling the problem at the traffic control centre.
Real World
Sensors
State Estimation
State Prediction
Intervention Needed?
Strategy Selecti Yes
the travelling public. The traffic management component of the work within FREEFLOW is called Intelligent Decision Support (IDS), which forms the focus of this paper.
The rest of this paper is organised as follows. The next section provides an overview of the IDS functionality. The next two sections will present the state estimation and pattern-matching & intervention recommendation functionalities within the IDS. The following section will describe the data from London used to test the methods presented here. This will be followed by results and discussion, followed by conclusions.
Intelligent Decision Support
The objective of the IDS component within FREEFLOW is to (a) determine if there is a traffic problem using near-real-time data from traffic sensors and systems, and (b) recommend traffic control interventions if problems are identified. The IDS is a knowledge-based system that uses information about past intervention actions to suggest new interventions. The system is being designed to work online in a system environment where near-real-time traffic data are accessible, and hence needs to be computationally efficient.
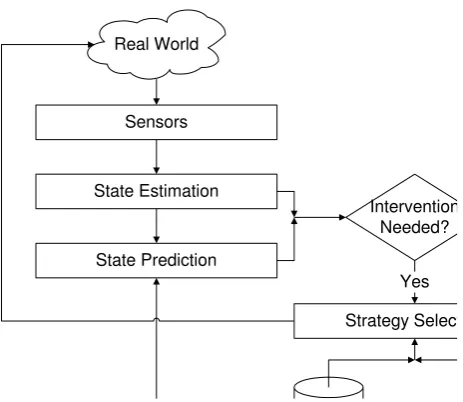
[image:3.595.197.429.346.547.2]The two main components within IDS are state estimation and pattern-matching for intervention identification. A logical overview of the IDS system is given in Figure [1] below.
Figure 1: Logical overview of IDS
IDS monitors traffic sensor data, typically flow and occupancy from Inductive Loop Detectors (ILD), at regular intervals (e.g. 5 minutes) for an area of interest. The state identification algorithm is applied to each of the ILD, each representing a traffic link, separately. The output of the state identification algorithm is binary: 0 if the link is uncongested and 1 if the link is congested. If one or more links are congested, the pattern-matching component will search for a suitable traffic control intervention. The search consists of identifying the time periods in the past when the traffic sensor data from all the ILDs in the area is most similar to the currently observed data. All the traffic control interventions during such similar time periods are identified.
including the possibility of a no action as the best intervention. The subsequent sections will present the state estimation and pattern-matching components in detail.
State estimation
A number of attempts to automatically determine the traffic state is available in the academic literature. Lao et al. (2004) use Fuzzy Logic to classify the traffic state into uncongested,
“crowded” and congested using Fuzzy Logic; however, they used driver inputs rather than
traffic sensor data. Narayanan et al. (2003) also used Fuzzy Logic to classify traffic using speed and inter-vehicle distance as input variables, using fixed thresholds in their classification method. Threshold based methods are generally not transferrable since the occupancy values reported by each ILD will depend on its electromagnetic sensitivity, and the thresholds could be different for different ILDs. Jiang et al. (2003) used Fuzzy Clustering of traffic sensor data consisting of flow, occupancy and spot-speed to cluster traffic into four states representing increasing levels of congestion. Of the above models, only the method presented in Jiang et al. (2003) provide a method to automatically identify the traffic state using traffic sensor data. However, the study does not provide a comprehensive evaluation of the proposed method. Moreover, the traffic states do not correspond to known traffic states in traffic engineering, though this criticism can be addressed by reducing the number of clusters in the proposed method. However, it is not clear if the modified method will correctly classify traffic into congested and uncongested states.
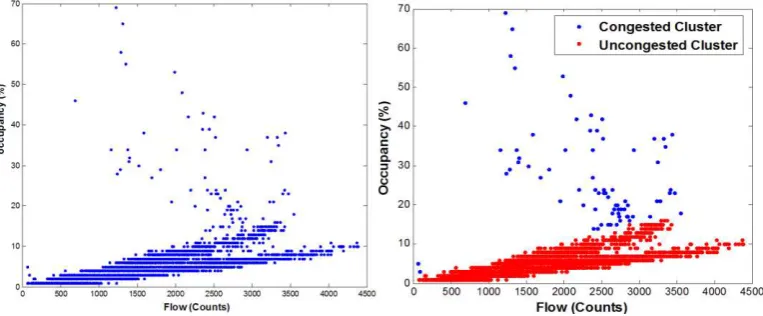
[image:4.595.117.499.420.578.2]On the other hand, it is rather straightforward to visually classify traffic into congested and uncongested states using a scatter-plot of flow and occupancy values. Occupancy increases as the flow increases during the uncongested regime, and occupancy decreases as the flow increases during the congested state; see Figure [2] for illustration. However, it is not straightforward to develop an algorithm that can differentiate between the two traffic states. Direct application of a clustering algorithm, such as the k-means clustering (MacQueen 1967) method, lead to a number of congested data points being identified as uncongested. To address this problem, a two-step clustering approach was developed (Han et. al. 2009).
Figure 2: An example of the flow-occupancy plot of real ILD data
1. This first step is to cluster the data points into two clusters roughly representing congested and uncongested regimes using k-means clustering. The distance metric used is cosine, which uses the difference between the angles made by two different data points with the origin to determine cluster memberships. The use of the cosine distance metric takes advantage of the fact that the flow vs. occupancy curve is linear in the congested regime, and most of the uncongested data points should be grouped in the same cluster. However, due to the range of occupancy values in the congested regime, some of the congested data points may be classified into the first cluster of uncongested data points.
Pattern-matching
The pattern-matching function of IDS is responsible for identifying time periods in the past when the traffic state, as represtented by ILD readings, is as close to the current observation as possible. The pattern-matcher is based on the k-Nearest Neighbour (k-NN) technique implemented using the Advanced Uncertain Reasoning Architecture (AURA) technology (Hodge & Austin 2005) from the computer science discipline. Given an observation vector Xn, and a dataset of past observations {X}, the k-NN method identifies k nearest neighbours of Xn in {X} using a distance metric, where X can be a multi-variate observation. The commonly used distance metrics in k-NN such as the Euclidean distance, unit map, Mahalanobis distance, city block distance and Minkowski distance are insensitive to the position of the variables {x} within X. In other words, these distance metrics provide a measure of the separation between two observations of X in multi-dimensional space but not the direction of separation. This is an important shortcoming when applied to traffic flow data from a number of sensors since the distance metrics do not differentiate between differences in the loction of congestion, but only its magnitude (Krishnan et. al. 2010).
For example, consider two observations of traffic flow data from two different ILDs, a and b,
}
,
{
f
a1f
b1 and{
f
a2,
f
b2}
. The Euclidean distance between the two observations is unity if theflow values at the first ILD between the two observations differ by unity with no differences in the flow at the second ILD or vice versa. However, the two scenarios represent different spatial patterns in traffic. To provide a simple numeric example, the distance from (0, 100) and (100, 0) to (0, 0) is the same, while a flow of 100 on ILD-a and ILD-b clearly form different traffic patterns.
The concept of Centre of Mass (CM) was introduced in the feature vector {X} to address this problem. Before the details of this refinement are presented, a brief overview of the AURA is given below. The AURA technology relies on binary searching for computational efficiency. The feature vector is converted to a binary string using a process called quantisation. The quantisation process involves defining the range and precision of each variable in the feature vector X, resulting in separate bins for different ranges of the variables. For example, for an integer-valued variable such as vehicle count per 5 minutes with range 0-9 and 5 bins then
each bin would have width 2: bin 0 {0,1}, bin 1 {2,3} …bin 4 {8,9}. For a real-valued variable such as average speed with range 0.0-9.999 and 5 bins then each bin would have width 2:
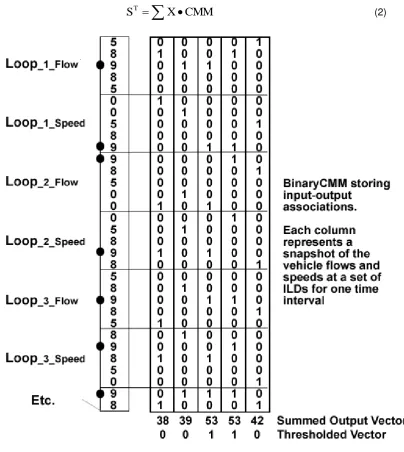
bin 0 [0,1.999], bin 1 [2.0,3.999] …bin 4 [8.0,9.999]. The bins for all the variables in the feature vector are concatenated to create the binary string. The bins corresponding to the values in Xh in historic data {X} are marked 1 while the other bins are marked 0 in the binary string. The storage structure consisting of binary strings for all the observations in {X} is called Correlation Matrix Memory (CMM) (Austin et. al. 1998).
For each new observation Xn, the input vector is represented using a set of parabolic kernels, with one kernel for each variable x within X. The kernel density is estimated using Equation [1] given below.
2
2 x 2 2
)
max(
where
2
)
max(
x x xj xq xb
b
bin
bin
b
Kernel
(1)Where, max(b) is the maximum number of bins across all variables, |binxq – binxj| is the number of bins separating the bin mapped to by xq from the bin mapped to by xj, and bx is the number of bins for variable x.
S
T
X
CMM
(2)Figure 3: Illustrating the application of kernels to CMM to identify the k-nearest neighbours
Four different centres of mass (CM) metrics were tested, along with original AURA matching, in order to find the best method for identifying similar incidents. The equation for calculating the CM is as follows.
ii i
m
r
m
CM
(3)Where mi is the mass and ri is the distance of object i from the origin.
However, the notion of distance and the mass in the context of binary input vectors are different for the four CM metrics. The CM’s metrics used are given below.
CM-I:
m
a
bin
aj
bin
a0 and ra is calculated using the geo-coordinates CM-II:
m
a
max(
b
)
2
bin
aj
bin
a0
a
2andr
a
bin
aj
bin
a0 CM-III:
m
a
max(
b
)
2
bin
aj
bin
a0
a
2 and ra = the ILD reading CM-IV: ma = the ILD reading and ra is calculated using the geo-coordinates (Easting
and Northing) of the ILDs.
Data from London
Two datasets from Transport for London (TfL) were used to test the models presented above. SCOOT ILD data, consisting of flow and occupancy aggregated at 15-minute intervals, was obtained from the ASTRID system. In addition, traffic control interventions were obtained from the UTC system logs. Both the above datasets were obtained for a 12-month period from 1st April 2008 to 31st March 2009. While the above data was obtained for the whole of central London, only a sub-network around the Hyde Park Corner (HPC) was used for this study. Data from 32 ILDs in the study area shown in Figure [4] was used for this study.
The objective of the exercise is to determine if the IDS technique can identify similar incidents in the historic data. Hence, five serious or severe congestion events in HPC area
identified in the TfL’s LTIS system (Barton 2004) were used for validation of the IDS pattern-matcher.
Congestion event on 20th May 2008
Congestion event on 17th June 2008
Equipment fault on 14th May 2008
Spillage on 15th May 2008
Broken down vehicle 6th June 2008
The congestion event on the 20th May caused congestion in Park Lane leading into Hyde Park corner, the northern arms of HPC and the link from Knightsbridge leading into HPC.
The congestion event on the 17th of June also caused congestion in Park Lane leading into HPC, but the congestion extended East into Piccadilly, which caused congestion on the northern arms of HPC, and congestion was observed on Grosvenor Place leading into HPC, and also on the Southern and Eastern arms of HPC.
Results
The objective of the test is to determine how accurately the IDS method can identify time periods with similar congestion patterns. The duration of both the events mentioned above is more than one hour. Hence, given one time period within the duration of the event as input, it is expected that IDS should identify other time periods during the same event as time periods with similar congestion patterns. Moreover, IDS should identify other time periods when the congestion pattern was similar. In this section, the results consisting of top 5 matches and a qualitative analysis of the results are presented.
The ILDs are grouped together to form locations when determining the spatial accuracy of the match. For example, a given location on the road may have ILDs N01/381a and N01/381b on two separate lanes. Such ILDs are grouped together to form locations. The spatial accuracy of the match is determined based on the number of congested locations identified by the match.
higher value of FP means that the identified matches are congested at different locations. False negative (FN) values indicate the number of sensors that are congested during the input time period, but not during the matched time period. Table [6] shows aggregate results of the methods for all the incidents.
Figure 4: The area of London used for this study (Source: Transport for London)
Matches AURA CM-I CM-II CM-III CM-IV
FP
FN
FP
FN
FP
FN
FP
FN
FP
FN
1
1
1
0
2
1
0
0
2
1
1
2
1
0
1
1
0
0
2
0
0
2
3
0
0
2
1
0
0
1
1
2
1
4
1
0
1
0
0
1
0
1
0
4
5
0
2
0
0
2
0
1
0
0
0
[image:8.595.110.532.524.686.2]Total
3
3
4
4
3
1
4
4
3
8
Table 1: Results for congestion event on 20th May 2008
Matches AURA CM-I CM-II CM-III CM-IV
1
0
1
0
1
0
1
0
3
0
1
2
0
0
0
0
0
2
0
1
1
2
3
0
3
0
3
2
3
0
2
0
3
4
0
1
1
2
0
0
0
4
1
4
5
0
2
0
3
1
3
0
3
1
4
[image:9.595.66.491.74.201.2]Total
0
7
1
9
3
9
0
13
3
14
Table 2: Results for congestion event on 17th June 2008
Matches AURA CM-I CM-II CM-III CM-IV
FP
FN
FP
FN
FP
FN
FP
FN
FP
FN
1
2
0
1
0
2
0
2
3
2
0
2
2
0
2
1
2
1
1
2
2
1
3
1
1
2
1
3
0
1
2
2
1
4
1
0
2
1
2
1
2
2
2
2
5
2
1
1
0
1
0
0
2
1
2
[image:9.595.64.493.234.395.2]Total
8
2
8
3
10
2
6
11
9
6
Table 3: Results for equipment failure event on 14th May 2008
Matches AURA CM-I CM-II CM-III CM-IV
FP
FN
FP
FN
FP
FN
FP
FN
FP
FN
1
0
0
0
0
0
0
0
0
0
0
2
0
0
0
1
0
1
1
2
2
1
3
1
0
0
1
1
0
0
1
0
1
4
0
1
0
1
0
1
0
1
1
1
5
0
1
2
1
0
1
0
1
0
1
Total
1
2
2
4
1
3
1
5
3
4
Table 4: Results for spillage event on 15th May 2008
Matches AURA CM-I CM-II CM-III CM-IV
FP
FN
FP
FN
FP
FN
FP
FN
FP
FN
1
0
4
0
2
0
2
1
1
0
3
2
0
3
0
2
0
1
1
1
0
2
3
0
2
0
3
0
3
0
5
0
4
4
1
1
0
2
0
3
1
1
0
2
Total
1
12
1
10
1
10
3
12
0
14
Table 5: Results for broken down vehicle event on 6th June 2008
Matches AURA CM-I CM-II CM-III CM-IV
FP
FN
FP
FN
FP
FN
FP
FN
FP
FN
[image:10.595.106.532.162.221.2]Total
13
26
16
30
18
25
14
45
18
46
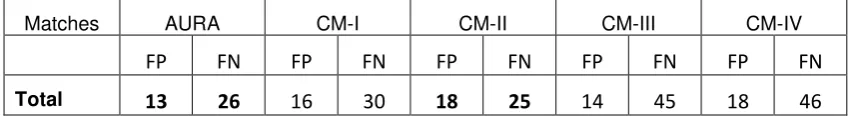
Table 6: Overall performance comparison of pattern-matching techniques
Discussion
FN indicates a more serious (from FREEFLOW perspective) problem of missed links in the match than FP. For example, if all the sensors that are congested during the current time period (input vector) and a few extra locations are congested during the matched time period (FP), the recommended intervention is still presumably valid as it is capable of easing congestion on the matched links. On the other hand, if some of the sensors that are currently congested are not congested in the matched time period (FN), potentially a different intervention should be used. Hence, a lower value of FN is more important than a lower value of FP.
Keeping these factors in mind, AURA and CM-II perform the best. The use of distance metrics make the match worse than simple AURA. This result was initially unexpected. A plausible explanation for this is that the relatively large number of sensors in the feature vector may obscure the spatial pattern of congestion. Selectively choosing the sensors for matching may solve this problem. . However, selecting ILDs is not simple as different ILDs are required to identify different congestion topologies. We would need to know the congestion topology to preselect the ILDs but the task is to identify (and recognise) congestion which is a circular cause and consequence. Hence, it is important that all the sensors in the area of interest are monitored since a potential problem could occur in any one of the links.
The use of pattern-matching in IDS
The matched time periods with similar congestion patterns forms the input to the rest of the IDS algorithm. The key steps are as follows.
1. IDS has access to a database that contains all UTC interventions. These interventions consist of automated interventions made by a rule-based system based on pre-defined rules and manual interventions made by TfL staff. IDS will identify intervention actions taken during incidents represented by matched time periods. 2. All the interventions thus identified may not have been effective. Hence, the
effectiveness of the interventions will be evaluated using any PI metric. The PI metric can indeed vary depending on the policy objectives of a given LA. The PI needs to be evaluated n time periods after the intervention, since there is a lag time between the application of an intervention and the observation of its effect on the street. The mechanism to find the optimal value of n is a topic of research within FREEFLOW. In addition, the similarity (or closeness) of the match will be taken into account in addition to the PI, providing the intervention recommendation with a confidence factor.
Summary
Two key components of the traffic management module developed within FREEFLOW are state estimation and matching. The spatial accuracy of matches using pattern-matching is critical to the accuracy of the proposed FREEFLOW method. This paper described different configurations of AURA pattern-matcher and tested them against real ILD data from around Hyde Park Corner in central London. The test was carried out using data when incidents were known to be present, and the accuracy of the pattern matcher was determined based on the number of congested locations identified by the matcher. It was recommended that the AURA technology without any modifications and AURA in conjunction with the CM-II distance metric developed in the FREEFLOW project should be used for obtaining accurate location based congestion matches. The use of the output of the pattern-matcher within the IDS traffic management module was also described in the paper. We hope to present our work on the extended IDS technology applied to the London data in the near future.
Acknowledgements
The work reported in this paper forms part of the FREEFLOW project, which is supported by the UK Engineering and Physical Sciences Research Council, the UK Department for Transport and the UK Technology Strategy Board. The project consortium consists of partners including QinetiQ, Mindsheet, ACIS, Kizoom, Trakm8, City of York Council, Kent County Council and Transport for London.
References
Austin, J., Kennedy, J. and Lees, K. 1998. The Advanced Uncertain Reasoning Architecture, AURA, In RAM-based Neural Networks, Ser. Progress in Neural Processing. World Scientific Publishing, 1998, vol. 9, pp. 43–50.
Barton, N. 2004. Keeping London Moving: Real Time Traffic Management Systems and Operations in Transport for London. Proceedings of the 32nd Annual European Transport Conference (ETC), Strasbourg, France. 4-6 October 2004.
Glover, P., Rooke, A. & Graham, A. 2008. Flow diagram, Thinking Highways, 3(3), pp. 20-23.
Han, J., Krishnan, R. and Polak, J. 2009. Traffic state identification using loop detector data. Presented at the International Conference on Models and Technologies for Intelligent Transportation Systems, Sapienza University of Rome, Italy. June 2009.
Highways Agency, 2009. National Traffic Control Centre. Available from
http://www.highways.gov.uk/knowledge/1298.aspx. Accessed on 15th November 2009.
Hodge, V.J. and Austin J. 2005. A Binary Neural k-Nearest Neighbour Technique. Knowledge and Information Systems, 8(3), pp. 276–292.
Hunt, P. B.; Robertson, D. I.; Bretherton, R. D. & Winton, R. I. 1981. SCOOT - A traffic responsive method of coordinating signals. TRRL Laboratory Report 1014. Transport and Road Research Laboratory, UK.
Krishnan, R., Hodge, J. V., Austin, J., Polak, J. W. & Lee, T.C. 2010. On Identifying Spatial Traffic Patterns using Advanced Pattern Matching Techniques, To be presented at the 89th Annual Meeting of the Transportation Research Board, Washington D.C., USA, 10-14 January 2010.
Lao, Y., Yun, M., Tang, S., Wang, C., Yang, X. and Chu, H. 2007. Evaluation Method for Accuracy of Road Traffic State Information. Proceedings of the First International Conference on Transportation Engineering 2007 (ICTE 2007). Chengdu, China. 22-24 July, 2007.
MacQueen, J. B. 1967. Some Methods for classification and Analysis of Multivariate Observations. Proceedings of 5th Berkeley Symposium on Mathematical Statistics and Probability. University of California Press. pp. 281–297.