Development of a quantitative technique to assay changes in markers of neural plasticity in response to intermittent theta burst stimulation
Barbora Fulopova
A report submitted as a partial requirement for the degree of Bachelor of Behavioural Science with Honours in Psychology, at the University of Tasmania, 2015
“I declare that this report is my own original work and that contributions of others have been duly acknowledged.”
2 Acknowledgments
I would like to acknowledge all those that have helped with this project. Firstly, and most importantly, I would like to thank my supervisors, Alison and Mark, for taking on the task of interdisciplinary co-supervision. Thank you for all your help and support, and for offering your expertise to guide this project. Alison, I would like to especially thank you for your endless support through thick and thin. Despite your busy schedule, you have always found time to meet and discuss my work, or to give a helping hand in the lab. I would also like to thank Bill, who had a challenging task of teaching me, a complete laboratory novice, all the basic laboratory techniques and procedures. I appreciate your patience, and your openness to discuss all my questions (and everybody who knows me, knows that I can ask a LOT of questions), so thank you for that!
I would like to thank Jessica, Kim and Andy for helping me to troubleshoot all my immuno runs. Special thanks goes to Aidan, for teaching me how to use his ImageJ plugins, and for making his software freely available for everyone to use.
I also want to thank some of my uni friends that have helped me to keep my sanity over the years. I would like to thank Abbie-Rose for sharing the burden of being psychology honours student completing a neuroscience based project in medical research facility – over and beyond! I would also like to thank to Richard and Marie-Clare for being awesome friends that have always found time to listen and help. Thank you, guys, I couldn’t imagine doing this without you! Sharon, words fail to describe how much of a beautiful friend you were to me over the years. Despite all the difficulties and hardship that the life has brought your way, you have always remained positive and genuinely interested in being there for others. We were
3 I miss you dearly, and I will always remember you for your friendship and kindness that was ever-present in everything you did.
4 Table of Contents
Acknowledgments ... 2
List of Tables and Figures ... 6
Abstract ... 9
Neuroplasticity and its Benefits in Therapeutic Settings ... 10
Motor Learning Paradigms Used to Study Neuroplasticity ... 12
Fast Motor Learning ... 12
Slow Motor Learning ... 13
Motor Learning Induced Plasticity ... 14
Molecular Mechanisms of Use Dependant Plasticity ... 17
Role of Synaptophysin in Presynaptic LTP ... 18
Functional and Structural Changes at Postsynaptic Membrane During Induction of LTP . 19 Role of PSD-95 in the Maintenance of Postsynaptic LTP ... 20
Role of Inhibition in Modulating Neural Activity ... 21
Calretinin and Parvalbumin... 22
Passive Induction of Plasticity Using rTMS ... 23
Effects of rTMS on Motor Learning ... 24
Molecular Changes in Response to rTMS ... 24
Purpose of this study ... 27
Aims and Hypotheses ... 30
Method ... 31
Subjects ... 31
Ethics ... 32
Materials and Procedures ... 32
Tissue preparation and cryosectioning. ... 32
Optimisation of immunofluorescent labelling. ... 33
Experimental tissue treatment. ... 34
Mouse brain atlas generation. ... 35
Microscopy and image analysis. ... 37
Design and data analysis. ... 38
Results ... 38
Aim 1- Immunofluorescent Labelling Optimised in Non-experimental tissue ... 38
Synaptophysin. ... 38
5
Parvalbumin. ... 41
PSD-95. ... 42
Aim 2 - Quantification of Synaptophysin Labelling in the Experimental Tissue ... 42
Primary motor cortex. ... 42
Dorsal striatum... 44
Piriform cortex. ... 45
Power Analysis and Sample Size ... 47
Discussion... 47
Synaptophysin in the Primary Motor Cortex ... 49
Synaptophysin in the Dorsal Striatum ... 49
Synaptophysin in the Piriform Cortex ... 50
Limitations ... 50
Theoretical Implications ... 51
Future Directions ... 52
Conclusion and Contributions ... 54
References ... 55
6 List of Tables and Figures
Page
Table 1 Selected studies investigating synaptic plasticity in primary motor
cortex following motor learning task rodents ………..…….…...…...….. 16
Table 2 Key studies examining effects of rTMS on markers of plasticity in excitatory, and inhibitory cells ………...………...….. 26
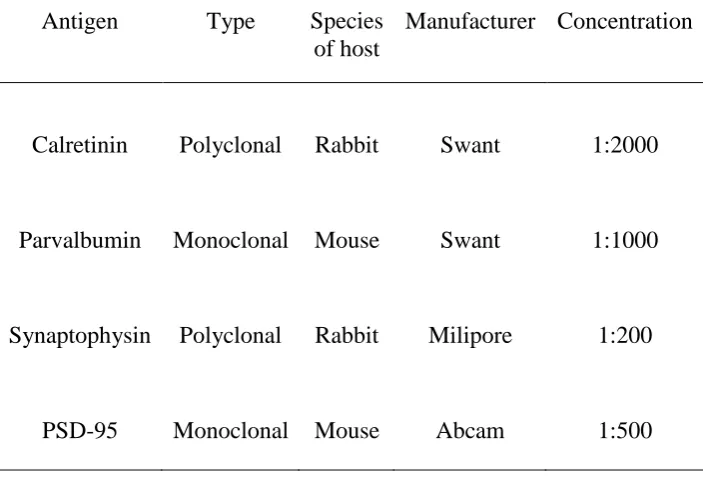
Table 3 Primary antibodies used for immunofluorescent labelling ... 34
Table 4 Means and standard deviation for measures obtained in primary motor cortex ………....…….. 42
Table 4 Means and standard deviation for measures of synaptic puncta in dorsal Striatum ………...…….. 43
Table 5 Means and standard deviation for measures of synaptic puncta in piriform cortex ……….…...…………. 45
Figure 1 Use of species specific electromagnetic coil in humans and rodents ……….………...….. 28
Figure 2 Skilled motor reaching …………...………...……. 29
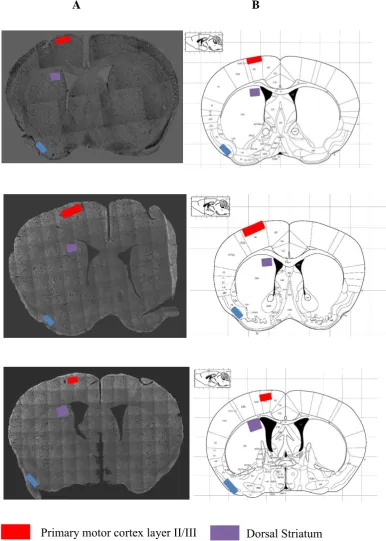
Figure 3 Identification of areas of interest ………...…… 36
7 Figure 5 Pattern of Synaptophysin expression visualised using immunofluorescent labelling and confocal microscopy ……….……….. 39
Table 6 Pattern of Calretinin expression visualised using immunofluorescent
labelling and confocal microscopy ………... 40
Table 7 Pattern of Parvalbumin expression visualised using immunofluorescent labelling and confocal microscopy ………..………. 41
Figure 8 Graphs depicting 95 % confidence intervals around means for measures obtained in primary motor cortex ……….………… 43
Figure 9 Graphs depicting 95 % confidence intervals around means for measures obtained in dorsal striatum ……….…..………. 45
8 Development of a quantitative technique to assay changes in markers of neural
plasticity in response to intermittent theta burst stimulation
Barbora Fulopova
9 Abstract
Delivery of intermittent theta burst stimulation (iTBS) can modulate cortical excitability, and if delivered prior to motor training, it can facilitate performance. These effects suggest that iTBS can induce long term potentiation (LTP) like changes within the associated brain areas. However, currently there is a lack of physiological evidence for such processes. Evidence for molecular changes obtained using animal models of iTBS is inconclusive, and methodologically varied. In addition, the use of human sized coil in laboratory rodents further compromises translational merits of obtained findings. Present study is conducted as part of a larger project that uses translational approach to study neurophysiological mechanisms of iTBS in rodents with species specific stimulation coil. Using
immunohistochemical analysis of mouse brain sections, changes in presynaptic LTP marker Synaptophysin were investigated in eight animals that demonstrated
10 Neuroplasticity and its Benefits in Therapeutic Settings
It is now widely understood that brain circuitry does not remain static
throughout life; rather, it changes in response to environmental demands. This ability of the nervous system to adapt to intrinsic and extrinsic demands is referred to as neuroplasticity (Pascual-Leone, Amedi, Fregni, & Merabet, 2005). It is an ongoing process occurring throughout the lifespan that can be observed at many levels, from molecular and cellular, to systemic and behavioural. Early in life, neuroplasticity is essential for establishment of functional brain circuitry, and it is argued that later in life brain plasticity is crucial to normal functioning, as it forms basis of learning and memory, and underpins crucial rehabilitative responses to brain trauma (Pascual-Leone et al., 2005). There is an ongoing interest in understanding the mechanisms of neural plasticity in an effort to help restore normal functioning in individuals affected by neurological, neurodegenerative, psychiatric or mental disorders. A recent review of neuroplastic adaptations in clinical practice identified two existing ways of
harnessing benefits of brain plasticity: a) delivery of therapies promoting use-dependant neuroplasticity; and b) brain stimulation techniques that induce neuroplasticity passively (Cramer et al., 2011).
11 the treatment (Ridding & Ziemann, 2010). In addition, the neurophysiological
mechanisms of observed rTMS-induced behavioural modifications are still largely unknown, since most of the research focus is on investigating the functional consequences of rTMS-induced change, rather than its underlying neural mechanisms (Pascual-Leone et al., 2011).
It could be argued that in order to fully harness any therapeutic benefits of rTMS, the underlying cellular and molecular mechanisms facilitating the
neuroplastic response must be fully understood. Due to the invasive nature of techniques employed to study cellular and molecular physiology, studies
investigating these processes traditionally involve animal models. Use of animal models for study of human conditions is possible due to many shared homological features of the central nervous system (e.g. similarities in cellular structure, connectivity, organisation) (Kirkcaldie, 2012). Experimental animal models are therefore often used to guide the development of novel treatments and intervention for both physical and mental health conditions found in humans (Gallagher & Rapp, 1997; Gotz & Ittner, 2008; L. W.-H. Lee, 2008; Y. Xu, Barish, Pan, Ogle, &
O’Donnell, 2012).
12 Motor Learning Paradigms Used to Study Neuroplasticity
Motor learning tasks are widely used to study processes of neuroplasticity within the central nervous system. The acquisition of a new motor skill is
demonstrated by enhancement of performance on a motor task over time, which, depending on the task, could be measured as changes in accuracy, speed, reaction time, or movement variability (Dayan & Cohen, 2011). Sequential learning tasks, during which a novel motor sequence is acquired through repeated training, are successfully used to study learning induced plasticity in both humans and animals. Human studies often involve learning of a novel fine motor finger sequence, and offer insights into behavioural and systemic changes that occur during learning of this task (Pascual-Leone et al., 2005). Animal models allow for application of more invasive investigations of cellular and molecular mechanisms that underlie these functional changes. The motor learning paradigm of skilled reaching is commonly used with rodents, as it was found to have a high translational merit with fine motor learning tasks in humans (Whishaw, Pellis, & Gorny, 1992). During skilled reaching training, animals are trained over several days to retrieve a food pellet in a way that forces them to use muscles of their preferred rostral forelimb in a novel way, by precisely controlling movement of their digits and wrist (Whishaw & Pellis, 1990).
Fast Motor Learning
13 may occur over a few days. Using functional neuroimaging methods, it was
demonstrated that fast learning of a sequential motor task is associated with changes in activity in several cortical and subcortical regions, such as dorsolateral prefrontal cortex, primary motor cortex, pre-supplementary motor area, supplementary motor areas, ventral striatum and cerebellum (Floyer-Lea & Matthews, 2005; Grafton, Hazeltine, & Ivry, 2002). Several models were developed that attempt to provide useful framework for interpreting this complex pattern of brain activation (Doyon, Ungerleider, Squire, & Schacter, 2002; Hikosaka, Nakamura, Sakai, & Nakahara, 2002; Miller & Cohen, 2001). Integrating some of the common features of these perspectives, it can be argued that fast learning requires interaction between distinct cortical and subcortical regions, where different cortico-subcortical circuits facilitate learning of different aspects of the task (e.g. spatial coordinates, motor coordinates) (Doyon et al., 2002; Hikosaka et al., 2002). Further then, involvement of prefrontal areas suggest that this stage of learning requires significant amount of attention and executive resources (Miller & Cohen, 2001).
Slow Motor Learning
Slow learning occurs at the later stage of the motor learning process. The functional improvements in this stage are quantitatively smaller, and generally develop at a slower pace (Karni et al., 1998) than those apparent during fast motor learning. As in the case of fast learning, the time course and magnitude of the
14 regions, and performance is facilitated by more rostral regions, such as primary somatosensory cortex, primary motor cortex, dorsal striatum and cerebellum (Floyer-Lea & Matthews, 2005; Lehéricy et al., 2005). Further then, there is a decrease in connectivity between premotor and ventral (associative) striatum, and increased connectivity between primary motor cortex, dorsal (sensorimotor) striatum and cerebellum (Floyer-Lea & Matthews, 2005; Lehéricy et al., 2005). This suggests a shift from skill acquisition (association formation) to habitual (automatic)
performance, behaviour that is more stable over time, and less susceptible to cognitive and other motor task interference (Dayan & Cohen, 2011; Shiffrin & Schneider, 1977; Yin et al., 2009).
Motor Learning Induced Plasticity
Using skilled motor reaching training in rodents, it was found that increases in the accuracy of the task performance is associated with formation of new, and enlargement of existing dendritic spines in the early stage of learning (Xu et al., 2009). In the later stage of learning, after 10 days of training, the increase in
16 Table 1
Selected Studies Investigating Synaptic Plasticity in Primary Motor Cortex Following Motor Learning Task in Rodents
Study Species Findings
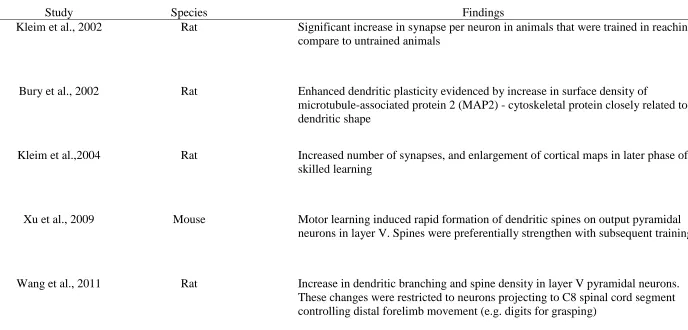
Kleim et al., 2002 Rat Significant increase in synapse per neuron in animals that were trained in reaching compare to untrained animals
Bury et al., 2002 Rat Enhanced dendritic plasticity evidenced by increase in surface density of
microtubule-associated protein 2 (MAP2) - cytoskeletal protein closely related to dendritic shape
Kleim et al.,2004 Rat Increased number of synapses, and enlargement of cortical maps in later phase of skilled learning
Xu et al., 2009 Mouse Motor learning induced rapid formation of dendritic spines on output pyramidal neurons in layer V. Spines were preferentially strengthen with subsequent training
17 Molecular Mechanisms of Use Dependant Plasticity
Use dependant plasticity refers to reorganisation of nervous system in response to incoming neural stimulation produced by an individual’s activity. There are several known physiological mechanisms of neuroplasticity that can be broadly categorised as processes related to neurogenesis, synaptic modifications, and myelination remodelling (Pascual-Leone et al., 2005). Synaptic changes, in
particular, have received a lot of scientific attention, and are now widely considered to be the neural mechanism underpinning learning, memory and skills acquisition (Caroni et al., 2012; Malenka & Bear, 2004; Pascual-Leone et al., 2005). Neural synapses are specialised junction between neurons that allows for transmission of neural signals from the presynaptic membrane of terminal axon to postsynaptic membrane of dendritic spine (Caroni et al., 2012). Electrical impulses in the
presynaptic neuron trigger the release of neurotransmitters at the terminal end of the axon, which act on the postsynaptic neuron, changing its membrane potential
(Malenka & Bear, 2004). These changes of the postsynaptic membrane potential can either facilitate further propagation of the neural signal by excitatory transmission, or block further propagation by inhibitory transmission (Vitureira & Goda, 2013). The pattern and efficacy of synaptic activation are associated with long-term structural and functional changes at the synapse in form of strengthening (long-term
potentiation [LTP]) or weakening (long-term depression [LTD]) of synaptic
18 postsynaptic membrane, it is linked to the number of receptors available to bind the released neurotransmitter (Vitureira & Goda, 2013).
Role of Synaptophysin in Presynaptic LTP
One of the key presynaptic mechanisms facilitating LTP is the process of exo- and endocytosis of synaptic vesicles - a membrane-based organelles situated in the axon terminal that contain the neurotransmitters (Takamori et al., 2006). When action potential reaches axon terminal, it instigates the fusion of the synaptic vesicle with presynaptic membrane, and subsequent release of the neurotransmitters into the synaptic cleft (Sudhof, 2004). After the fusion, the synaptic vesicle is recycled back into to the cell, and refilled with neurotransmitters (Sudhof, 2004). One of the proteins facilitating this cyclic process of vesicular exo- and endocytosis is
Synaptophysin. In particular, Synaptophysin was reported to be directly involved in biogenesis (Cameron, Sudhof, Jahn, & De Camilli, 1991), endocytosis (Daly, Sugimori, Moreira, Ziff, & Llinas, 2000; Kwon & Chapman, 2011), as well as exocytosis (Edelmann, Hanson, Chapman, & Jahn, 1995) of the synaptic vesicle. Functional importance of Synaptophysin has been studied using genetically
manipulated animal strains with inactivated genes (knock-out models) that regulate the synthesis of Synaptophysin and its isoforms (Kwon & Chapman, 2011). It was found that Synaptogyrin/Synaptophysin double knock-out mice exhibited deficiency in establishing both, short and long-term potentiation (Janz et al., 1999). These results were more recently supported by findings of increased exploratory
19 neurotransmitter release into synaptic cleft, Synaptophysin plays a crucial role in facilitation of LTP and associated learning (Janz et al., 1999; Schmitt et al., 2009).
Functional and Structural Changes at Postsynaptic Membrane During
Induction of LTP
Functional changes in synaptic strength are also accompanied by structural changes at the postsynaptic membrane. More specifically, it is suggested that LTP is linked to formation and/or enlargement of dendritic spines (protrusions of dendrites that typically receive neural signal) and axonal sprouting, while LTD is linked to spine shrinkage and dendritic pruning (Matsuzaki, Honkura, Ellis-Davies, & Kasai, 2004; Zhou, Homma, & Poo, 2004). The process of enlargement/shrinkage of dendritic spine is linked to the presence/absence of receptors at the postsynaptic membrane. When excitatory neurotransmitter glutamate is released by presynaptic cell, it binds to N-methyl-D-aspartate receptors (NMDA-R), ligand-gated receptors of postsynaptic membrane. Activation of NMDA-R requires three events to co-occur a) binding glutamate, b) binding of antagonist glycine, and c) depolarisation of the postsynaptic membrane to a point when magnesium (Mg+) block on NMDA-R is removed (Furukawa, Singh, Mancusso, & Gouaux, 2005; Johnson & Ascher, 1987; MacDermott, Mayer, Westbrook, Smith, & Barker, 1986; Malenka & Bear, 2004). The co-occurrence of these three events leads to an opening of the NMDA-R, and a subsequent influx of Calcium (Ca2+) into the cell (Furukawa et al., 2005). The role of Ca2+ inside of the cell is numerous (Clapham, 2007), however, in respect to the LTP,
20 increased phosphorylation and trafficking of
α-amino-3-hydroxy-5-methyl-4-isoxazolepropionic acid receptors (AMPA-R) into the postsynaptic membrane (Hanley, 2008; Malenka, Kauer, Zucker, & Nicoll, 1988). Just like NMDA-R, AMPA-R are a ligand-gated receptors of excitatory glutamate neurotransmitter, and facilitate fast synaptic transmissions (Furukawa et al., 2005). Increased number of AMPA-R in the postsynaptic membrane increases the likelihood of neural signal propagation, as well as it leads to an increase of the overall size of the dendritic spine (Huganir & Nicoll, 2013; Makino & Malinow, 2009). Thus, the insertion of AMPA-R into postsynaptic membrane leads to functional changes in form of increased activity at the synapse, as well as structural changes in form of enlargement of existing or generation of new dendritic spines (Hanley, 2008; Huganir & Nicoll, 2013; Makino & Malinow, 2009).
Role of PSD-95 in the Maintenance of Postsynaptic LTP
21 of the synapse (Vitureira & Goda, 2013) . The best studied protein of PSD is the postsynaptic density protein 95 (PSD-95), that acts as a scaffolding protein for both AMPA and NMDA receptors (Hunt, Schenker, & Kennedy, 1996). Optimal levels of PSD-95 are required for maintenance of activity induced synaptic strengthening (Ehrlich, Klein, Rumpel, & Malinow, 2007). Altered levels of PSD-95 were also linked to abnormal behaviour in animal knock-out models. For example, compared to a wild type mice, genetically manipulated mice with reduced expression of PSD-95 had impaired performance on a water maze task, suggesting deficits with spatial learning and memory formation (Migaud et al., 1998).
Taken together, it can be concluded that PSD-95 plays an important role in facilitating the maintenance of activity dependant LTP on the postsynaptic
membrane, and is a crucial component in the process of learning and memory formation.
Role of Inhibition in Modulating Neural Activity
The plasticity of inhibitory neural networks has received relatively less research attention than its excitatory counterpart, and therefore the role of
22 closely related to changes in cell’s excitability and plasticity (Berridge, 1998;
Clapham, 2007). These proteins are found in interneurons expressing inhibitory GABA neurotransmitter, and generally, the cell only expresses one of the proteins, which makes them well suited for individual examination (Barinka & Druga, 2010).
Calretinin and Parvalbumin.
Parvalbumin positive (PV+) interneurons are mainly involved in feedforward inhibition, and synapse on both soma and axon of the principal excitatory neurons (Hu et al., 2014). Like all calcium-binding proteins, PV+ cells are involved in regulation of intracellular calcium-signalling of the neuron they synapses onto (Caillard et al., 2000). PV+ interneurons are fast conducting cells that have their output sites tightly aligned with calcium channels of the cell receiving their
inhibitory output (Hu et al., 2014). This combination of fast signal propagation, and proximity to the site of influence renders PV+ interneurons a very effective
modulator of neural activity (Chen, Kim, Peters, & Komiyama, 2015). Studies concerned with functional importance of Parvalbumin suggest its involvement in learning and memory formation. For example, the stimulation of PV+ interneurons in
primary motor cortex was linked to acceleration of extinction of reward seeking behaviour (Sparta et al., 2014), and PV induced inhibition was found to facilitate auditory fear conditioning response (Wolff et al., 2014).
Calretinin positive (CR+) cells are predominantly located in the superficial cortical layers II and III (Barinka & Druga, 2010). Using in vitro cellular models, it was found that Calretinin is abundantly present in both presynaptic and postsynaptic neuritis of CR+ cells, and regulates both amplitude and duration of
23 and memory formation was demonstrated using Calretinin knock-out models.
Animals with decreased expression of Calretinin exhibited reduced capacity for LTP (Gurden et al., 1998), abnormal cortical excitability, and impairment of motor coordination (Gall et al., 2003).
Overall, it can be concluded that calcium-binding proteins Parvalbumin and Calretinin are important modulators of neural excitability. By regulating calcium-signalling of connecting cell, they are directly involved in regulation of synaptic plasticity (Clapham, 2007). Further then, the non-overlapping expression of these proteins within the cell makes them a well suited target for individual examination.
Passive Induction of Plasticity Using rTMS
24 Effects of rTMS on Motor Learning
The effects of various rTMS protocols on motor performance have been extensively studied over the last decade in both humans and animals. In human research, it has been demonstrated that delivery of rTMS directly prior to motor learning can enhance the encoding of motor memory (Bütefisch, Khurana, Kopylev, & Cohen, 2004), improve consolidation of learned motor skill (Boyd & Linsdell, 2009) and increase accuracy of motor sequence task performance (Narayana et al., 2014). The facilitatory effects of iTBS protocols were investigated by pairing iTBS with various motor learning tasks. It was found that when delivered immediately before the training, iTBS can enhance the effects of motor learning (Teo, Swayne, Cheeran, Greenwood, & Rothwell, 2011), facilitate movement preparation (Stinear et al., 2009), improve outcomes of a grip-lift exercise in stroke patients (Ackerley, Stinear, Barber, & Byblow, 2014), enhanced the rate of skill acquisition in a
sequential motor task (Narayana et al., 2014). Similarly, in animals iTBS was found to increase accuracy on skilled reaching task (Tang, Bennett, et al., 2015), as well as increase performance on associative tactile learning in rats (Mix, Benali, Eysel, & Funke, 2010).
Molecular Changes in Response to rTMS
25 rTMS (≥ 5 Hz). These findings were replicated by Lenz et al. (2014), who also reported that the enlargement was induced preferentially on dendrites proximal to the cell body. Investigating the effects of high-frequency rTMS on inhibitory circuitry, Funke and Benali (2011) found downregulation of calcium binding protein
Parvalbumin in the inhibitory interneurons, event that could potentially lead to facilitation of excitation in the excitatory neurons receiving signal from these interneurons. Contrary to these findings, Ma et al. (2013) reported increase in LTP associated molecular markers Synaptophysin and PSD-95 following inhibitory rTMS (≤ 1 Hz) in aged mice, findings that were recently replicated by Zhang et al. (2015).
26 Table 2
Key Studies Examining Effects of rTMS on Markers of Plasticity in Excitatory, and Inhibitory Cells
Study Cell type rTMS Findings
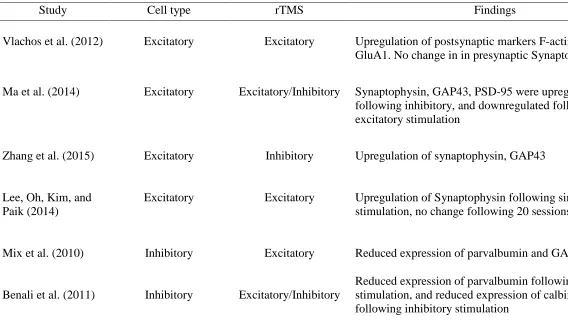
Vlachos et al. (2012) Excitatory Excitatory Upregulation of postsynaptic markers F-actin, and GluA1. No change in in presynaptic Synaptophysin
Ma et al. (2014) Excitatory Excitatory/Inhibitory Synaptophysin, GAP43, PSD-95 were upregulated following inhibitory, and downregulated following excitatory stimulation
Zhang et al. (2015) Excitatory Inhibitory Upregulation of synaptophysin, GAP43
Lee, Oh, Kim, and Paik (2014)
Excitatory Excitatory Upregulation of Synaptophysin following single stimulation, no change following 20 sessions
Mix et al. (2010) Inhibitory Excitatory Reduced expression of parvalbumin and GAD67
Benali et al. (2011) Inhibitory Excitatory/Inhibitory
Reduced expression of parvalbumin following excitatory stimulation, and reduced expression of calbindin
27 Purpose of this study
Investigation of the effects of rTMS at the behavioural and systemic level suggest that these are facilitated by LTP/LTD-like changes commonly associated with use-dependant plasticity. However, the investigation of molecular markers of the suspected LTP/LTD events is currently inconclusive, and methodologically somewhat distanced from the human condition due to the use of oversized human coils in the experimental animal models.
Therefore, the present study aims to investigate whether the effects of rTMS are facilitated by known LTP/LTD like events at the cellular level while maintaining high translational merits of these findings to the human condition. The investigation is undertaken by means of immunochemical analysis, well-established technique for detection of wide range of tissue constituents specific to particular cell subpopulation (De Matos, Trufelli, de Matos, & da Silva Pinhal, 2010).
Present study is conducted within a larger multidisciplinary NHMRC
approved project (CIA Prof Jeffery Summers) that investigates physiological effects of rTMS through translational research, linking the evidence obtained from animal studies to human condition. Within this project, high translational merits of findings obtained from animal experiments are achieved by using a well-established skilled forelimb reaching motor learning in rodents, a paradigm equivalent to skilled manual dexterity learning in humans (Whishaw et al., 1992). In addition, all animal
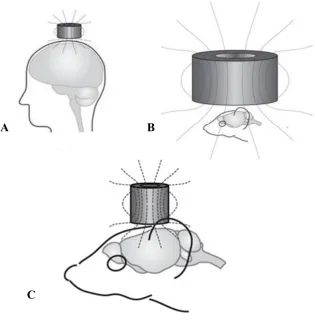
28 Figure 1
Use of species specific electromagnetic coil in humans and rodents. A Focal
stimulation in humans B Magnetic field generated by ahuman sized coil affects the entire rodent brain C Rodent-specific coil has a focal effect comparable to that used in humans (Tang, Bennett, et al., 2015).
Previous findings obtained within this project suggest that iTBS stimulation delivered prior to skilled reaching in rodents has the capacity to facilitate
performancece on this task (Tang, Bennett, et al., 2015). In particular, a significant increase in accuracy was found over a 10 days of training in the group that received iTBS over primary motor cortex contralateral to the dominant paw prior to motor training, compared to the control group that did not receive the stimulation (Tang, Bennett, et al., 2015) (see Figure2). This finding of performance facilitation
A B
29 following iTBS is consistent with those reported in human skilled manual dexterity studies (e.g. Narayana et al., 2014).
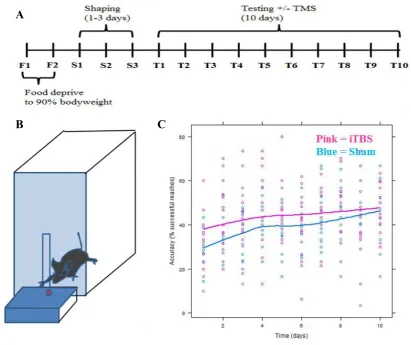
Figure 2
Skilled motor reaching. A Timeline of the behaviours experimentsin days. For motivation to participate, all animals were food deprived to 90% of body weight over 2 days (F1-F2), the paw preference was established over 3 days (S1-S3), followed by 10 days of training (T1-T10). B Skilled reaching training using dominant paw; animals had to retrieve food pellet through slit in a perplex glass box C Animals that received iTBS prior training (pink line) outperformed those that did not (blue line). X axis indicates time, Y axis indicates accuracy as % of successful reaches (Tang, Bennett, et al., 2015).
A
30 At the conclusion of behavioural experiments, the animals in Tang, Bennett, et al. (2015) study were transcardially perfused, the brain tissue was harvested and stored for further molecular analyses. In addition to the two experimental cohorts (iTBS, SHAM), a cohort that was matched for handling only was generated (HAN; animals were taken through the same day/night routine as the experimental cohort, but without any experimental manipulation). Brain tissue from the handling cohort was harvested and stored in the same fashion as the tissue from the experimental cohort. The aim of the current project was to perform molecular analysis by means of immunohistochemistry on the brain tissue obtained from the these three animal groups ( iTBS, SHAM, HAN), and investigate quantitative differences in expression of known neurochemical markers of plasticity between these groups within relevant brain areas of hemisphere contralateral to the dominant paw. Previously, it has been established that 10 days of skilled motor learning in rodents involves slow-motor learning (Kleim et al., 2004), therefore, the brain areas selected for investigation in this study were: a) primary motor cortex that provides output to muscles of the dominant paw (Xu et al., 2009) b) dorsal striatum associated with slow motor
learning (Kleim et al., 2004); and c) the piriform cortex associated with processing of olfactory information (Watson, Kirkcaldie, & Paxinos, 2010) which served as a control area not associated with motor learning, and not exposed to the stimulation.
Aims and Hypotheses
31 high frequency rTMS, suggest the presence of underlying LTP-like neural
mechanisms. Therefore, given that animals in Tang, Bennett, et al. (2015) received high frequency iTBS, a significant increase in the expression of excitatory proteins PSD95 and Synaptophysin, and significant decrease in inhibitory proteins
Parvalbumin and Calretinin was hypothesised in the primary motor cortex and dorsal striatum of hemisphere contralateral to the dominant paw, in the group that received iTBS, compared to both SHAM and HAN groups. No significant difference in expression of these markers was hypothesised in the piriform cortex.
To test these hypotheses, the project was divided into two stages. In the first stage, the immunofluorescent protocols for the markers of interest were optimised in non-experimental tissue obtained from the same strain of mice. In the second stage, the experimental tissue samples were probed using the optimised protocols and the abundance of labelled biomarkers was quantified by means of confocal microscopy and subsequent image analysis.
Method
Subjects
32 of the experiments. In order to ensure that the animals were sufficiently motivated to work for a food reward, they were food deprived to 90% of body weight throughout the whole experimental period. Access to water was unrestricted.
Ethics
All experimental procedures were approved by the Animal Ethics Committee of the University of Tasmania A13168, and were conducted in accordance with the Australian Code of Practice for the Care and Use of Animals for Scientific Purposes.
Materials and Procedures
Tissue preparation and cryosectioning.
33 Optimisation of immunofluorescent labelling.
Several rounds of immunofluorescent labelling were performed on non-experimental tissue to develop an optimal labelling protocol. Two variables were manipulated during the optimisations, a) concentration of the primary antibody, and b) blocking agent used for reduction of the non-specific binding (10 % horse serum, Dako® serum free blocking agent). Each round of optimisation also included a no
primary and no secondary antibody control condition, for determination of the overall auto-fluorescence of the tissue in the absence of each antibody. The final protocol consisted of washing the brain sections with PBS 0.6% Triton X three times for 10minutes, incubating the sections for 30 minutes in Dako® serum free blocking agent to prevent non-specific binding of the antibody. This was followed by an overnight incubation of primary antibodies at 4 oC on a shaker, to ensure complete penetration of the antibody to the tissue (see Table 2 for details of primary
34 Table 3
Primary Antibodies Used for Immunofluorescent Labelling
Antigen Type Species
of host
Manufacturer Concentration
Calretinin Polyclonal Rabbit Swant 1:2000
Parvalbumin Monoclonal Mouse Swant 1:1000
Synaptophysin Polyclonal Rabbit Milipore 1:200
PSD-95 Monoclonal Mouse Abcam 1:500
Experimental tissue treatment.
35 Appendix A for full protocol). After cooling back to the room temperature, the sections were immunofluorescently labelled as per optimised protocol (see previous section ‘Optimisation of Immunofluorescent Labelling’). Alternative treatment of autofluorescence quenching was aimed at reducing the autofluorescence of the tissue caused by PFA reacting with amines and proteins within the tissue (Ramos-Vara & Miller, 2014). This was achieved by taking the sections through potassium
permanganate and potassium metabisulfite washes (see Appendix A).
These procedures, however, did not improve the immunofluorescent labelling for any of the markers of interest. Therefore, all initial labelling (conducted prior tissue treatment procedures) of experimental tissue was reviewed. The best outcome was found in sections obtained from eight out of 12 animals (3 HAN, 3 SHAM, 2 iTBS), that were labelled with Synaptophysin. These eight Synaptophysin labelled experimental samples were used for subsequent quantification analysis.
Mouse brain atlas generation.
To aid the identification of areas of interest in obtained coronal sections, one set of sections was stained using cresyl violet (see Appendix A). The sections were mounted onto Dako® microscopy slides, covered with cresyl violet for 20-30min, and then taken through series of washes from absolute alcohol into xylene, and Dako® glass cover slips were mounted over the sections using Pyrex mounting medium. Cresyl violet produces a Nissl-type stain marking cell nuclei, allowing for
36
[image:36.595.113.500.111.653.2]A B
Figure 3
Identification of areas of interest. A Coronal sections from C57B16 mice strain stained with cresyl violet B Known stereotaxic coordinates (Paxinos & Watson, 2005).
37 Microscopy and image analysis.
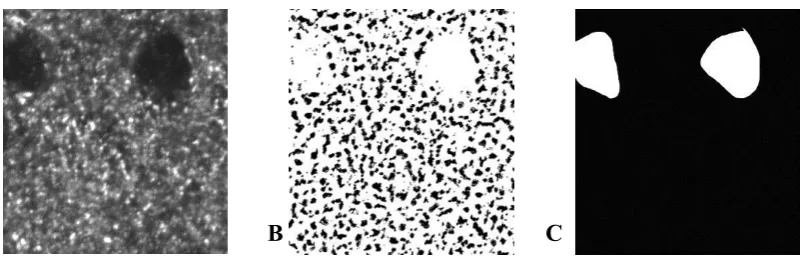
For each area of interest, 4 µm deep stitched images were obtained with x60 water lens using Zeiss Confocal Spinning Disk Microscope. These images were then transformed into a binary black and white representations using a custom
[image:37.595.111.513.429.566.2]segmentation plugin (O’Mara et al., in preparation) for the ImageJ software package (Figure 4). An area of the interest was defined for each image by creating a mask image in Photoshop ® software, discounting the cell bodies and blood vessels. This mask was then overlayed over the segmented image using ImageJ software. The antibody labelling was then quantified and measured within the pre-defined area of interest using the analyse particle function in ImageJ software package (Schindelin, Rueden, Hiner, & Eliceiri, 2015).
Figure 4
Process of image analysis. A Original image obtained from the confocal microscope B Segmented binary image C Mask created in Photoshop ®, black area depicts the neuropil of interest, and white area depicts areas that were excluded from the analysis (cell bodies, blood vessels).
38 Design and data analysis.
Differences in the levels of Synaptophysin expression were compared across the three experimental groups (iTBS, SHAM, HAN), for each area of the interest (primary motor cortex, dorsal striatum and piriform cortex). In particular, three measures were obtained: the number of synaptic puncta normalised per 0.01mm2; the size of individual puncta in µm2; and the percentage of neuropil area covered in
synaptic puncta.
It was intended to analyse the obtained data by Multivariate Analysis of Variance (MANOVA), with significant multivariate effects followed up by series of tests of simple main effects with Bonferroni adjusted α level. If violation of
assumption of homogeneity was suspected, the post-hoc analyses would have been interpreted using Games-Howell procedure, and if violation of multivariate
homogeneity was suspected, Pillai’s criterion would have been used to interpret the multivariate test. However, due to insufficient sample size (iTBS n =2, SHAM n =3, HAN n = 3), the analysis could not be performed. Instead, all the findings were described in terms of descriptive statistics, and 95% confidence intervals around the means were used to interpret statistical significance of the differences in scores for each measure separately.
Results
Aim 1- Immunofluorescent Labelling Optimised in Non-experimental tissue
Synaptophysin.
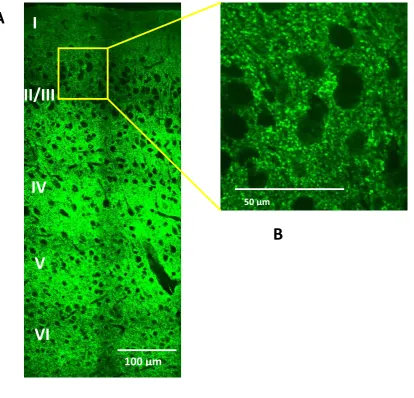
39 fashion (Figure 5). Due to the diminutive nature of the presynaptic site, the best imaging results were achieved using the high magnification x60 lens of the Zeiss Confocal Spinning Disk Microscope. By applying these methods, the labelling was visualised as individual synaptic puncta, suitable for quantification in terms of the size of each individual puncta in µm2, the number of the puncta per 0.01mm2 of the neuropil, and the percentage of the neuropil covered in the puncta.
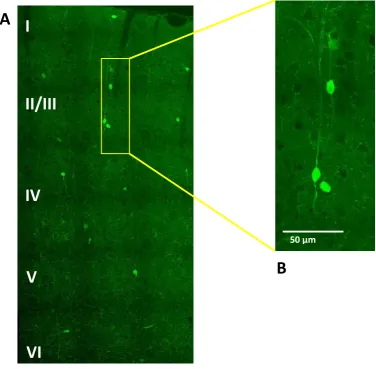
Figure 5
Pattern of Synaptophysin expression visualised using immunofluorescent labelling and confocal microscopy. A Cortical cross-section of primary motor cortex spanning from layer I to VI B Labelling pattern visualising sites of presynaptic activity.
I
II/III
IV
V
VI
B
A
100 µm
40 Calretinin.
[image:40.595.121.498.233.602.2]Anti-Calretinin antibody visualised cells’ somas and axons of inhibitory interneurons (Figure 6). The best imaging results were obtained with the x40 lens of the Zeiss Confocal Spinning Disk Microscope. Obtaining 10 µm deep stacks of images would allow for tracing of the axon, and compare any morphological changes between the three treatment groups using Neurolucida ® software package.
Figure 6
Pattern of Calretinin expression visualised using immunofluorescent labelling and confocal microscopy. A Cortical cross-section of primary motor cortex spanning from layer I to VI B Labelling pattern visualising cells’ somas and axons.
I
II/III
IV
V
VI
100 µm
A
B
41 Parvalbumin.
[image:41.595.116.545.264.688.2]Anti-Parvalbumin antibody produced a prominent labelling of soma, dendrites and axons, visualising overall morphology of the inhibitory interneurons (Figure 7). The best imaging results were obtained with x40 lens of Zeiss Confocal Spinning Disk Microscope. Visualised arborisation was too dense for individual tracing, therefore, the optimal method for quantification of this marker would have been the estimate of the percentage of the area covered by the labelled cells.
Figure 7
Pattern of Parvalbumin expression visualised using immunofluorescent labelling and confocal microscopy. A Cortical cross-section of primary motor cortex spanning from layer I to VI B Labelling pattern visualising cell morphology.
A
B
I
II/III
IV
V
VI
100 um
42 PSD-95.
Anti-PSD-95 antibody obtained for the purpose of the labelling has
unexpectedly failed to produce any results (see manufacturer statement in ‘General Notes’ section of the Appendix B). Typically, PSD-95 labelling appears as individual puncta along the axonal projections, and this type of labelling pattern could be
quantified in terms of the number and the size of puncta within the area of interest as per Synaptophysin.
Aim 2 - Quantification of Synaptophysin Labelling in the Experimental Tissue
Primary motor cortex.
The average number of synaptic puncta per 0.01mm2 was lowest for iTBS
43 Table 4
Means and Standard Deviation for Measures Obtained in Primary Motor Cortex
Number of puncta Size of puncta Area covered
M SD M SD M SD
iTBS 50.62 1.23 0.55 0.28 19.50 7.77
SHAM 55.06 2.37 0.51 0.18 18.33 5.50
HAN 54.10 2.33 0.46 0.09 17.67 2.08
Note. M = Mean; SD = Standard Deviation;Number of puncta is calculated per 0.01mm2 of labelled neuropil; Size of Puncta is in µm2; Area covered is in percentage
Figure 8
44 Dorsal striatum.
[image:44.595.108.527.423.630.2]The average number of synaptic puncta per 0.01mm2 was lowest for the iTBS, followed by HAN and SHAM groups. The average size of synaptic puncta was lowest for the iTBS group, followed by SHAM and HAN groups, and the average percentage of neuropil covered in synaptic puncta was lowest in the iTBS group, followed by the HAN and SHAM. Inspection of plots for 95%CI around means suggested that none of the observed differences in size, number or area covered by puncta between the three experimental groups were statistically significant (Table 5, Figure 9).
Table 5
Means and Standard Deviation for Measures of Synaptic Puncta in Dorsal Striatum
Number of puncta Size of puncta Area covered
M SD M SD M SD
iTBS 46.46 1.70 0.50 0.07 15.50 2.12
SHAM 49.67 2.25 0.55 0.12 19.09 3.65
HAN 47.04 3.99 0.59 0.21 19.00 7.94
45
Figure 9
Graph depicting 95 % confidence intervals around means for measures obtained in dorsal striatum. Number of puncta is calculated per 0.01mm2 of the labelled neuropil.
Piriform cortex.
The average number of synaptic puncta per 0.01mm2 was highest for the SHAM group, followed by iTBS and HAN groups. The average size of synaptic puncta was lowest in the iTBS group, followed by SHAM and HAN group, and the average percentage of neuropil covered in synaptic puncta was lowest in the iTBS group, followed by the HAN and SHAM groups. Inspection of plots for 95%CI around means suggested that none of the observed differences in size, number or area covered by puncta between the three experimental groups were statistically
significant (Table 6, Figure 10).
46 Means and Standard Deviation for Measures of Synaptic Puncta in Piriform Cortex
Number of puncta Size of puncta Area covered
M SD M SD M SD
iTBS 49.71 5.26 0.49 0.07 17.33 3.21
SHAM 52.08 5.07 0.531 0.04 18.76 3.27
HAN 49.19 4.76 0.533 0.10 17.00 4.24
Note. M = Mean; SD = Standard Deviation;Number of puncta is calculated per 0.01mm2 of labelled neuropil; Size of Puncta is in µm2; Area covered is in percentage
[image:46.595.120.453.388.660.2]
Figure 10
Graph depicting 95 % confidence intervals around means for measures obtained in piriform cortex. Number of puncta is calculated per 0.01mm2 of the labelled neuropil.
47 Power Analysis and Sample Size
Due to above mentioned paraformaldehyde induced tissue degradation, four experimental samples had to be excluded from the analysis. To define the optimal number of animals for any future investigation, a G*Power analysis was performed. If significant multivariate effect existed, to detect this with MANOVA (α =.05, 1-β = 0.8) with a large effect size f2 = 0.38 (Murphy, Myors, & Wolach, 2014), data from
at least 21 animals (7 per a group) should be obtained.
Discussion
The main objective of the present study was to investigate whether improved behavioural performance on a skilled reaching task observed following iTBS (Tang, Bennett, et al., 2015) shares a common neurophysiological mechanism with LTP changes induced by motor training alone. It was hypothesised that enhancement in performance following iTBS is facilitated by LTP-like mechanisms observed during use-dependant LTP. However, the data in the current thesis did not support this hypothesis.
48 The second aim was to apply the optimised protocols to tissue samples
obtained from animals in the Tang, Bennett, et al. (2015) study, quantify the abundance of immunofluorescently labelled proteins, and compare the amount of these proteins detected in relevant parts of the brain between the three groups. It was expected that any potential differences in the amount of the proteins of interest would be found in the areas of the brain that are involved in facilitating the performance on skilled motor reaching and/or were directly stimulated. Thus, the areas of interest were primary motor cortex and dorsal striatum of hemisphere contralateral to the dominant paw (Doyon et al., 2002; Whishaw & Pellis, 1990). No changes in abundance of proteins of interest were expected in the control area of olfactory processing (Watson et al., 2010) – piriform cortex in the hemisphere contralateral to the dominant paw.
It was predicted that the enhancement in performance on a skilled reaching task in animals that received iTBS, compared to the group with sham stimulation and handling group was facilitated by LTP-like neural mechanisms. Therefore,
significant increase in Synaptophysin, and significant decrease in Calretinin and Parvalbumin was hypothesised in primary motor cortex and dorsal striatum of the animals that received iTBS, compared to the sham, and handling groups. There was no significant change in the expression of these markers expected in the piriform cortex.
Due to paraformaldehyde induced tissue degradation, data for Calretinin and Parvalbumin were not obtained. The results for Synaptophysin only partially
49 see Tables 8, 9, 10). However, contrary to predicted outcome, there was also no significant difference found in the primary motor cortex and dorsal striatum.
Synaptophysin in the Primary Motor Cortex
The results indicate that in the primary motor cortex of the iTBS treated animals, there were fewer active synapses per 0.01 um2 of the neuropil, and these synapses were bigger, and occupied larger area of the neuropil, than active synapses in both sham and handling group. For all three experimental groups, the 95%CI around the mean were very wide with a substantial overlap, indicating no statistically significant difference between these scores (Cumming & Finch, 2005). Because our sample size was very small, and 95%CI are particularly sensitive to sample size (bigger sample, narrower interval), data were also inspected for overall trends. It was revealed that the differences in average scores between the three groups were very subtle for each measure (count, size, area coverage). For example, there was only 1% difference between the average percentages of the neuropil covered by puncta
between the three groups (19% iTBS, 18% SHAM, 17% HAN; see Tables 4, 5, 6 and Figures 8, 9, 10 for more details). Therefore, it is possible to assume that even with an increased sample size, no meaningful differences would be found between the three experimental groups for this biomarker of synaptic activity.
Synaptophysin in the Dorsal Striatum
Similar to the results from primary motor cortex, when compared to sham and handling groups, the dorsal striatum of iTBS treated animals had fewer active
50 overall differences in average scores between the tree groups was marginal on all three measures (see Table # and Figure #), therefore it is likely that the trend for smaller between the scores are not meaningfully different.
Synaptophysin in the Piriform Cortex
Number of active synapses per 0.01 um2 was highest in the group with sham stimulation, followed by the iTBS group, and control group. The average size of the puncta was biggest in the control group, followed by control group and iTBS, and the average percentage of area covered by the puncta was highest in the sham group, followed by the control group and iTBS. Substantial overlap of 95%CI suggested that there was no statistically significant difference between the scores. Inspection of trends indicated only marginal differences in the average scores between the groups for all measures, suggesting there was also no meaningful difference between these scores. This finding that supports our hypothesis of no significant changes in the abundance of Synaptophysin in piriform area of hemisphere contralateral to the dominant paw.
Limitations
51 Theoretical Implications
The findings of this study did not support the view that iTBS-induced
enhancement of motor performance is facilitated by LTP-like mechanisms similar to that observed during use-dependant LTP on the presynaptic membrane. Our results also indicate that there were no remarkable differences in the abundance of
Synaptophysin between all three groups, including the handling control group, and sham groups that performed skilled reaching training without stimulation. The most likely explanation for this finding relates to the process of homeostatic plasticity. Synaptic plasticity in form of LTP/LTD that was under investigation in this study can be conceptualised as a rapid and input specific form of plasticity, as it requires
coordinated activity of pre- and postsynaptic cell (Caroni et al., 2012). In contrast, homeostatic plasticity refers to a slower compensatory process by which neurons regulate their excitability (Vitureira & Goda, 2013). As too much excitation can be detrimental, cells can regulate their overall excitatory input through a homeostatic process of synaptic scaling - increased excitation on a particular synapse, is accompanied by decrease of excitation on neighbouring synapses (Vitureira & Goda, 2013). Through this compensatory process the cell is able to provide efficient responses to incoming stimuli, while maintaining equilibrium of its overall excitatory input. Unlike synaptic LTP/LTD that occurs locally and rapidly (Xu et al., 2009), homeostatic neuroplasticity is slow acting process that produces lasting global changes (Vitureira & Goda, 2013).
52 et al. (2014), who reported significant up-regulation of Synaptophysin following single session of high-frequency stimulation (rapid LTP like response). However, following 10 sessions of the stimulation, there was no significant change between experimental and control group (possible homeostatic effects). In addition, similar to our findings, following 10 sessions of high frequency stimulation, the overall
difference in average scores between the rTMS and control group were very subtle (Lee et al., 2014). This explanation would also be consistent with findings of Ma et al. (2013) who found no significant change in Synaptophysin following high frequency rTMS delivered over 20 days.
Future Directions
Our findings are in agreement with those of Vlachos et al. (2012), who reported no significant change in presynaptic LTP marker Synaptophysin following high frequency rTMS. However, they also found an increase in postsynaptic markers of LTP, F-actin (microfilament protein involved in restructuring of postsynaptic spines) and GluA1 (subunit of AMPA receptors found on postsynaptic membrane of excitatory neurons). These findings suggest that rTMS affects pre- and postsynaptic sites of excitatory neurons differentially. Differential effects of high frequency rTMS was also reported on inhibitory interneurons (Benali et al., 2011). Excitatory rTMS was linked to increase in protein expression of Parvalbumin positive interneurons, but no change in expression of Calbindin positive interneurons (Benali et al., 2011). Differential effect of high frequency rTMS on diverse classes of neurons suggests that mechanisms of rTMS could be facilitated by the activity of local inhibitory circuits (Funke & Benali, 2011). Different subsets of interneurons preferentially connect onto specific sites of their output neurons (e.g. PV+ interneurons
53 creating a local inhibitory circuits (Chen et al., 2015). As demonstrated by Benali et al. (2011), not all subtypes of inhibitory cells react equally to rTMS, therefore it is possible that these differential effects on certain subtypes of interneurons would translate to differential effects of specific local inhibitory circuits along the excitatory cells. This theoretical reasoning would also be in line with recent findings of Chen et al. (2015), who demonstrated that differential effects of local inhibitory circuits on activity of excitatory neurons play a crucial role in motor-learning induced spine reorganisation.
Taken together, it would be of particular interest to further investigate effect of rTMS on the four markers proposed in this study (presynaptic Synaptophysin and postsynaptic PSD-95 of excitatory cells, and calcium-binding proteins of different subsets of inhibitory cells). Investigation of the effects of rTMS on particular subsets of excitatory and inhibitory cells could be of particular relevance in case of disorders related to the disturbance of excitatory-inhibitory balance in general activity of central nervous system . For example, deficits in neural plasticity are associated with neurodegenerative diseases such as Alzheimer’s (Battaglia et al., 2007), or
54 Conclusion and Contributions
The contribution of the present study to research of synaptic plasticity
following iTBS stimulation is twofold. Firstly, it was demonstrated that the detection of synaptic markers requires careful consideration of a paraformaldehyde fixation treatment, as this was found to interfere with the binding of the antibodies. In particular, the concentration of the PFA and duration of the PFA post-fixation were identified as most likely to influence the binding of the antibody to the antigen, as well as the level of autofluorescence within the tissue.
Secondly, the findings of the present study suggest that following 10 days of stimulation sessions and motor training, or motor training alone there was no
significant difference in the number and size of the active excitatory presynaptic sites. This effect can be attributed to the homeostatic process of synaptic scaling. Although these findings are based on a small sample of animals, and have limited generelisability, it is suggested that any future investigation into the
neurophysiological underpinnings of rTMS induced enhancement in motor
55 References
Ackerley, S. J., Stinear, C. M., Barber, P. A., & Byblow, W. D. (2014). Priming sensorimotor cortex to enhance task-specific training after subcortical stroke. Clinical Neurophysiology, 125(7), 1451-1458.
doi:http://dx.doi.org/10.1016/j.clinph.2013.11.020
Barinka, F., & Druga, R. (2010). Calretinin Expression in the Mammalian Neocortex: A Review. Physiological Research, 59(5), 665-677.
Battaglia, F., Wang, H.-Y., Ghilardi, M. F., Gashi, E., Quartarone, A., Friedman, E., & Nixon, R. A. (2007). Cortical plasticity in Alzheimer’s disease in humans and rodents. Biological psychiatry, 62(12), 1405-1412.
Benali, A., Trippe, J., Weiler, E., Mix, A., Petrasch-Parwez, E., Girzalsky, W., . . . Funke, K. (2011). Theta-burst transcranial magnetic stimulation alters cortical inhibition. The Journal of Neuroscience, 31(4), 1193-1203.
Berridge, M. J. (1998). Neuronal Calcium Signaling. Neuron, 21(1), 13-26. doi:http://dx.doi.org/10.1016/S0896-6273(00)80510-3
Boyd, L. A., & Linsdell, M. A. (2009). Excitatory repetitive transcranial magnetic stimulation to left dorsal premotor cortex enhances motor consolidation of new skills. BMC Neurosci, 10, 72. doi:10.1186/1471-2202-10-72
Bury, S. D., & Jones, T. A. (2002). Unilateral Sensorimotor Cortex Lesions in Adult Rats Facilitate Motor Skill Learning with the “Unaffected” Forelimb and Training-Induced Dendritic Structural Plasticity in the Motor Cortex. The Journal of Neuroscience, 22(19), 8597-8606. Retrieved from
56 Bütefisch, C. M., Khurana, V., Kopylev, L., & Cohen, L. G. (2004). Enhancing
Encoding of a Motor Memory in the Primary Motor Cortex By Cortical
Stimulation (Vol. 91).
Caillard, O., Moreno, H., Schwaller, B., Llano, I., Celio, M. R., & Marty, A. (2000). Role of the calcium-binding protein parvalbumin in short-term synaptic plasticity. Proceedings of the National Academy of Sciences, 97(24), 13372-13377. doi:10.1073/pnas.230362997
Cameron, P. L., Sudhof, T. C., Jahn, R., & De Camilli, P. (1991). Colocalization of synaptophysin with transferrin receptors: implications for synaptic vesicle biogenesis. J Cell Biol, 115(1), 151-164.
Caroni, P., Donato, F., & Muller, D. (2012). Structural plasticity upon learning: regulation and functions. Nature Reviews Neuroscience, 13(7), 478-490. Chen, S. X., Kim, A. N., Peters, A. J., & Komiyama, T. (2015). Subtype-specific plasticity of inhibitory circuits in motor cortex during motor learning. Nat Neurosci, 18(8), 1109-1115. doi:10.1038/nn.4049
Clapham, D. E. (2007). Calcium signaling. Cell, 131(6), 1047-1058. doi:10.1016/j.cell.2007.11.028
Cramer, S. C., Sur, M., Dobkin, B. H., O'Brien, C., Sanger, T. D., Trojanowski, J. Q., . . . Vinogradov, S. (2011). Harnessing neuroplasticity for clinical
applications. Brain, 134(Pt 6), 1591-1609. doi:10.1093/brain/awr039
Cumming, G., & Finch, S. (2005). Inference by eye: confidence intervals and how to read pictures of data. Am Psychol, 60(2), 170-180.
doi:10.1037/0003-066x.60.2.170
Daly, C., Sugimori, M., Moreira, J. E., Ziff, E. B., & Llinas, R. (2000).
57 Vesicles. Proceedings of the National Academy of Sciences of the United States of America, 97(11), 6120-6125. doi:10.2307/122591
Dayan, E., & Cohen, L. G. (2011). Neuroplasticity subserving motor skill learning. Neuron, 72(3), 443-454.
De Matos, L. L., Trufelli, D. C., de Matos, M. G. L., & da Silva Pinhal, M. A.
(2010). Immunohistochemistry as an Important Tool in Biomarkers Detection and Clinical Practice. Biomarker Insights, 5, 9-20. Retrieved from
http://www.ncbi.nlm.nih.gov/pmc/articles/PMC2832341/
Doyon, J., Ungerleider, L., Squire, L., & Schacter, D. (2002). Functional anatomy of motor skill learning. Neuropsychology of memory, 3, 225-238.
Edelmann, L., Hanson, P. I., Chapman, E. R., & Jahn, R. (1995). Synaptobrevin binding to synaptophysin: a potential mechanism for controlling the
exocytotic fusion machine. The EMBO Journal, 14(2), 224-231. Retrieved from http://www.ncbi.nlm.nih.gov/pmc/articles/PMC398074/
Edmonds, B., Reyes, R., Schwaller, B., & Roberts, W. M. (2000). Calretinin modifies presynaptic calcium signaling in frog saccular hair cells. Nat Neurosci, 3(8), 786-790. doi:10.1038/77687
Ehrlich, I., Klein, M., Rumpel, S., & Malinow, R. (2007). PSD-95 is required for activity-driven synapse stabilization. Proceedings of the National Academy of Sciences, 104(10), 4176-4181. doi:10.1073/pnas.0609307104
58 Floyer-Lea, A., & Matthews, P. M. (2005). Distinguishable brain activation networks for short- and long-term motor skill learning. J Neurophysiol, 94(1), 512-518. doi:10.1152/jn.00717.2004
Funke, K., & Benali, A. (2011). Modulation of cortical inhibition by rTMS – findings obtained from animal models. The Journal of Physiology, 589(18), 4423-4435. doi:10.1113/jphysiol.2011.206573
Furukawa, H., Singh, S. K., Mancusso, R., & Gouaux, E. (2005). Subunit
arrangement and function in NMDA receptors. Nature, 438(7065), 185-192. doi:10.1038/nature04089
Gall, D., Roussel, C., Susa, I., D'Angelo, E., Rossi, P., Bearzatto, B., . . . Schiffmann, S. N. (2003). Altered neuronal excitability in cerebellar granule cells of mice lacking calretinin. J Neurosci, 23(28), 9320-9327.
Gallagher, M., & Rapp, P. R. (1997). The use of animal models to study the effects of aging on cognition. Annual review of psychology, 48(1), 339-370. Gotz, J., & Ittner, L. M. (2008). Animal models of Alzheimer's disease and
frontotemporal dementia. Nat Rev Neurosci, 9(7), 532-544.
doi:http://www.nature.com/nrn/journal/v9/n7/suppinfo/nrn2420_S1.html Grafton, S., Hazeltine, E., & Ivry, R. (2002). Motor sequence learning with the
nondominant left hand. Experimental Brain Research, 146(3), 369-378. doi:10.1007/s00221-002-1181-y
Gurden, H., Schiffmann, S. N., Lemaire, M., Böhme, G. A., Parmentier, M., & Schurmans, S. (1998). Calretinin expression as a critical component in the control of dentate gyrus long-term potentiation induction in mice. European Journal of Neuroscience, 10(9), 3029-3033.
59 Hanley, J. G. (2008). AMPA receptor trafficking pathways and links to dendritic
spine morphogenesis. Cell adhesion & migration, 2(4), 276-282.
Hasan, A., Nitsche, M. A., Rein, B., Schneider-Axmann, T., Guse, B., Gruber, O., . . . Wobrock, T. (2011). Dysfunctional long-term potentiation-like plasticity in schizophrenia revealed by transcranial direct current stimulation. Behavioural Brain Research, 224(1), 15-22.
Hikosaka, O., Nakamura, K., Sakai, K., & Nakahara, H. (2002). Central mechanisms of motor skill learning. Current opinion in neurobiology, 12(2), 217-222. Hu, H., Gan, J., & Jonas, P. (2014). Interneurons. Fast-spiking, parvalbumin(+)
GABAergic interneurons: from cellular design to microcircuit function. Science, 345(6196), 1255263. doi:10.1126/science.1255263
Huang, Edwards, M. J., Rounis, E., Bhatia, K. P., & Rothwell, J. C. (2005). Theta burst stimulation of the human motor cortex. Neuron, 45(2), 201-206. doi:10.1016/j.neuron.2004.12.033
Huganir, R. L., & Nicoll, R. A. (2013). AMPARs and synaptic plasticity: the last 25 years. Neuron, 80(3), 704-717. doi:10.1016/j.neuron.2013.10.025
Hunt, C. A., Schenker, L. J., & Kennedy, M. B. (1996). PSD-95 is associated with the postsynaptic density and not with the presynaptic membrane at forebrain synapses. J Neurosci, 16(4), 1380-1388.
Janz, R., Südhof, T. C., Hammer, R. E., Unni, V., Siegelbaum, S. A., & Bolshakov, V. Y. (1999). Essential Roles in Synaptic Plasticity for Synaptogyrin I and Synaptophysin I. Neuron, 24(3), 687-700.
doi:http://dx.doi.org/10.1016/S0896-6273(00)81122-8
60 Karni, A., Meyer, G., Rey-Hipolito, C., Jezzard, P., Adams, M. M., Turner, R., &
Ungerleider, L. G. (1998). The Acquisition of Skilled Motor Performance: Fast and Slow Experience-Driven Changes in Primary Motor Cortex. Proceedings of the National Academy of Sciences of the United States of
America, 95(3), 861-868. doi:10.2307/44200
Kirkcaldie, M. T. K. (2012). Chapter 4 - Neocortex. In C. W. P. Puelles (Ed.), The Mouse Nervous System (pp. 52-111). San Diego: Academic Press.
Kleim, Hogg, T. M., VandenBerg, P. M., Cooper, N. R., Bruneau, R., & Remple, M. (2004). Cortical synaptogenesis and motor map reorganization occur during late, but not early, phase of motor skill learning. J Neurosci, 24(3), 628-633. doi:10.1523/JNEUROSCI.3440-03.2004
Kleim, J. A., Barbay, S., Cooper, N. R., Hogg, T. M., Reidel, C. N., Remple, M. S., & Nudo, R. J. (2002). Motor Learning-Dependent Synaptogenesis Is
Localized to Functionally Reorganized Motor Cortex. Neurobiology of Learning and Memory, 77(1), 63-77.
doi:http://dx.doi.org/10.1006/nlme.2000.4004
Kwon, Sung E., & Chapman, Edwin R. (2011). Synaptophysin Regulates the
Kinetics of Synaptic Vesicle Endocytosis in Central Neurons. Neuron, 70(5), 847-854. doi:http://dx.doi.org/10.1016/j.neuron.2011.04.001
Lee, Oh, B., Kim, S. J., & Paik, N. J. (2014). The molecular evidence of neural plasticity induced by cerebellar repetitive transcranial magnetic stimulation in the rat brain: A preliminary report. Neuroscience Letters, 575, 47-52.
61 Lee, L. W.-H. (2008). Neuroplasticity in an animal model of abnormal stereotyped
motor behavior: Effects of environmental enrichment. UNIVERSITY OF FLORIDA.
Lehéricy, S., Benali, H., Van de Moortele, P.-F., Pélégrini-Issac, M., Waechter, T., Ugurbil, K., & Doyon, J. (2005). Distinct basal ganglia territories are engaged in early and advanced motor sequence learning. Proceedings of the National Academy of Sciences of the United States of America, 102(35), 12566-12571. doi:10.1073/pnas.0502762102
Lenz, M., Platschek, S., Priesemann, V., Becker, D., Willems, L., Ziemann, U., . . . Vlachos, A. (2014). Repetitive magnetic stimulation induces plasticity of excitatory postsynapses on proximal dendrites of cultured mouse CA1 pyramidal neurons. Brain Structure and Function, 1-15. doi:10.1007/s00429-014-0859-9
Ma, J., Zhang, Z., Kang, L., Geng, D., Wang, Y., Wang, M., & Cui, H. (2014). Repetitive transcranial magnetic stimulation (rTMS) influences spatial cognition and modulates hippocampal structural synaptic plasticity in aging mice. Exp Gerontol, 58, 256-268. doi:10.1016/j.exger.2014.08.011
Ma, J., Zhang, Z., Su, Y., Kang, L., Geng, D., Wang, Y., . . . Cui, H. (2013). Magnetic stimulation modulates structural synaptic plasticity and regulates BDNF-TrkB signal pathway in cultured hippocampal neurons. Neurochem Int, 62(1), 84-91. doi:10.1016/j.neuint.2012.11.010
MacDermott, A. B., Mayer, M. L., Westbrook, G. L., Smith, S. J., & Barker, J. L. (1986). NMDA-receptor activation increases cytoplasmic calcium